PMs often misread acquisition spikes as growth. Learn which retention and activation signals show whether users actually find value.

Stop letting unreliable data block features. Treat data as inventory to track quality, ownership, and ship with confidence.

Data shows you what users do, not why. Learn how blending qualitative and quantitative insights fuels real product innovation.

Retention isn’t just about users returning — it’s about delivering value. Learn how to define retention that truly matters.

It’s easy to hide behind charts and justify decisions with shallow metrics. But great product teams resist that urge.

By implementing an effective PDM system, you can foster collaboration, improve decision-making, and accelerate your time-to-market.
Explore Fullstory competitors, like LogRocket, to find the best product analytics tool for your digital experience.

Our Galileo AI Fall ’24 release makes Highlights available to all Pro and Enterprise customers. We’re also debuting Ask Galileo, which enables you to directly ask questions about what you see in session replays.

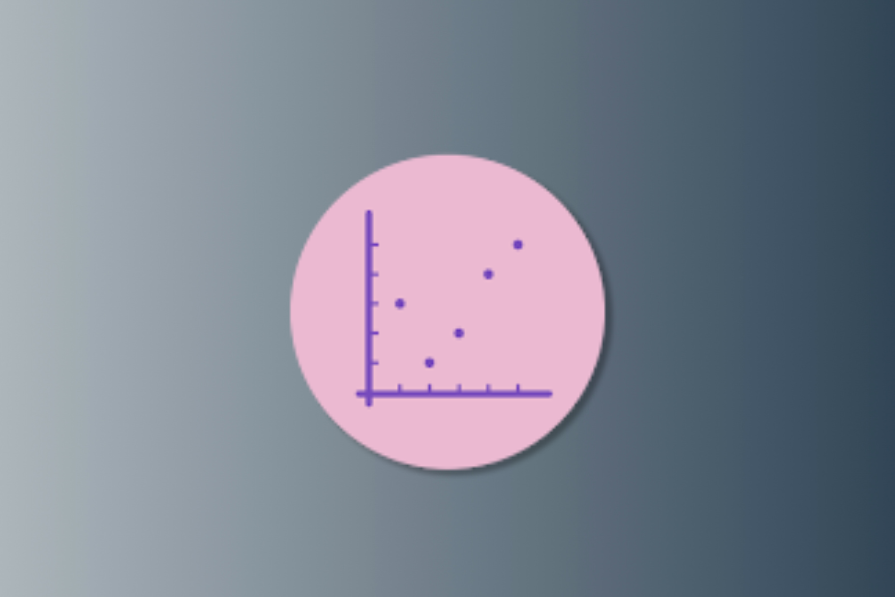
The most common application of correlation and regression is predictive analytics, which you can use to make day-to-day decisions.
This article teaches you how to calculate variance, as well as the tools and software that you need, and common mistakes to avoid.

Subscriber acquisition cost (SAC) refers to the total expense incurred by the business to acquire a new customer or subscriber.

A great value proposition might entice a user in the beginning, but you still need a way to maintain their loyalty for years to come.