Classifying customer needs and incorporating them into a product is no easy task. There are multiple frameworks and tools to help product teams accomplish this, and a popular choice is the Kano model.
The Kano model helps in understanding customers’ needs and prioritizes potential features on the roadmap based on the value they are expected to deliver to users.
In this article, we’ll discuss what the Kano model is, how it works, its features and benefits, and give examples of it in use. We’ll also discuss when to use it and best practices for effectively incorporating it into your product’s processes.
The Kano model is a feature prioritization framework. It’s used to identify important features of a product based on the level of customer satisfaction it can bring to the users.
There are many feature prioritization frameworks other than the Kano model to help product managers. The focus on prioritizing features based on customer satisfaction level differentiates the Kano model from others.
The Kano model was introduced by Noriaki Kano, a quality management professor at the Tokyo University of Science, in 1984. He was inspired to develop this framework while researching customer satisfaction and loyalty improvement factors.
Before the origin of the Kano model, incorporating customers’ complaints and improving popular features was the most adopted method to retain customers. Professor Kano, however, believed that customer loyalty is related to emotional responses to the features.
Noriaki Kano developed the Kano model to measure the ability of features to satisfy customers. He categorized five types of emotional responses to a feature, ranging from dissatisfaction to customer delight. He conducted a study with 900 participants and plotted emotional responses as curves on a Kano reaction graph.
This model helps teams identify potential features that must be prioritized over others, rather than relying on only popular features or customer complaints. Product teams can compare potential features’ customer satisfaction levels against their implementation costs to identify the ones that should be added to the product roadmap.
It is not entirely up to the product team to categorize the potential list of features. An ideal approach would be to conduct a survey amongst a set of existing loyal customers and ask them about their satisfaction level for each potential feature. These features are evaluated against two factors:
Features are plotted on a graph against these two factors to bring out the nonlinear relationship between product function and customer satisfaction. The y-axis on this graph depicts the increasing customer satisfaction and the x-axis indicates the increasing product functionality.
Once the features are plotted on this graph, they can be categorized into one of the five categories based on their position. Each category represents customer reaction: excitement features, performance features, basic features, indifferent features, and reverse features:
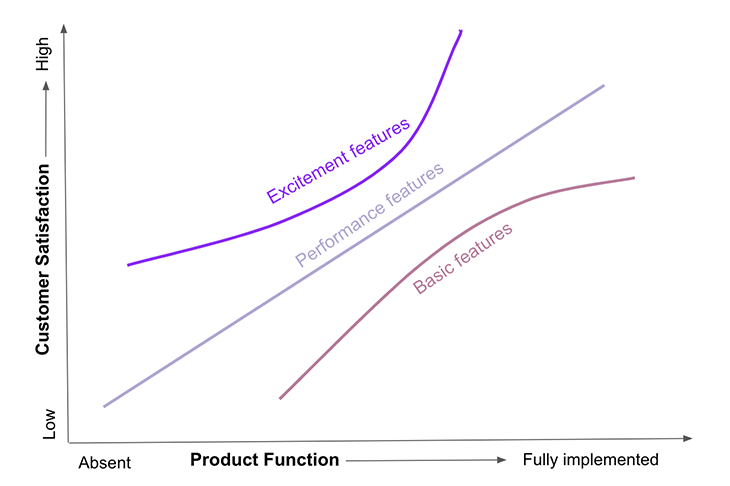
The Kano model identifies five emotional response types to features. Product managers work with their teams to identify a list of potential features for the product and then organize these features into five categories.
These are the features a product must have to function. If these features are missing, customers cannot even use the product.
These are not delighters — they satisfy the basic needs and are taken for granted by the customer. For example, headlights, steering, brakes, and seats are all basic features in a car. Without these, a customer would not even consider buying the car.
Performance features give products a competitive edge over other products in the market. In the economic car segment, for example, apart from the basic features of a car, features like good mileage, safety in accidents, and lower prices would increase customer satisfaction.
Performance features add to basic features and improve product performance, thereby providing more convenience to the user. More performance features in a product lead to more satisfied customers. These features, if not present in the product, will cause dissatisfaction to the customer.
This category of features creates excitement among the target segment. If this type of feature is not present in the product, customers will not miss it and it won’t cause any dissatisfaction to the customers.
However, if delighters are included in the product, the amount of customer satisfaction increases significantly. Excitement or delighter features provide a greater edge over competitor products. These are innovative or unique features that aren’t expected by the customer, but lead to a positive response for the product when added.
Let’s take a car as an example again. Features like a 360-degree camera, an automatic parking ability, blind spot monitoring, car seats with a massager, or keyless entry are all examples of innovative features that lead to customer delight and give a greater edge to the product over the competition.
Indifferent features do not have any positive or negative impact on users. Users will not care if the feature is present and they will not miss it if it’s not. Teams should avoid working on these types of features.
Reverse features are the types of features that can cause dissatisfaction and frustration among users. These should be dropped out of the product altogether — including these in the product would motivate users to consider alternative products.
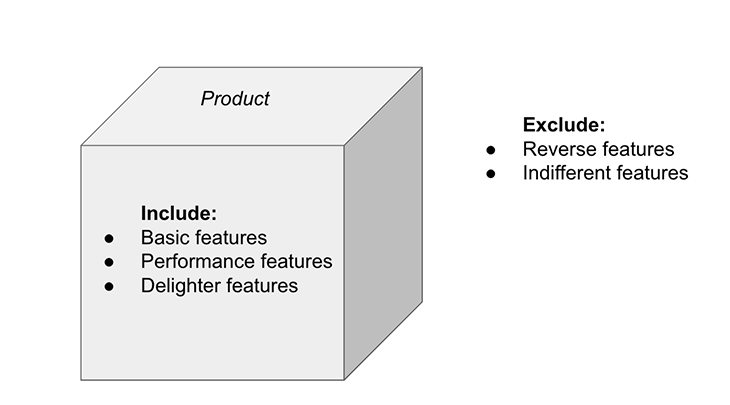
Listing out all the features and then assigning them into these five categories helps product teams prioritize features to be implemented and cut out reverse and indifferent ones.
Product managers can select a group of target customers to fill out a questionnaire. This questionnaire will help them get their sentiment about a potential feature. For example, you can frame a standard questionnaire like this:
| Question | I like it | I expect it | I am neutral | I can tolerate it | I dislike it |
| Functional | |||||
| How would you feel if the product had…? | |||||
| How would you feel if there was more of…? | |||||
| Dysfunctional | |||||
| How would you feel if the product did not have…? | |||||
| How would you feel if there was less of…? |
Next, you can determine each category based on the combination of questionnaire answers:
| Functional | Dysfunctional | Category |
| I expect it | I dislike it | Basic |
| I like it | I dislike it | Performance |
| I like it | I am neutral | Delighter |
| I am neutral | I am neutral | Indifferent |
| I dislike it | I expect it | Reverse |
| I am neutral | I dislike it | Basic |
| I can tolerate it | I dislike it | Basic |
| I like it | I expect it | Delighter |
| I like it | I can tolerate it | Delighter |
After that, responses will be collated and a category will be defined for each response, as demonstrated above. You can then conclude each feature’s category by seeing which category name was assigned the most frequently for each one based on the respondents’ answers. This analysis can help you understand customers’ reactions to a potential feature and hence determine if it’s worth spending valuable time and resources on it.
Here is a Google Sheet template with an example. You can utilize Kano model analysis for a list of potential features for your product.
The Kano model can help product teams prioritize features and create products with higher customer satisfaction. Let’s go over some of the key benefits of the Kano model.
Instead of brainstorming over market research and available product usage data to identify the most desirable features, the Kano model is an easier approach that can save time and resources.
Conducting a survey for target customers and asking them directly about their preferences for a list of features is highly efficient.
The Kano model helps product teams identify innovative features that customers do not expect but are delighted to experience. Such features provide an edge to the product over its competition and help retain existing customers.
Product managers often struggle with prioritizing items on a list of potential features. The Kano model helps by proving their hypothesis about a feature and figuring out the most important ones worth investing in.
Excitement, performance, and basic features are placed on the product roadmap.
A minimum viable product is a basic version of the product. It has core features built with minimum resources in the shortest possible time. An MVP must have basic features categorized by the Kano model and function at the minimum expected level by the customer.
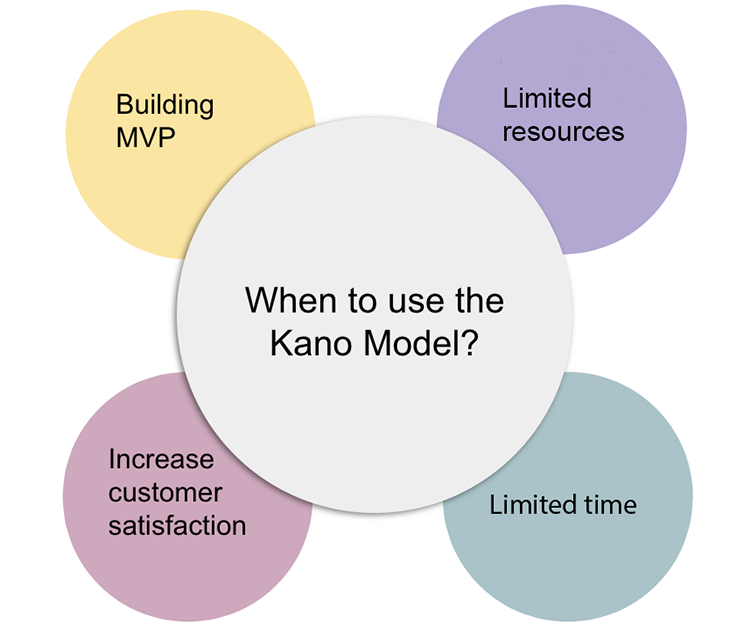
Any team developing a new product or enhancing an existing product can use the Kano model to prioritize features. This model is very useful in scenarios where teams have limited time and limited resources, or are building an MVP and trying to figure out core features.
This model guides the team to identify must-have features, performance, and delighter features that can bring customer satisfaction and make the product desirable.
On the other hand, if product teams already have available customer data from product usage that clearly indicates the need for a feature, it may not make sense to use this model.
To make the most of the Kano model analysis, it is crucial to take appropriate steps and implement best practices. This will help the team to focus on the right set of features and analyze the output of the survey without making too much chaos.
Let’s understand a few points about best practices when using the Kano model.
First of all, the product team needs to write down all the potential sets of features. Then, based on the team’s assumptions and market research, the features need to be analyzed and shortlisted using the Kano model.
It is also important to take input from key stakeholders while finalizing these features. It’s advisable to not include more than 20 features for analysis in the survey, as more than that can lead to a large number of questions. A long survey can demotivate the participants and hence cause survey attrition.
Consider a diverse sample size of your target customer segment. Not choosing the survey recipients carefully can lead to inconclusive survey results. Generally, a set of 15–20 participants is good enough for analyzing data using the Kano model. This will help in getting enough data that is still manageable.
It’s crucial to present the survey questions in an easily understandable way. Wherever possible, it is always a good practice to include images or gifs to depict the feature. This will help the recipients understand clearly and won’t leave any room for assumptions.
It’s good practice to have another set of eyes review the survey questions to make sure the questions are clear. These surveys can include open-ended questions to help teams understand customers’ preferences.
Based on the survey results, few customers can be called for in-person interviews to understand their views and feelings about a feature. This will help the team understand the customers’ sentiments for features and their points of view about the expected behavior of the product.
The Kano model helps product managers prioritize shortlisted features with more customer satisfaction and a higher retention rate. It can be used at any stage of the product — whether it’s a new product entering the market or an existing product hoping to increase customer satisfaction.
It’s crucial to implement best practices to avoid being overwhelmed by the analysis. Once the analysis is complete and the features are categorized and plotted, you can formulate a product strategy.
Collaborating with marketing teams to update marketing messages will also help in driving the product toward a product-market fit.
Featured image source: IconScout

LogRocket identifies friction points in the user experience so you can make informed decisions about product and design changes that must happen to hit your goals.
With LogRocket, you can understand the scope of the issues affecting your product and prioritize the changes that need to be made. LogRocket simplifies workflows by allowing Engineering, Product, UX, and Design teams to work from the same data as you, eliminating any confusion about what needs to be done.
Get your teams on the same page — try LogRocket today.

A product manager’s guide to deciding when automation is enough, when AI adds value, and how to make the tradeoffs intentionally.

How AI reshaped product management in 2025 and what PMs must rethink in 2026 to stay effective in a rapidly changing product landscape.

Deepika Manglani, VP of Product at the LA Times, talks about how she’s bringing the 140-year-old institution into the future.

Burnout often starts with good intentions. How product managers can stop being the bottleneck and lead with focus.