When it comes to usability testing, numbers tell the story — but interpreting those numbers correctly can mean the difference between a solid product decision and a costly mistake.

Part of avoiding these mistakes involves knowing how to use and tell the difference between usability concepts. Two of the most misunderstood ones include margin of error and confidence intervals.
While they might sound like complex statistical jargon, the concepts behind them are simple and essential to understand if you’re conducting usability testing or any type of survey.
To help get you started, this post breaks them down and explores how they work in practice.
Imagine you’re in the vehicle leasing business and want to find out what percentage of Amsterdam residents have leased a car in the past two years.
Would you survey every single resident in the city? Probably not.
Instead, you’d take a sample — a smaller, randomly selected group of people that represents the population as a whole.
When it comes to usability testing or surveys, you rely on samples in the same way. A small group of participants stands in for the entire target audience.
But here’s the catch: because you’re only working with a portion of the population, your results can never be 100 percent accurate.
They’re always an estimate of the true value, with some degree of uncertainty — known as the margin of error.
You don’t need to be a math expert to understand the margin of error. But having a basic grasp of the concept can help you improve the reliability of your results and make better decisions.
To understand the margin of error, you need to know three key terms: confidence level, margin of error, and confidence interval:
Your confidence level represents how certain you are that your results reflect the true value of your target group.
It’s a value you select — not something calculated by your data — and it reflects your tolerance for uncertainty.
There a few common confidence levels used:
Your margin of error (or margin error) is a calculated value that shows how much your sample results might differ from the true population value. It reflects the potential uncertainty in your data.
Unlike the confidence level (which you choose), the margin of error is derived from your data and depends on factors like the sample size, variability in the data, and your chosen confidence level.
Key points:
The margin of error is expressed as a percentage. If the results of your testing are 60 percent with a margin of error of 3 percent, it means the true value is likely within ±3 percent of your result (between 57 percent and 63 percent).
Once you have the margin of error, you can calculate the confidence interval — the range within which the true value is expected to fall.
The confidence interval is calculated by adding and subtracting the margin of error from your result. It’s expressed as:
[X – margin of error and X + margin of error]
If your result is 60 percent with a margin of error of 3 percent, the confidence interval would be between 57 percent and 63 percent.
Now, to see how the confidence level, margin of error, and confidence interval work together, read through the following scenarios.
How to interpret this:
With 90 percent confidence, you can say that the true percentage of people in the overall population who leased a vehicle is between 57 and 63 percent.
This means that if you repeated the survey 100 times, the results would fall within this range 90 times out of 100.
How to interpret this:
With 95 percent confidence, you can say the true percentage of users who would successfully complete the task is between 78 and 82 percent.
This means that if you conducted the usability test 100 times, the true result would fall within the range [78 – 82 percent] 95 times out of 100.
At this point, you might be thinking that you understand how the margin of error works in tandem with your confidence intervals but want to know more about how you actually calculate it:

The error margin is a function of three parameters:
If you choose a higher confidence level (e.g., 99 percent), the margin of error increases.
For example, assume your result is 60 percent, and at a 95 percent confidence level, the margin of error is ±2 percent. This means you can be 95 percent confident that the true value falls within the range [58 to 62 percent].
However, if you want to state the same result with 99 percent confidence, you’ll need a wider range to account for the additional certainty. This results in a higher margin of error, meaning the range might expand to something like [57 to 63 percent] to include the true value with greater confidence.
A larger sample size reduces the margin of error because it provides a more accurate representation of the target population. With more participants, the results are closer to what you’d get if the entire population were tested.
On the other hand, a very small sample size increases the margin of error, making the results less reliable.
The variability in your results, reflected by the sample proportion p significantly influences the margin of error. The value p*(1−p) is largest when p is close to 50 percent and smaller when p is closer to 0 or 100 percent.
Results where p is close to 50 percent (e.g., 50 percent of users completing a task) result in a larger margin of error because the variability in the data is higher.
In contrast, results near the extremes (e.g., 90 or 10 percent) have lower variability, which reduces the margin of error.
How can you achieve high precision in your results and reduce the margin of error?
While some factors are outside your control, like the confidence level (determined by the context of your work) or the variability in your data (the sample proportion p), there are two key steps you can take to improve your results:
The margin of error formula assumes your data is unbiased.
What does that mean?
If you want to find out what percentage of Amsterdam residents have leased a car, it’s a bad idea to only survey people working at a car leasing company.
Why?
The data would be biased, as this group is much more likely to lease cars than the general population.
What should you do instead:
Without a representative sample, even a large sample size or high confidence level won’t give reliable results.
The second important factor is the sample size.
A larger sample size reduces the margin of error and narrows the confidence interval, making your results more reliable.
Let’s say you’re working with a population of 10,000 users, a confidence level of 95 percent, and a sample proportion of 80 percent. Here’s how the margin of error decreases as you increase the sample size:
| Sample size | Error margin |
| 100 | 7.8 percent |
| 200 | 5.5 percent |
| 500 | 3.4 percent |
| 1000 | 2.3 percent |
| 2000 | 1.5 percent |
But there’s a trade-off: larger samples require more resources, time, and costs.
Testing the entire population would provide perfectly accurate results, but it’s unrealistic and often unnecessary.
You need to balance resources and accuracy.
There isn’t a one-size-fits-all answer, but here are some tips to guide you:
When conducting usability testing, these practical tips can help you maximize reliability and make the most of your resources:
Understanding usability testing results requires grasping three key concepts: confidence level, margin of error, and confidence interval.
Here are some key takeaways:
Featured image source: IconScout
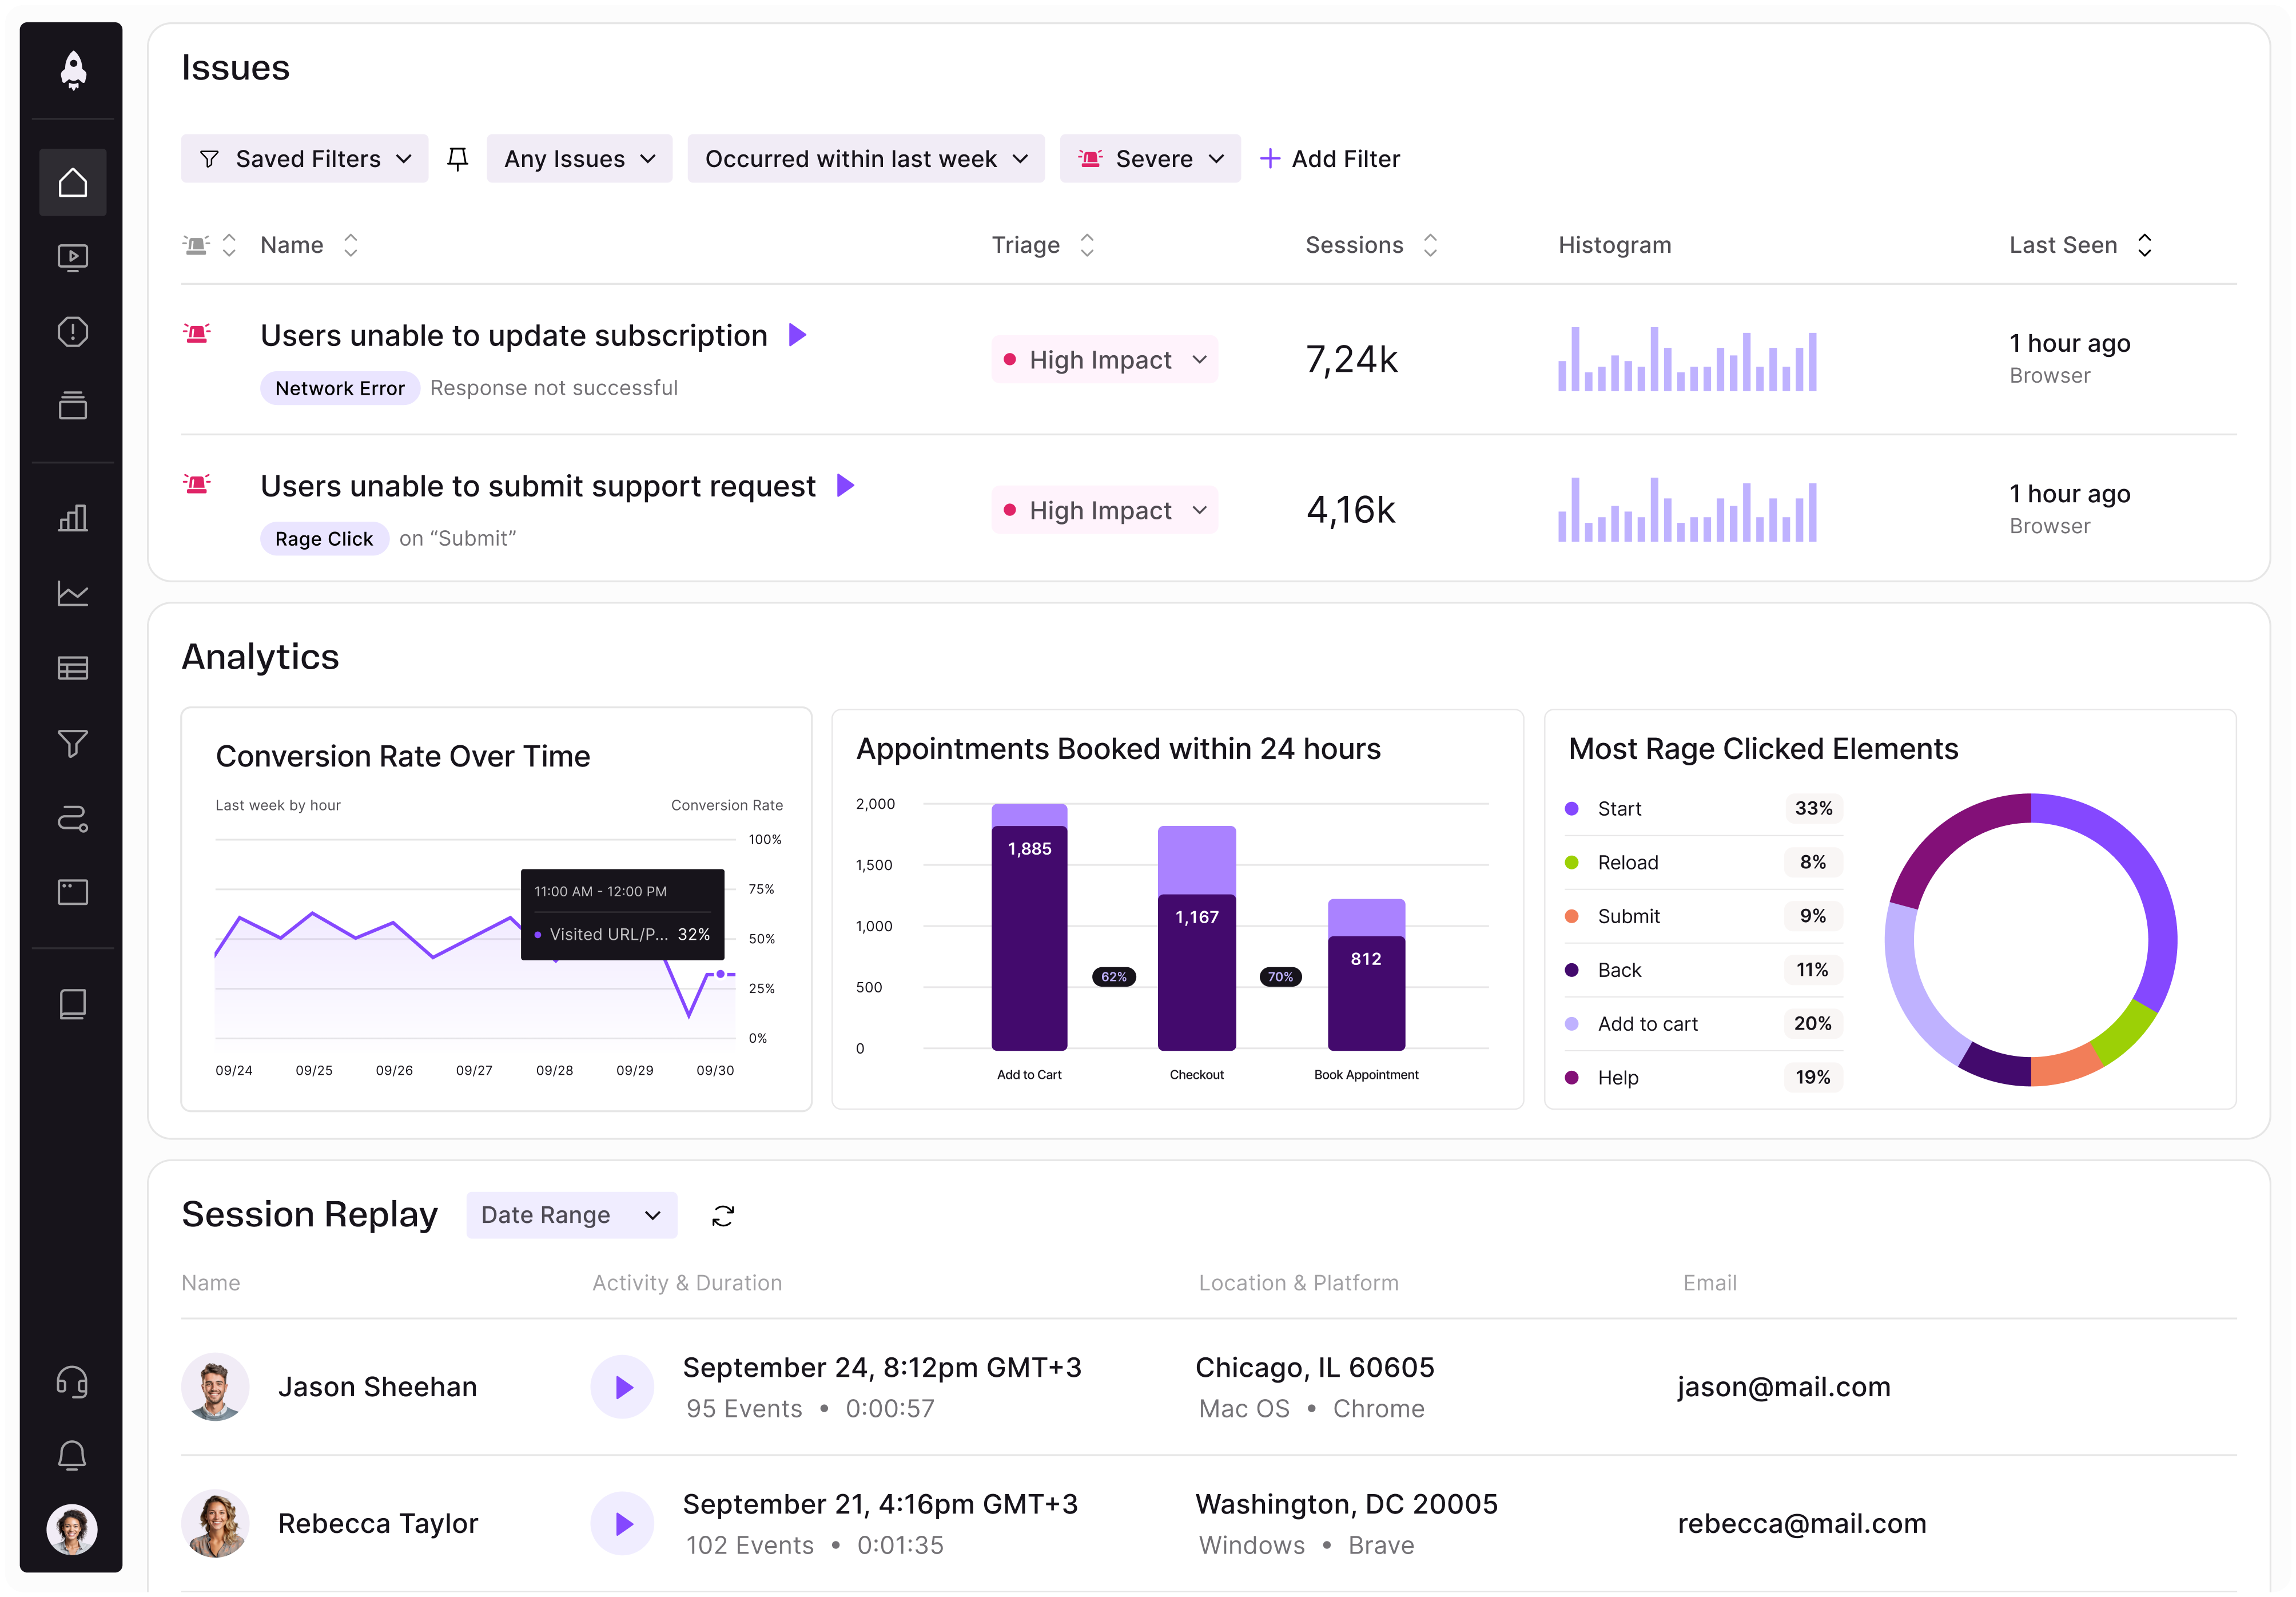
LogRocket identifies friction points in the user experience so you can make informed decisions about product and design changes that must happen to hit your goals.
With LogRocket, you can understand the scope of the issues affecting your product and prioritize the changes that need to be made. LogRocket simplifies workflows by allowing Engineering, Product, UX, and Design teams to work from the same data as you, eliminating any confusion about what needs to be done.
Get your teams on the same page — try LogRocket today.

Learn how product managers can use human-in-the-loop AI to manage decision risk, set oversight, and keep ownership and accountability human.

Learn how to choose and adapt product management frameworks based on your product stage, constraints, problem type, and business context.
Learn when streaks improve retention, when they create fragile engagement, and how PMs can design healthier systems around user progress.

A technical debt register brings transparency and clarity as to what type and how much debt you have and can be used to monitor and review your debt ratio.


