Editor’s Note: This article was updated on 22 June 2023 to include information about debugging Type-Script mobile apps, including React Native and NativeScript.
A software bug is a programming error or the unexpected behavior of a software program. Debugging refers to the process of inspecting and removing bugs in software systems. Programmers use various techniques for debugging; some developers write outputs to the terminal, while others use debugger tools to execute and monitor source code.
The Google Chrome web browser offers an inbuilt debugger with the well-known DevTools module for debugging JavaScript. Chrome DevTools implements support for source maps and can inspect both Node.js and Deno debugger instances. So, whether you use TypeScript in a client-side app (i.e., a TypeScript-based React app) or in a server-side app, you can use Chrome for debugging.
Chrome DevTools can also inspect Android WebViews. Almost all JavaScript-based cross-platform mobile app development frameworks implement DevTools protocol or offer an inbuilt web-based debugger UI, so debugging TypeScript-based mobile apps is also possible in Chrome.
In this tutorial, I will explain how to debug client-side, server-side, and mobile TypeScript code in Chrome. We’ll cover:
Web browsers have inbuilt support for JavaScript and WebAssembly , but not for TypeScript. So, how can you debug TypeScript in Chrome if it doesn’t natively execute TypeScript? Chrome and all standard web browsers support processing JavaScript source maps.
A JavaScript source map typically maps a particular form of a specific JavaScript source code to a JavaScript source code the browser executes. For example, it’s hard to debug a minified JavaScript file in the browser, but if you use a source map along with the minified version, you can easily debug the readable JavaScript file while executing its minified version. Similarly, you can debug a TypeScript file when you run its transpiled JavaScript version in Chrome.
The official TypeScript compiler, tsc, can generate source maps during the transpilation process, so now you can write TypeScript code, transpile to JavaScript along with a source map, and debug TypeScript code in the browser while executing the transpiled JavaScript code. This is how Chrome lets developers debug client-side TypeScript. Moreover, Chrome can debug client-side TypeScript code that runs on Android WebView/Chrome via the inbuilt remote debugging feature.
With server-side runtimes, like Node and Deno, you can run JavaScript/TypeScript and listen to Chrome DevTools debugger events via v8. This is how you can debug server-side TypeScript code in Chrome. Mobile frameworks that support TypeScript-based development, such as React Native and NativeScript, can also interconnect with the Chrome desktop app, so it’s also possible to debug TypeScript mobile apps on Chrome.
When you use frontend frameworks to build your apps, their TypeScript templates typically come with TypeScript compiler configurations already included and they automatically generate source maps for you. But in some scenarios, you’ll need to configure the TypeScript compiler, generate your own source maps, and manually link your transpiled TypeScript files using the HTML script tag.
This is a great way to learn how to debug TypeScript in Chrome because that manual configuration and setup helps you understand the TypeScript debugging internals. Let’s prepare a development environment to debug any client-side TypeScript file in Chrome.
First, create a new npm project in any directory you like, as follows:
npm init
# --- or ---
yarn init
Next, install the typescript package:
npm install typescript
# --- or ---
yarn install typescript
Now, generate the TypeScript compiler configuration file:
npx tsc --init
The default configuration won’t enable source map generation, so you’ll need to edit the auto-generated configuration file. Uncomment the following line in tsconfig.json to enable source map generation:
"sourceMap": true,
Add an npm script to generate JavaScript by modifying your package.json:
"scripts": {
  "build": "npx tsc"
},
Now, you can use either the npm run build or yarn build command to transpile TypeScript files. Let’s debug the following TypeScript code:
function sayHello(name: string): void {
    let message = `Hello ${name}!`;
    console.log(message);
    if(name == 'TypeScript') {
        console.log('.ts');
    }
    else if(name == 'JavaScript') {
        console.log('.js');
    }
}

sayHello('TypeScript');
sayHello('JavaScript');
Add the above code into main.ts. Next, use main.js in index.html:
<script src="./main.js"></script>
Generate main.js and main.js.map (our source map) with the following command:
npm run build
# --- or ---
yarn build
Serve the web content in http://localhost:3000:
npx serve
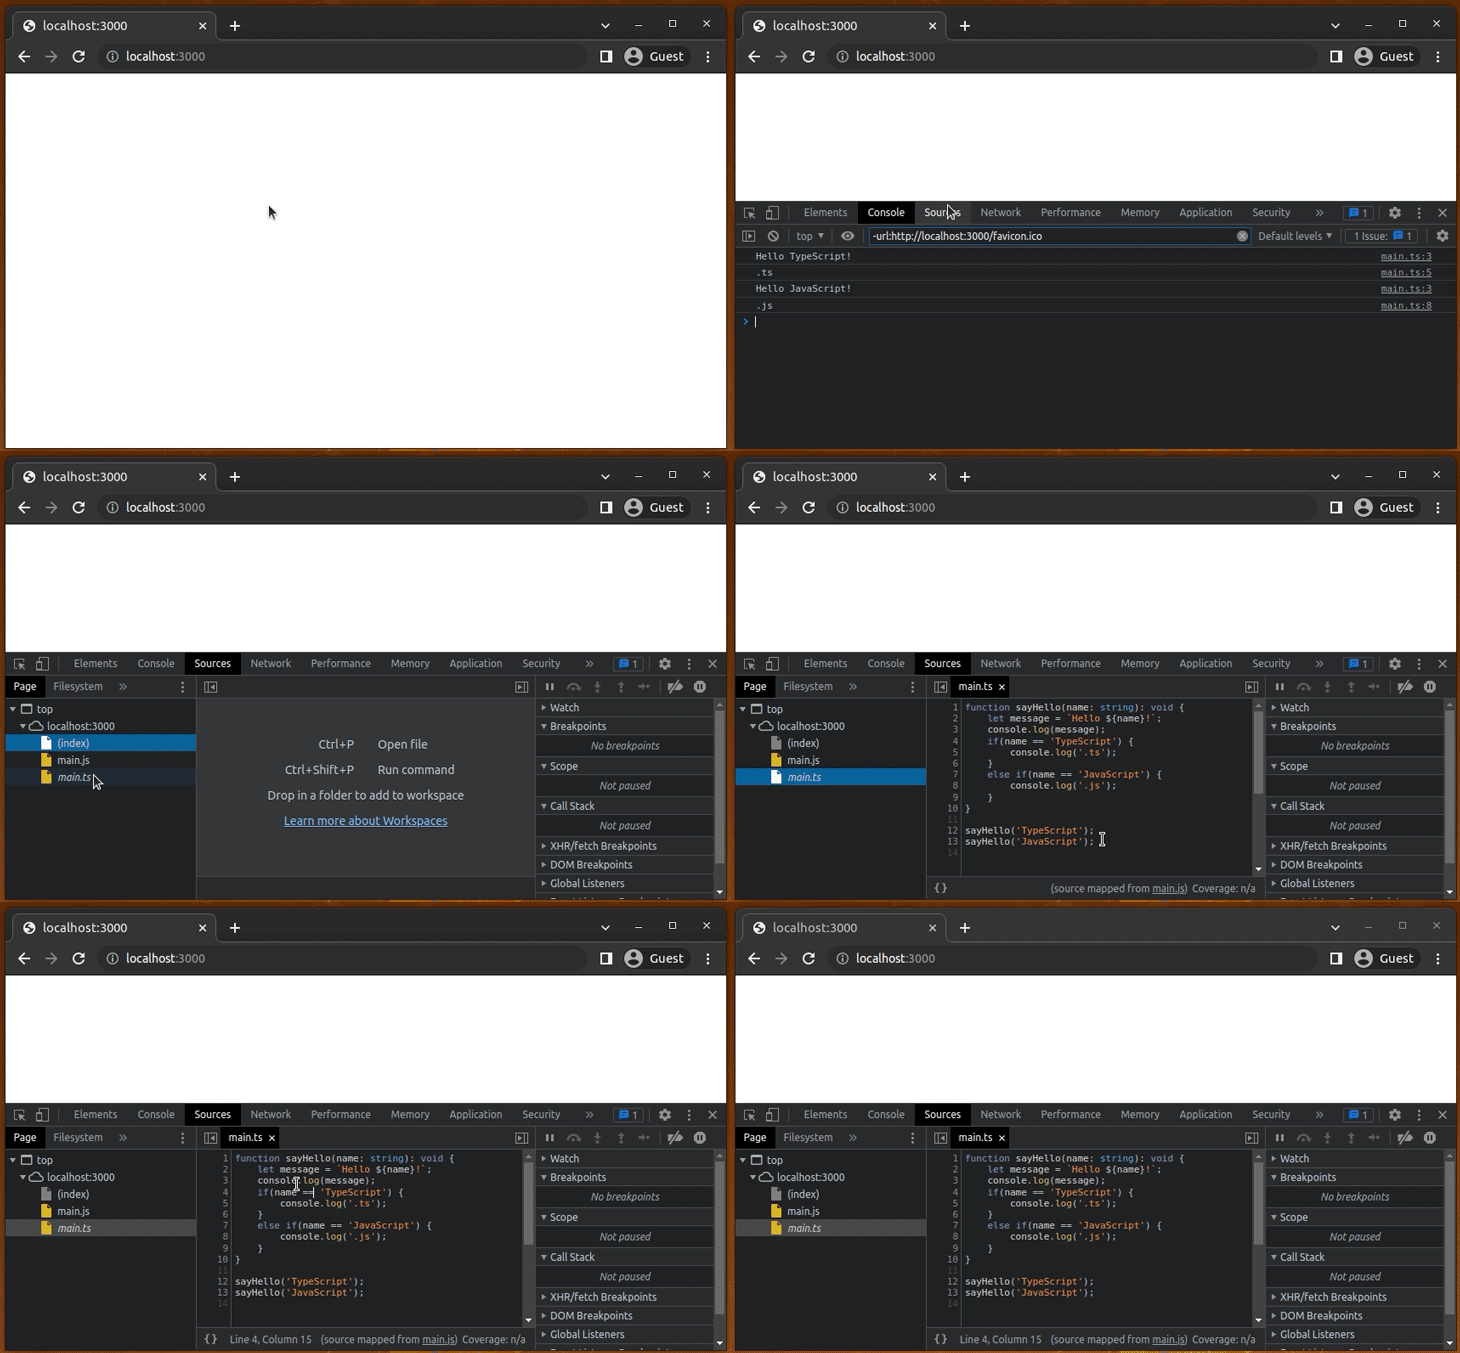
The above code starts a static server (Vercel’s serve) in port 3000. Open the URL in Chrome, open the DevTools, and click the Source tab. You’ll see main.ts as follows:
Try to add a breakpoint and reload the app. You can debug TypeScript just as you debug JavaScript in Chrome:
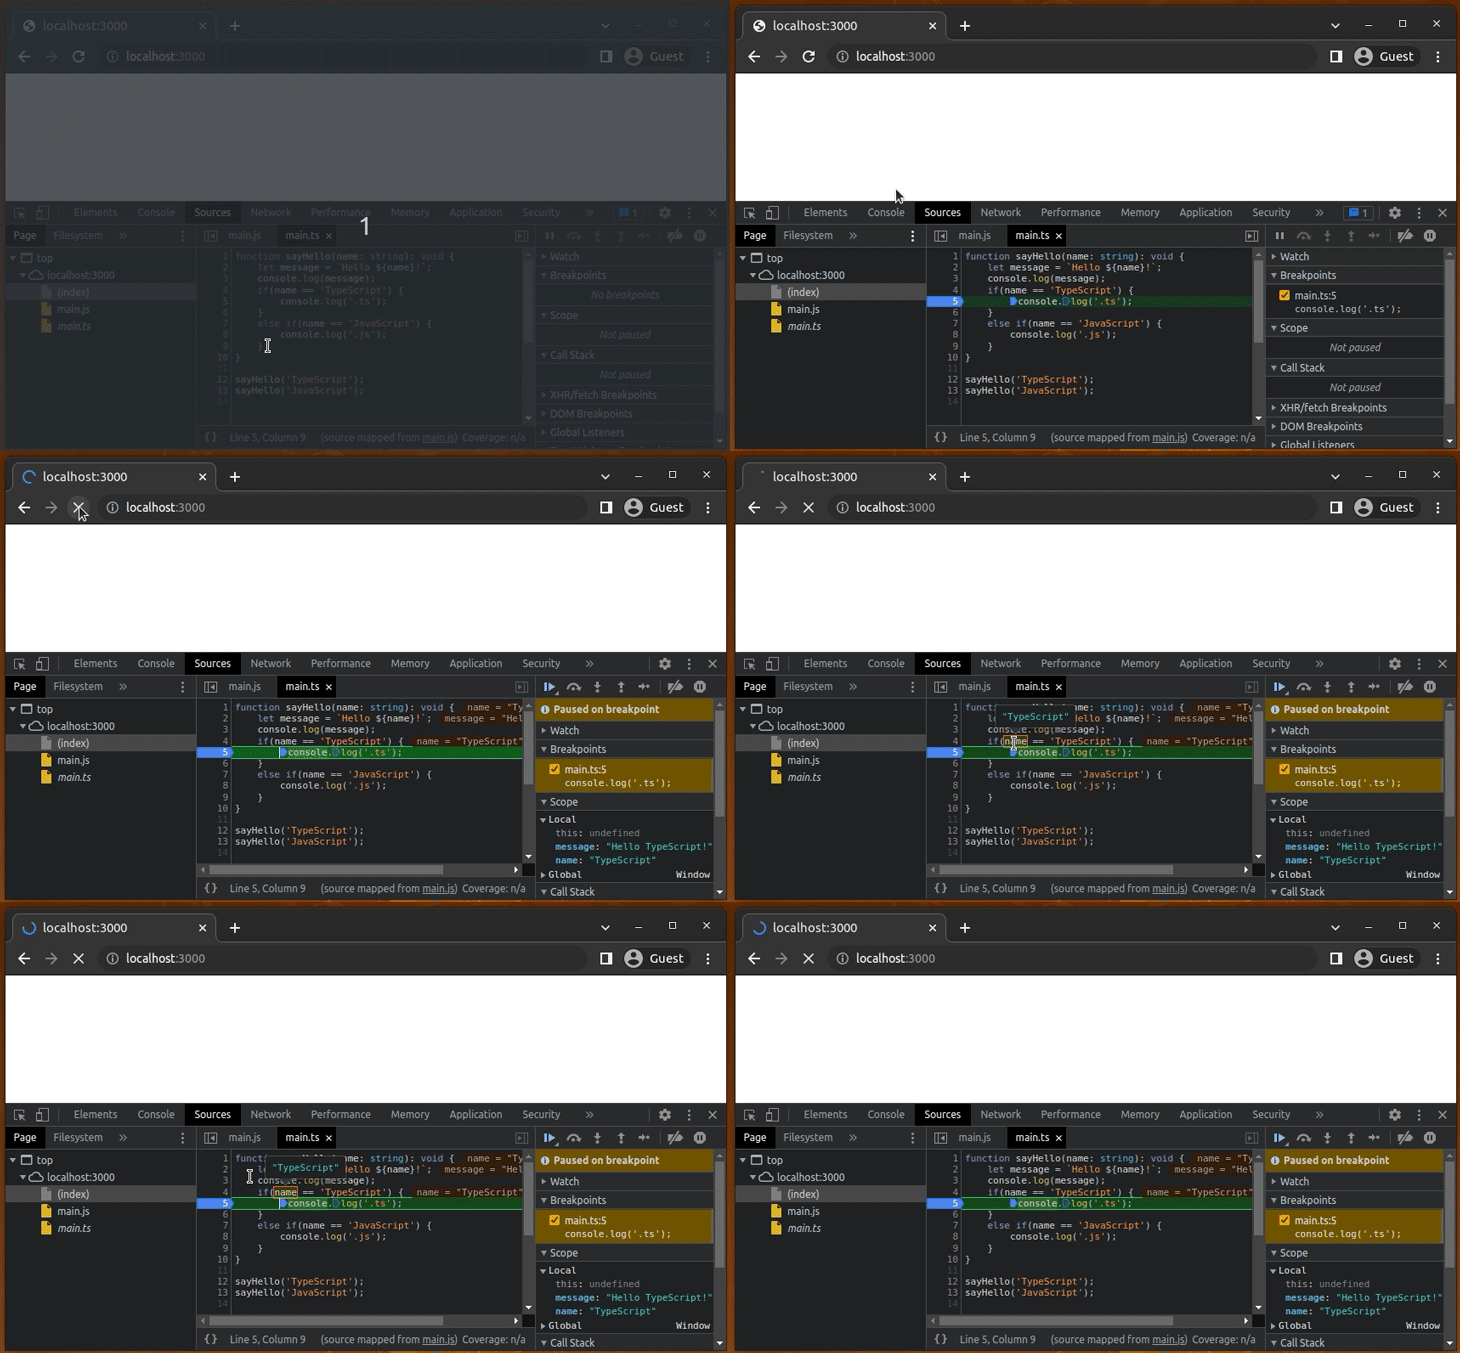
Chrome loads the source map automatically, since the TypeScript compiler appends the source map filename to main.js:
//# sourceMappingURL=main.js.map
The debugger keyword also works with TypeScript debugging. Add debugger after the console.log(message); statement and reload the app:
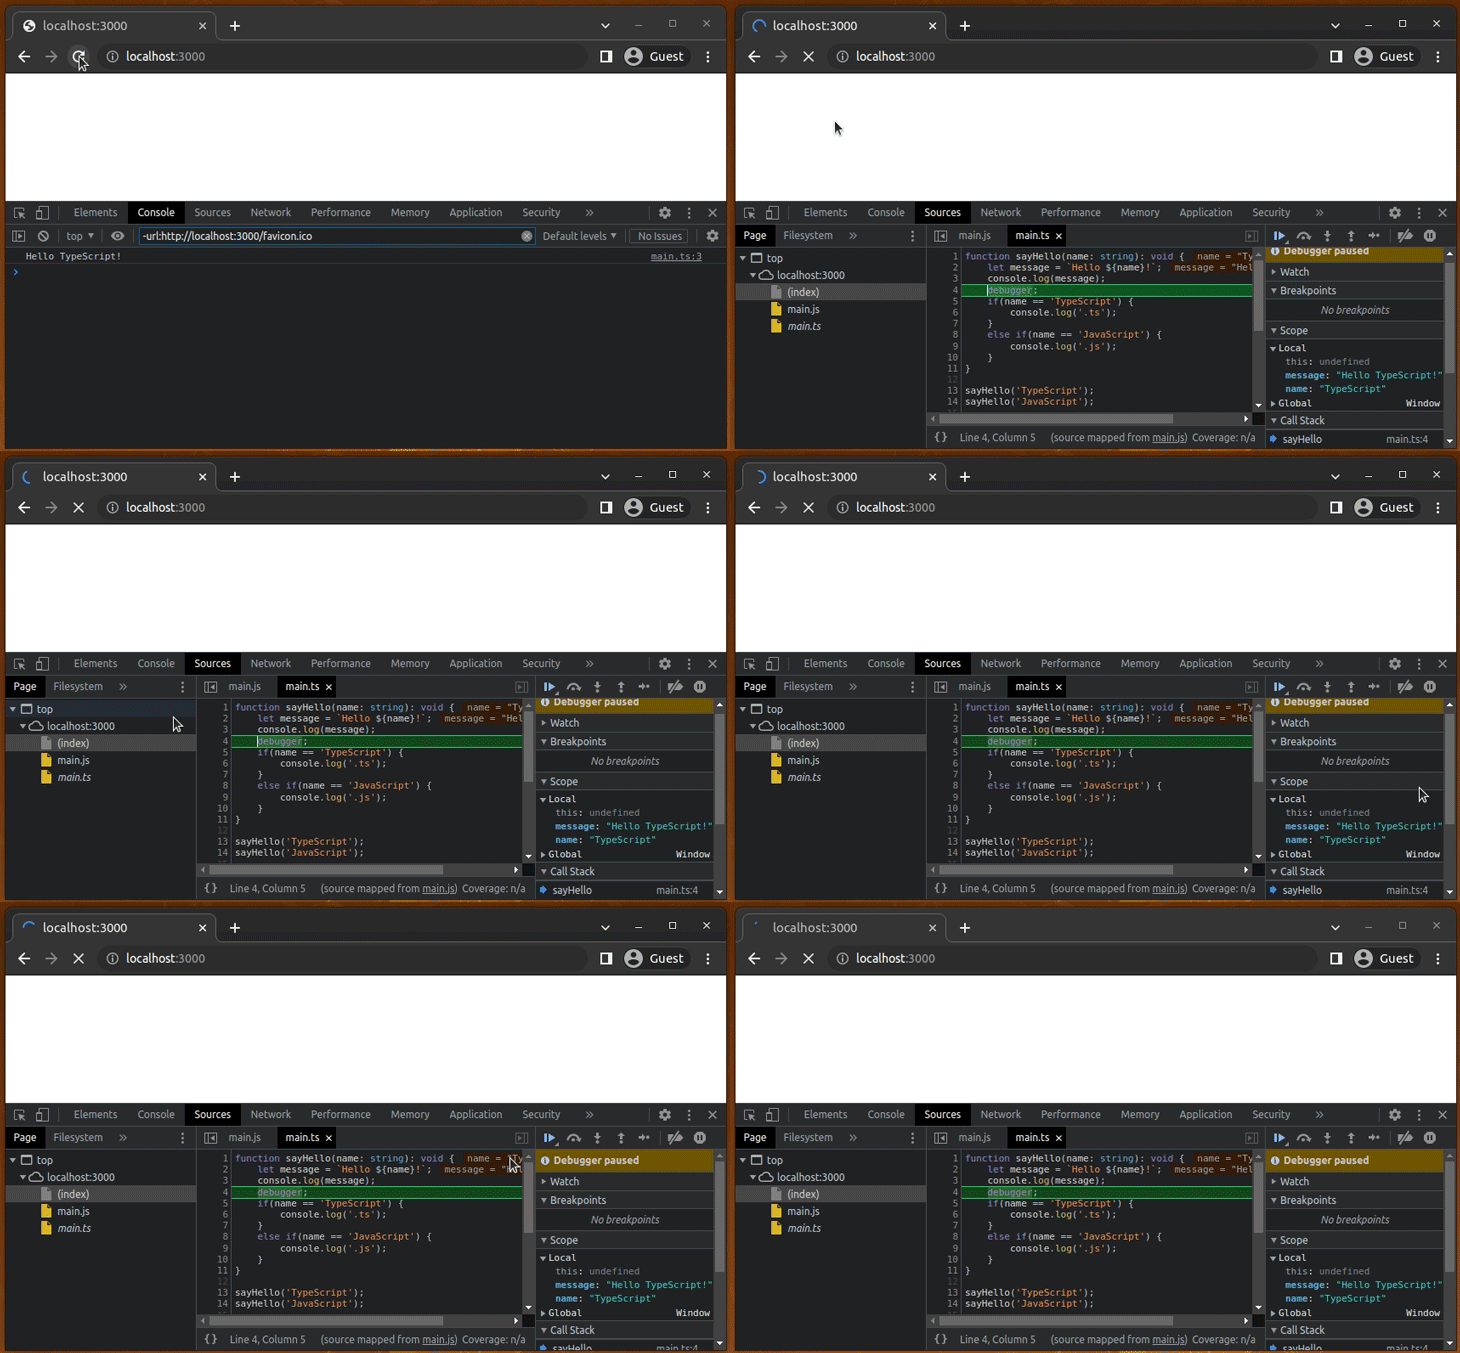
For experimentation, try removing the source map file (main.js.map) and debugging main.ts. The main.ts file will disappear from the source panel because TypeScript debugging works based on source maps.
With this approach, it’s possible to debug TypeScript code bundled with webpack, Rollup, or any other JavaScript bundler that supports TypeScript transpilation. You can enable debugging TypeScript in Chrome by adding an auto-generated source map to your web directory.
Earlier, we discussed how TypeScript debugging works in Chrome by using a manual configuration. But as we mentioned, almost all frontend frameworks/libraries offer pre-implemented TypeScript templates, which typically include compiler configurations to generate source maps. The result is that when you run your app in developer mode, TypeScript debugging is automatically enabled in Chrome.
Now, we’ll create a React app with Create React App’s official TypeScript template to learn how to debug TypeScript apps built with modern frontend frameworks. Run the following command to create a new TypeScript-React app:
npx create-react-app my-app --template typescript
#--- or ---
yarn create react-app my-app --template typescript
Now, add the following code to your App.tsx file:
import React, { useState } from 'react';
import './App.css';

function App(): JSX.Element {
  const [message, setMessage] = useState('');

  function generateMessage(name: string): string {
    let message: string = `Hello ${name}!`;
    return message;
  }

  function handleClick(): void {
    setMessage(generateMessage('TypeScript'));
  }

  return (
    <div>
      <div>{message}</div>
      <button onClick={handleClick}>Say hello</button>
    </div>
  );
}

export default App;
The above code renders a greeting message when we click the Say hello button. Run the project with the following commands to start debugging TypeScript:
npm start
# --- or ---
yarn start
Now, assume that you need to set up a breakpoint for line 8 of App.tsx. Since there are multiple source files, you can easily navigate to App.tsx by pressing Control+P:
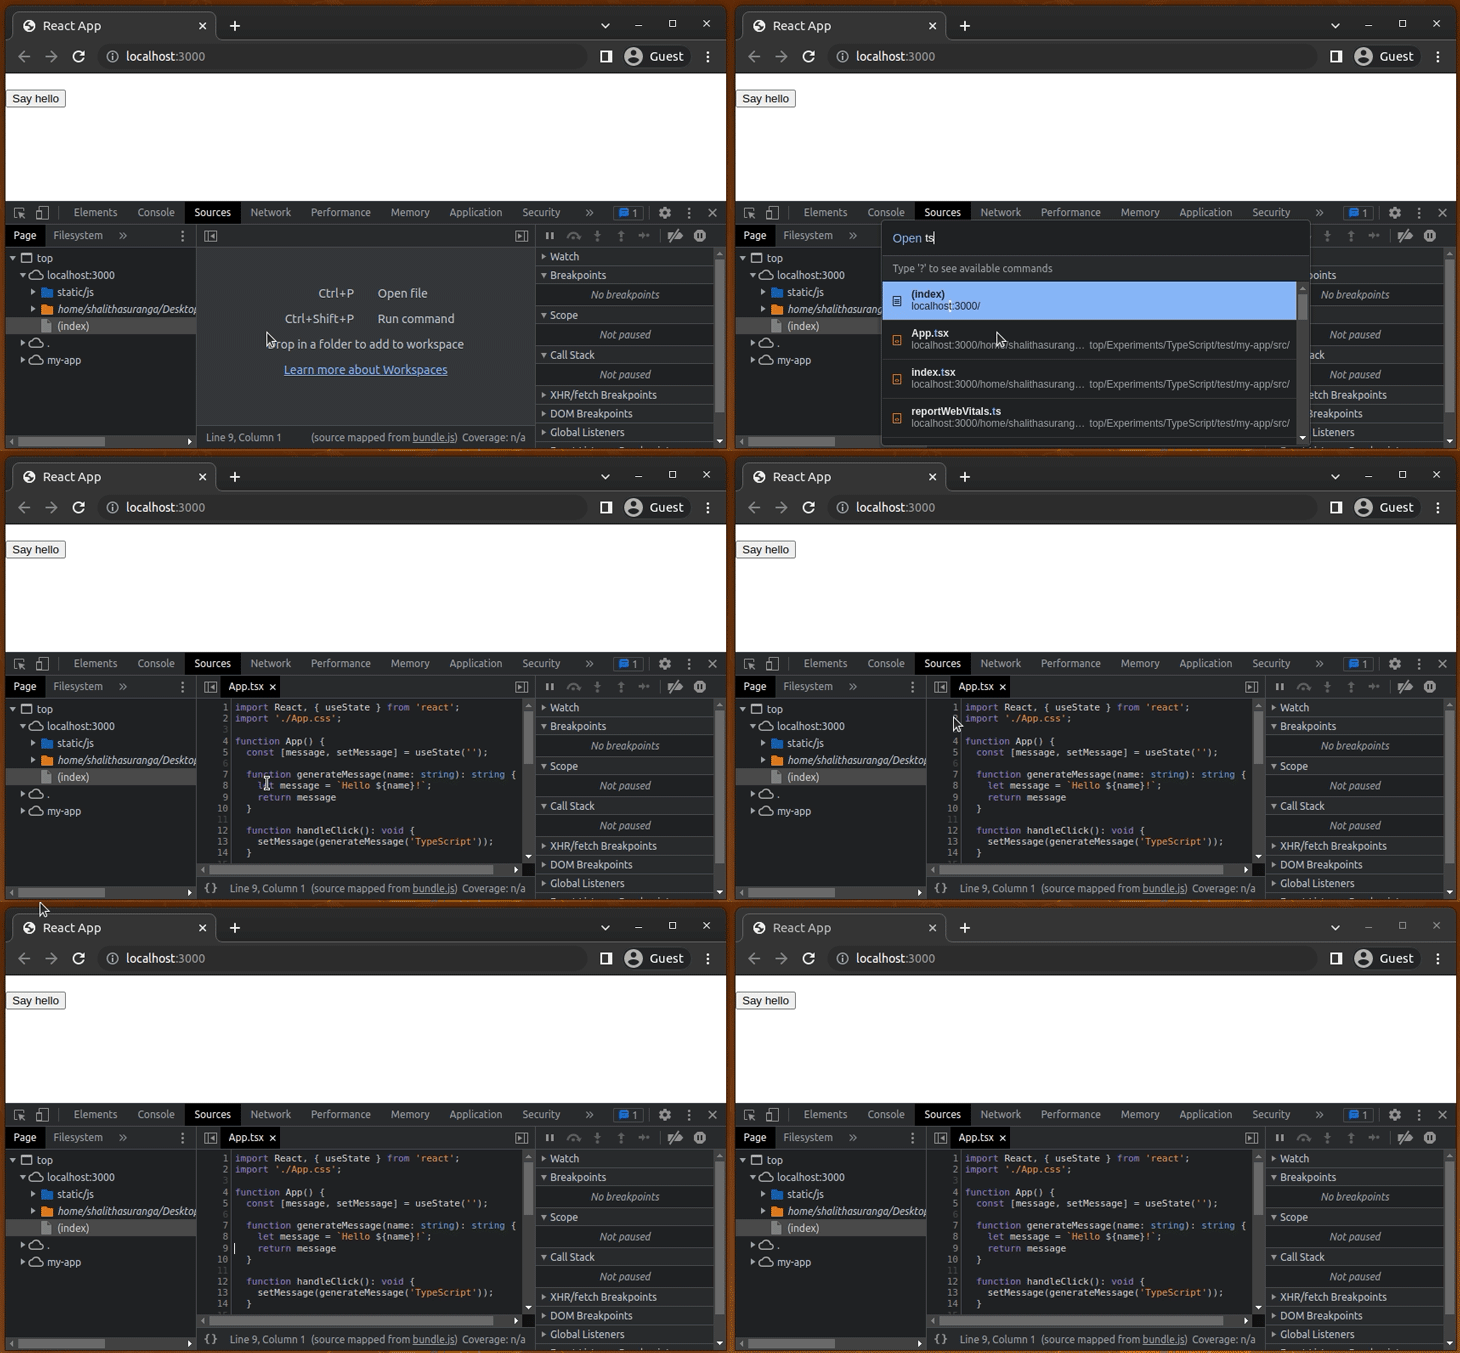
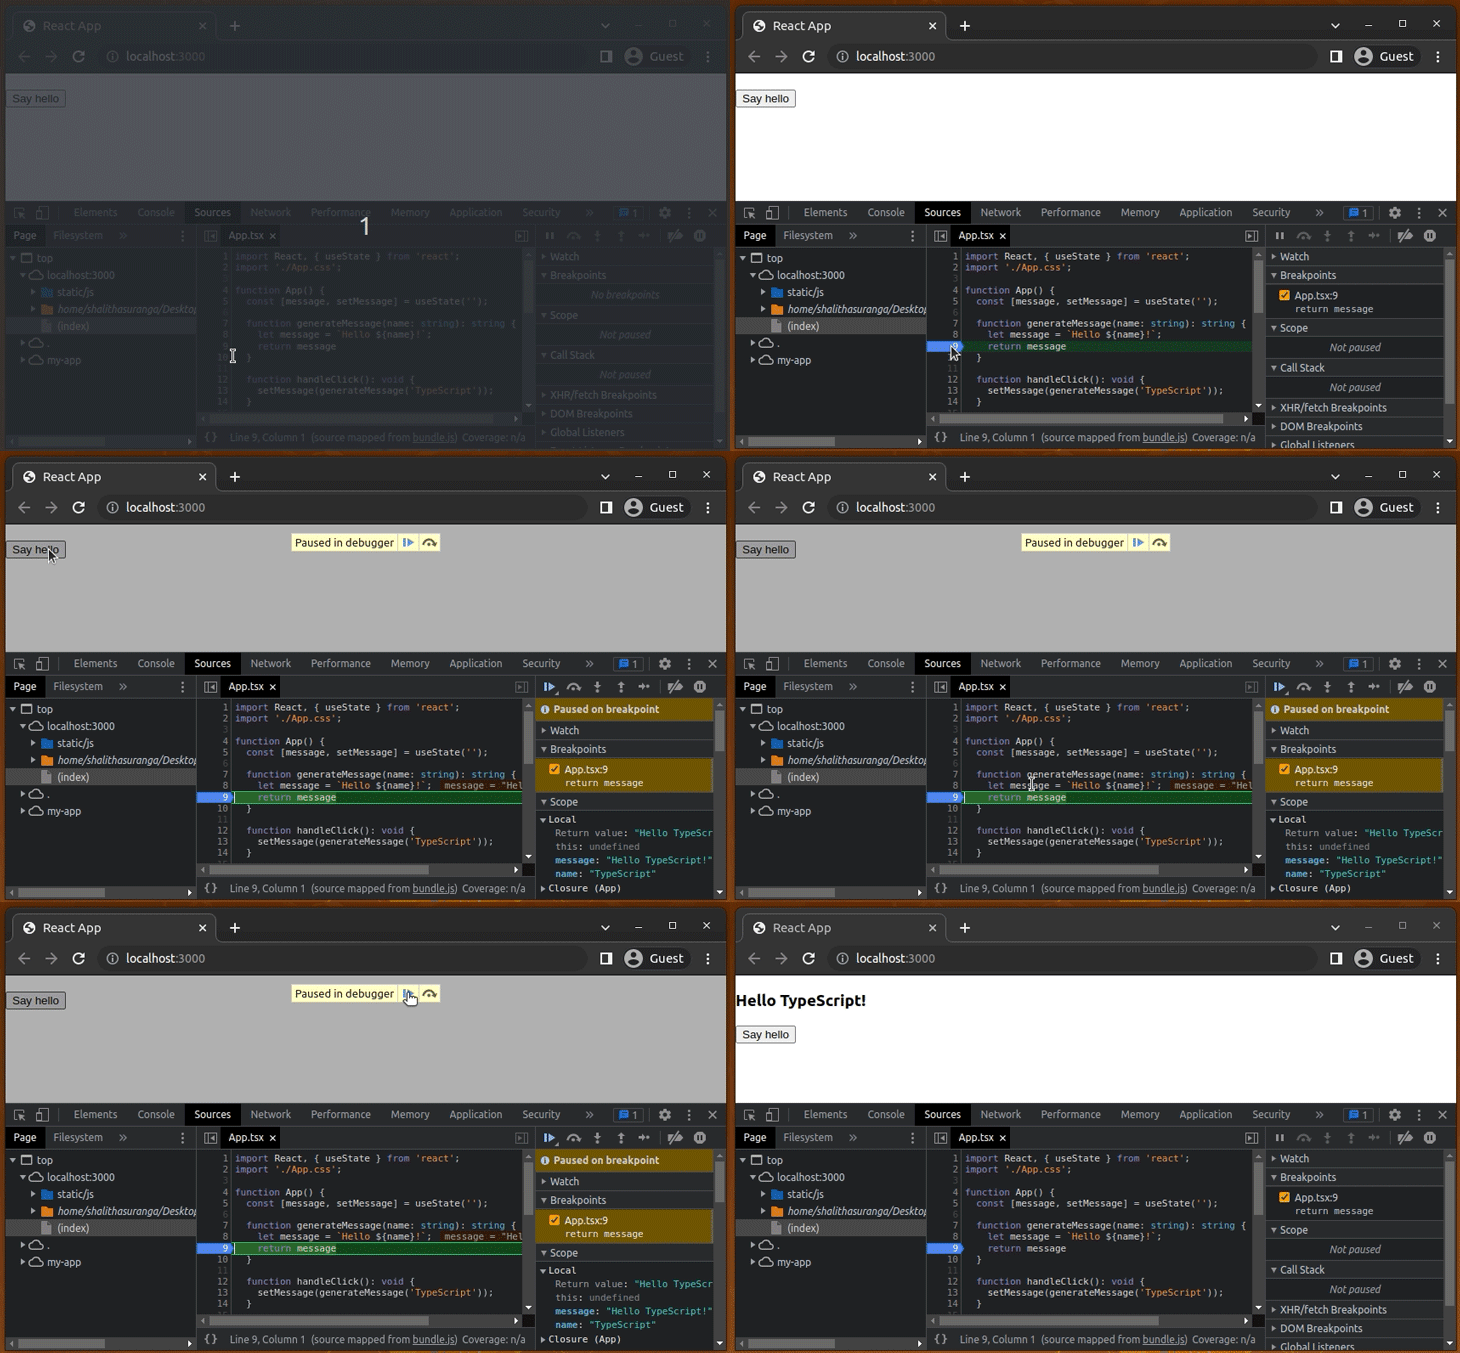
Now, set up the breakpoint and click the button. The DevTools debugger works as expected for TypeScript:
Try to use the Call stack section to monitor TypeScript function calls:
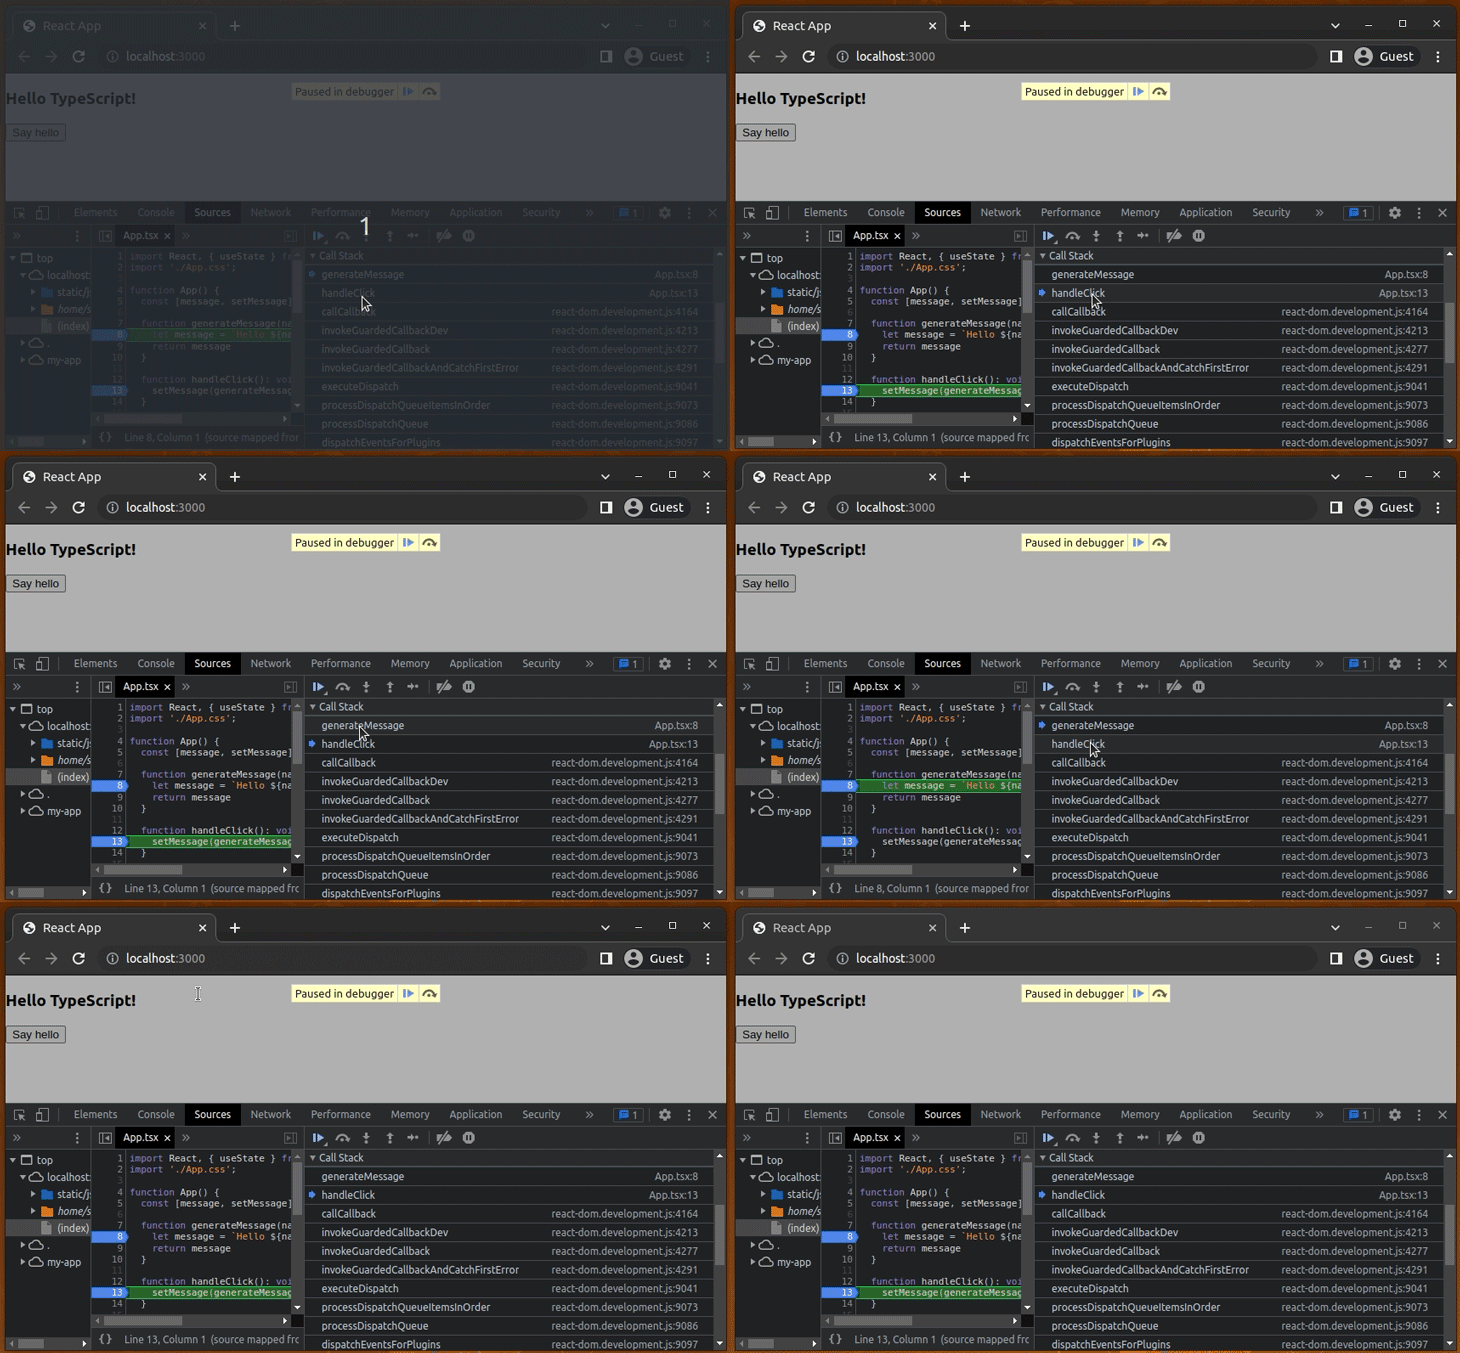
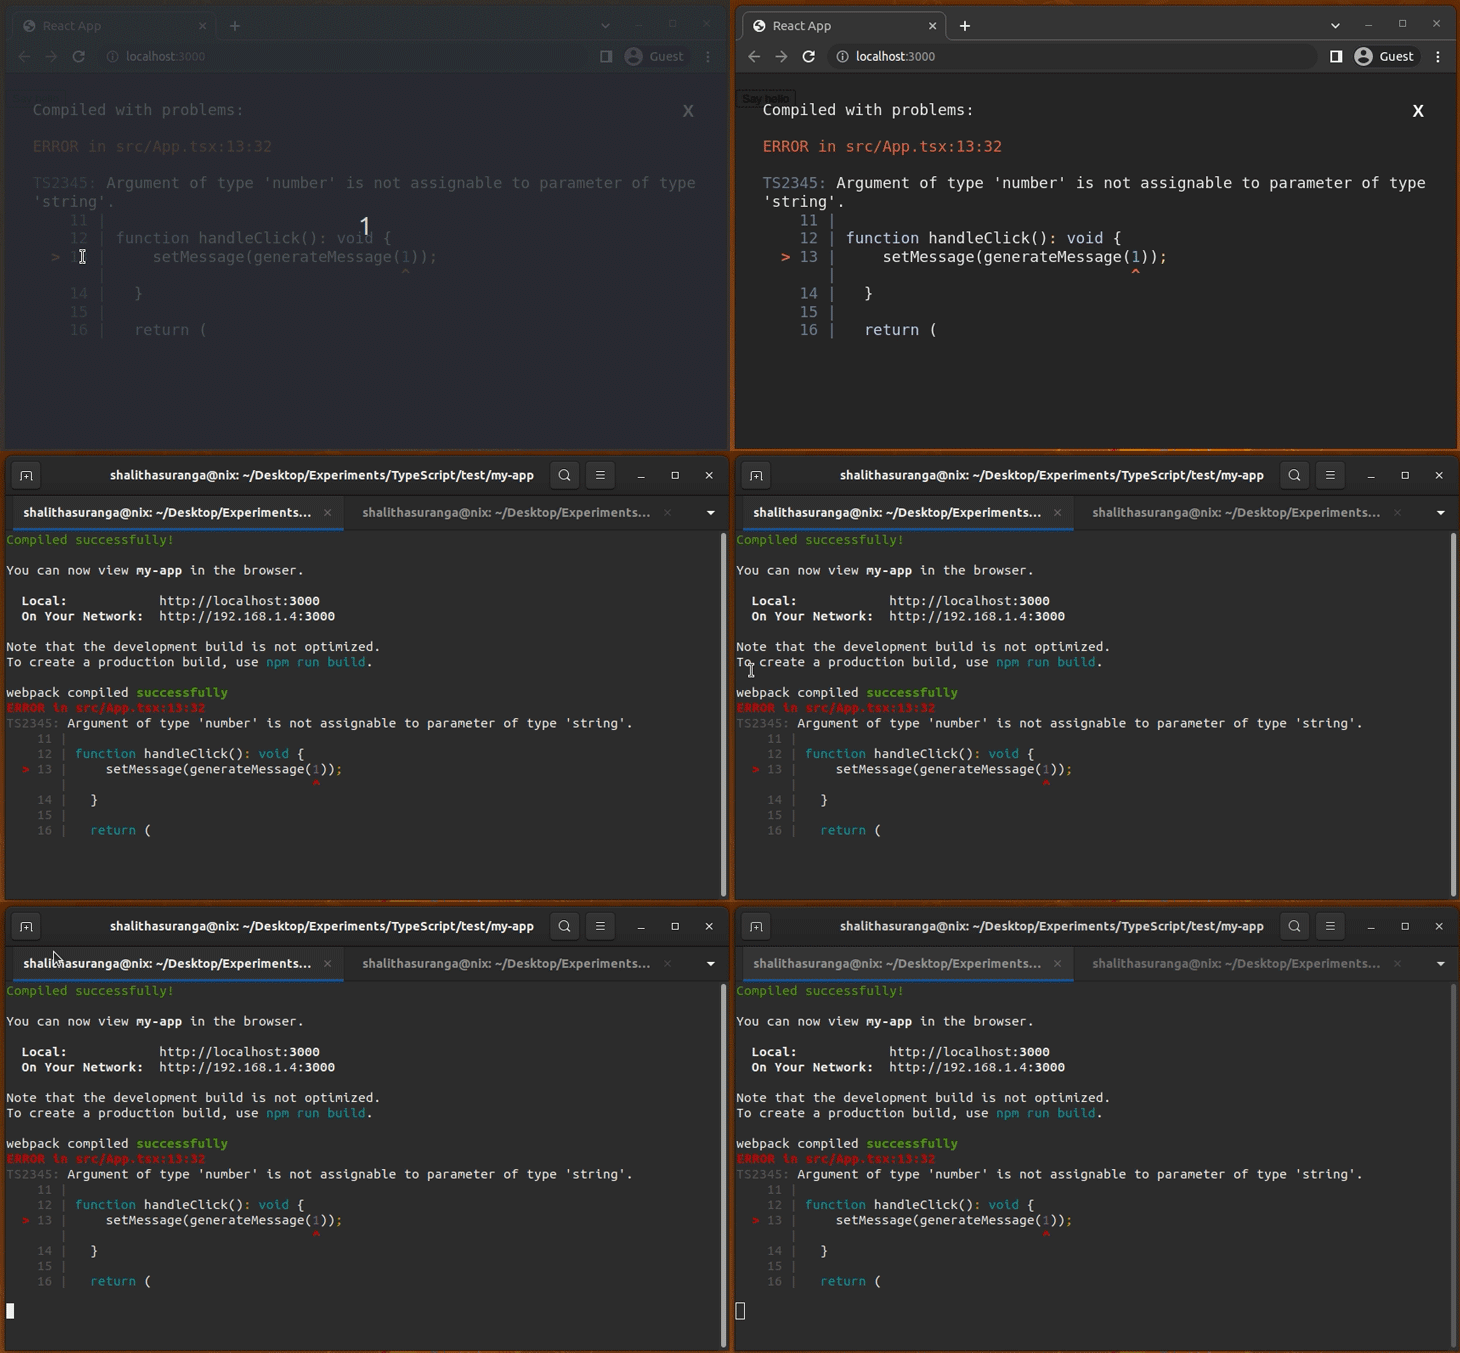
Every debugger feature works for TypeScript debugging because of source maps. The React scripts module does real-time TypeScript compilation, so you can fix TypeScript programming errors by checking Chrome or your terminal.
Let’s send an integer to the generateMessage function just for experimental purposes:
function handleClick(): void {
  setMessage(generateMessage(1));
}
Now, you will see TypeScript compilation errors on Chrome and the terminal:
All popular frontend frameworks, such as Angular, Vue, Svelte, etc., offer TypeScript development support and generate JavaScript source maps automatically. So, debugging TypeScript becomes really easy when using frontend framework tooling.
If you use VS Code to write code, you can use the editor UI as the debugger interface instead of Chrome DevTools. VS Code offers inbuilt support for debugging JavaScript/TypeScript via the pre-installed JavaScript debugger extension.
Start your web development server (i.e., webpack development server) and launch Chrome with the following launch.json setup:
{
    "version": "0.2.0",
    "configurations": [
        {
            "type": "chrome",
            "name": "Chrome",
            "request": "launch",
            "url": "http://localhost:3000"
        }
    ]
}
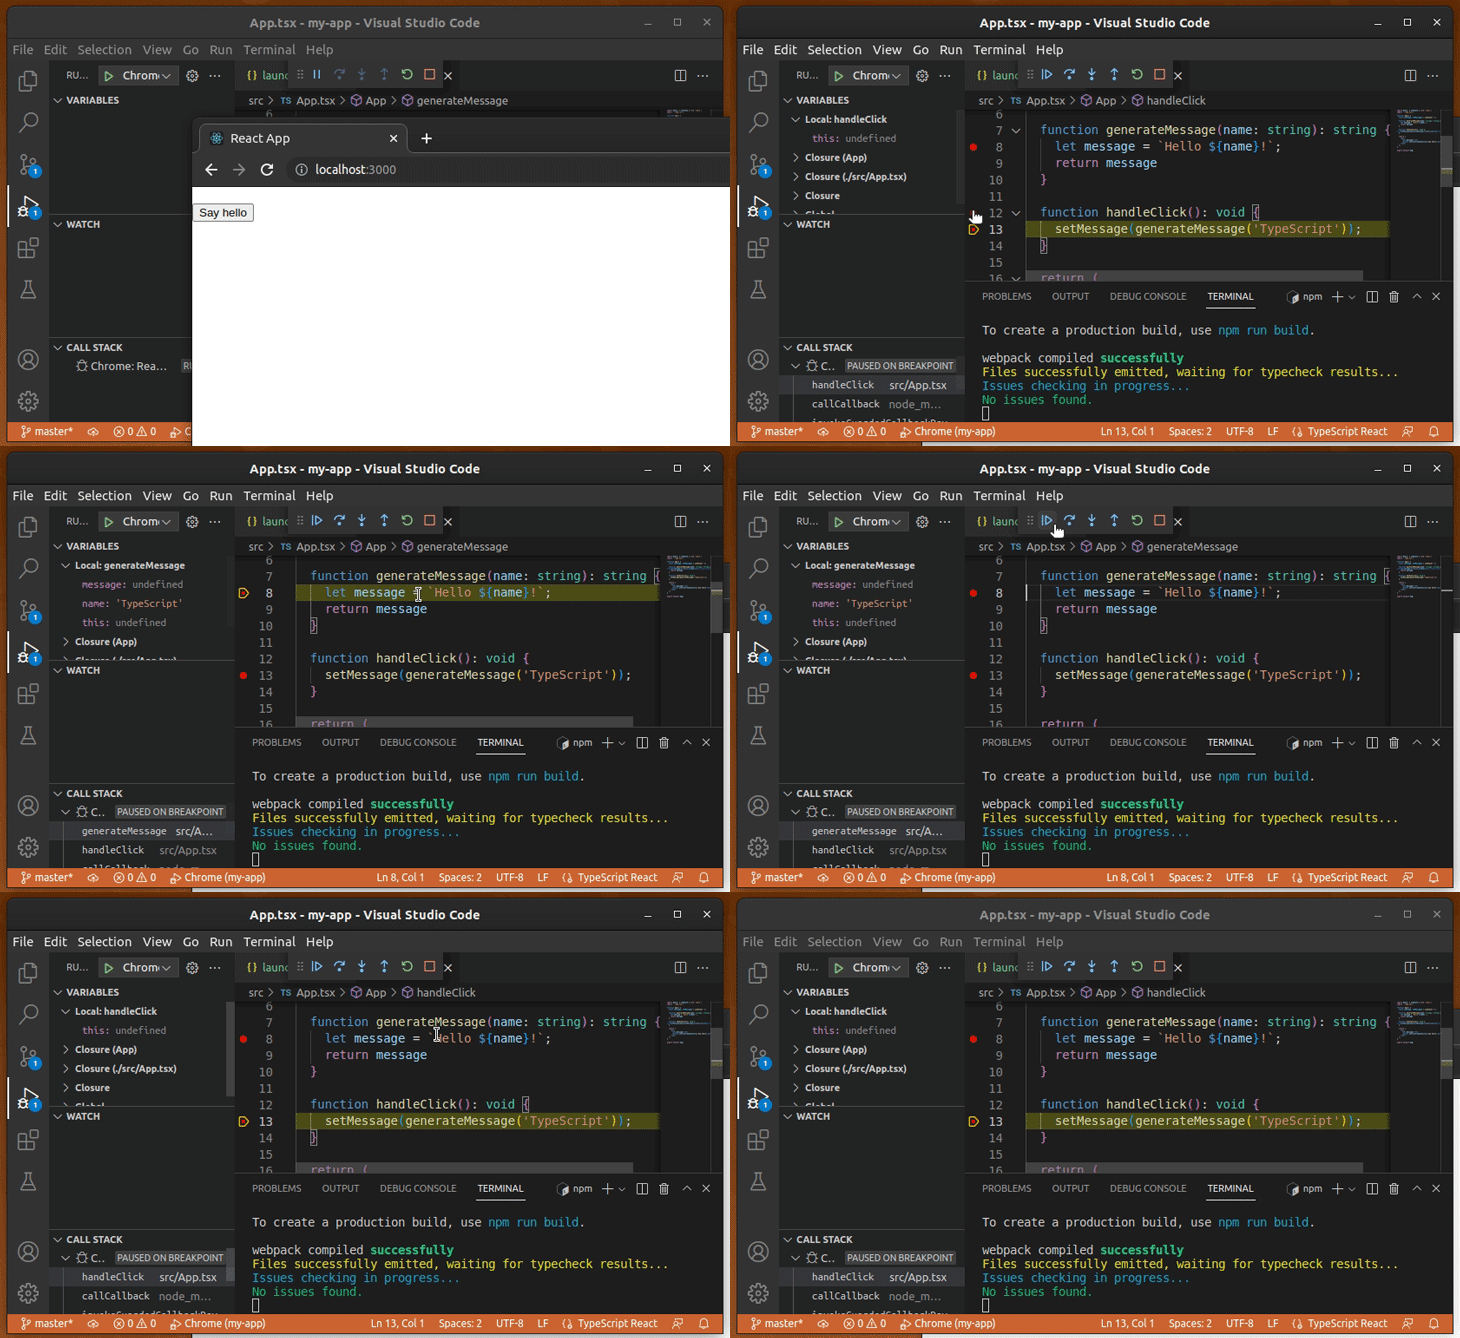
When you press F5 and start debugging, you can set up breakpoints from the editor. Here’s an example showing how you can debug the App.tsx file:
You can use TypeScript to write your Node.js and Deno backend projects. Let’s discuss how to use Chrome to debug them.
As with client-side TypeScript development, we’ll have to transpile TypeScript into JavaScript before executing the project with the Node.js runtime. Client-side JavaScript execution uses Chrome’s inbuilt v8 JavaScript engine, so we could directly use the DevTools debugger as we did before, but the Node.js runtime uses its own v8 instance, so it offers an inbuilt debugger tool as it can’t use Chrome’s debugger/JavaScript execution environment directly.
Create a new npm project and a TypeScript configuration file (with source maps enabled) using the same steps we followed in client-side debugging. Next, add the following code to main.ts:
function sayHello(name: string): void {
    let message: string = `Hello ${name}!`;
    console.log(message);
    if(name == 'TypeScript') {
        console.log('.ts');
    }
    else if(name == 'JavaScript') {
        console.log('.js');
    }
}

sayHello('TypeScript');
sayHello('JavaScript');
Add the following scripts to your package.json file:
"scripts": {
  "build": "npx tsc",
  "debug": "node inspect main.js"
},
Generate the JavaScript file and source map:
npm run build
# --- or ---
yarn build
Now, start the Node.js debugger with the following command:
npm run debug
# --- or ---
yarn debug
The above npm script initializes the inbuilt Node.js debugger utility and starts listening to Chrome DevTools protocol messages via WebSockets. You can either use the inbuilt Node.js debugger utility via the command line or the GUI debugger via Chrome DevTools.
Once you run the above command, the debugger automatically sets a breakpoint to the first executable statement, as follows:
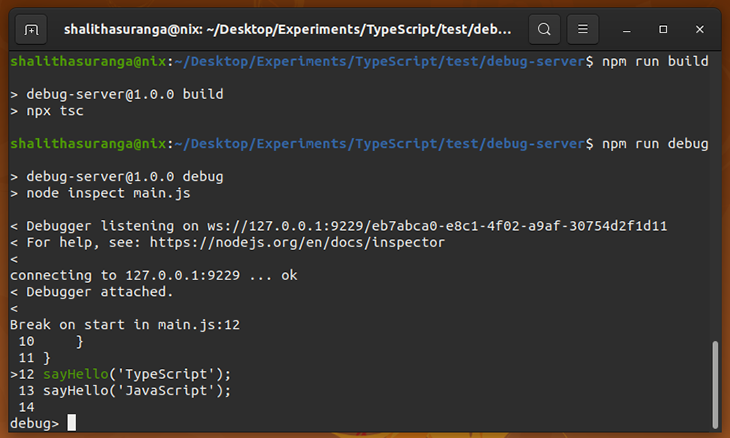
The inbuilt debugger doesn’t support TypeScript debugging because it doesn’t understand source maps — it is only a minimal debugger that comes with several commands. For example, you can use the following commands to set a breakpoint in line 5 and stop the code execution at the newly-added breakpoint:
sb(5)
c
You can check out all of the inbuilt debugger commands in the official documentation. We won’t discuss the inbuilt debugger further, since the Chrome debugger is the focus of this tutorial.
Let’s debug this TypeScript project in Chrome. Run the project with the debug npm script and go to the following URL on Chrome:
chrome://inspect
Now, open the DevTools debugger GUI as follows:
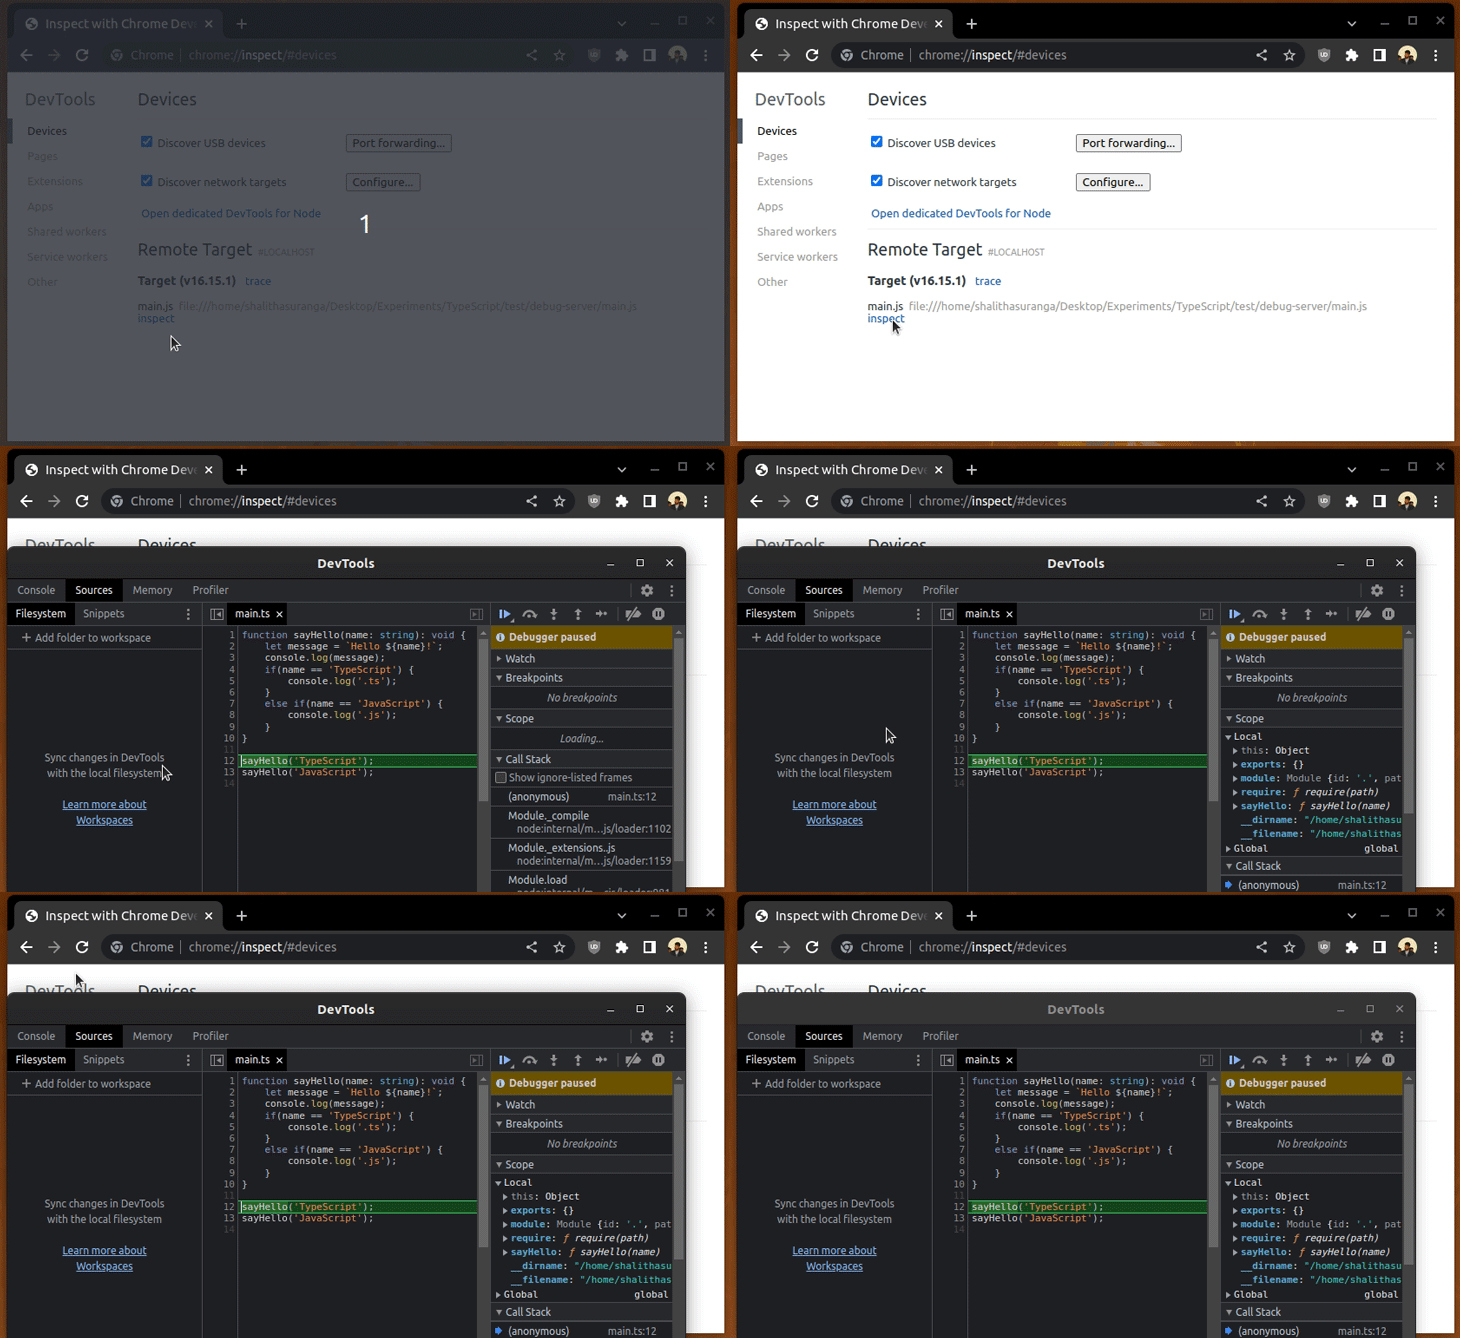
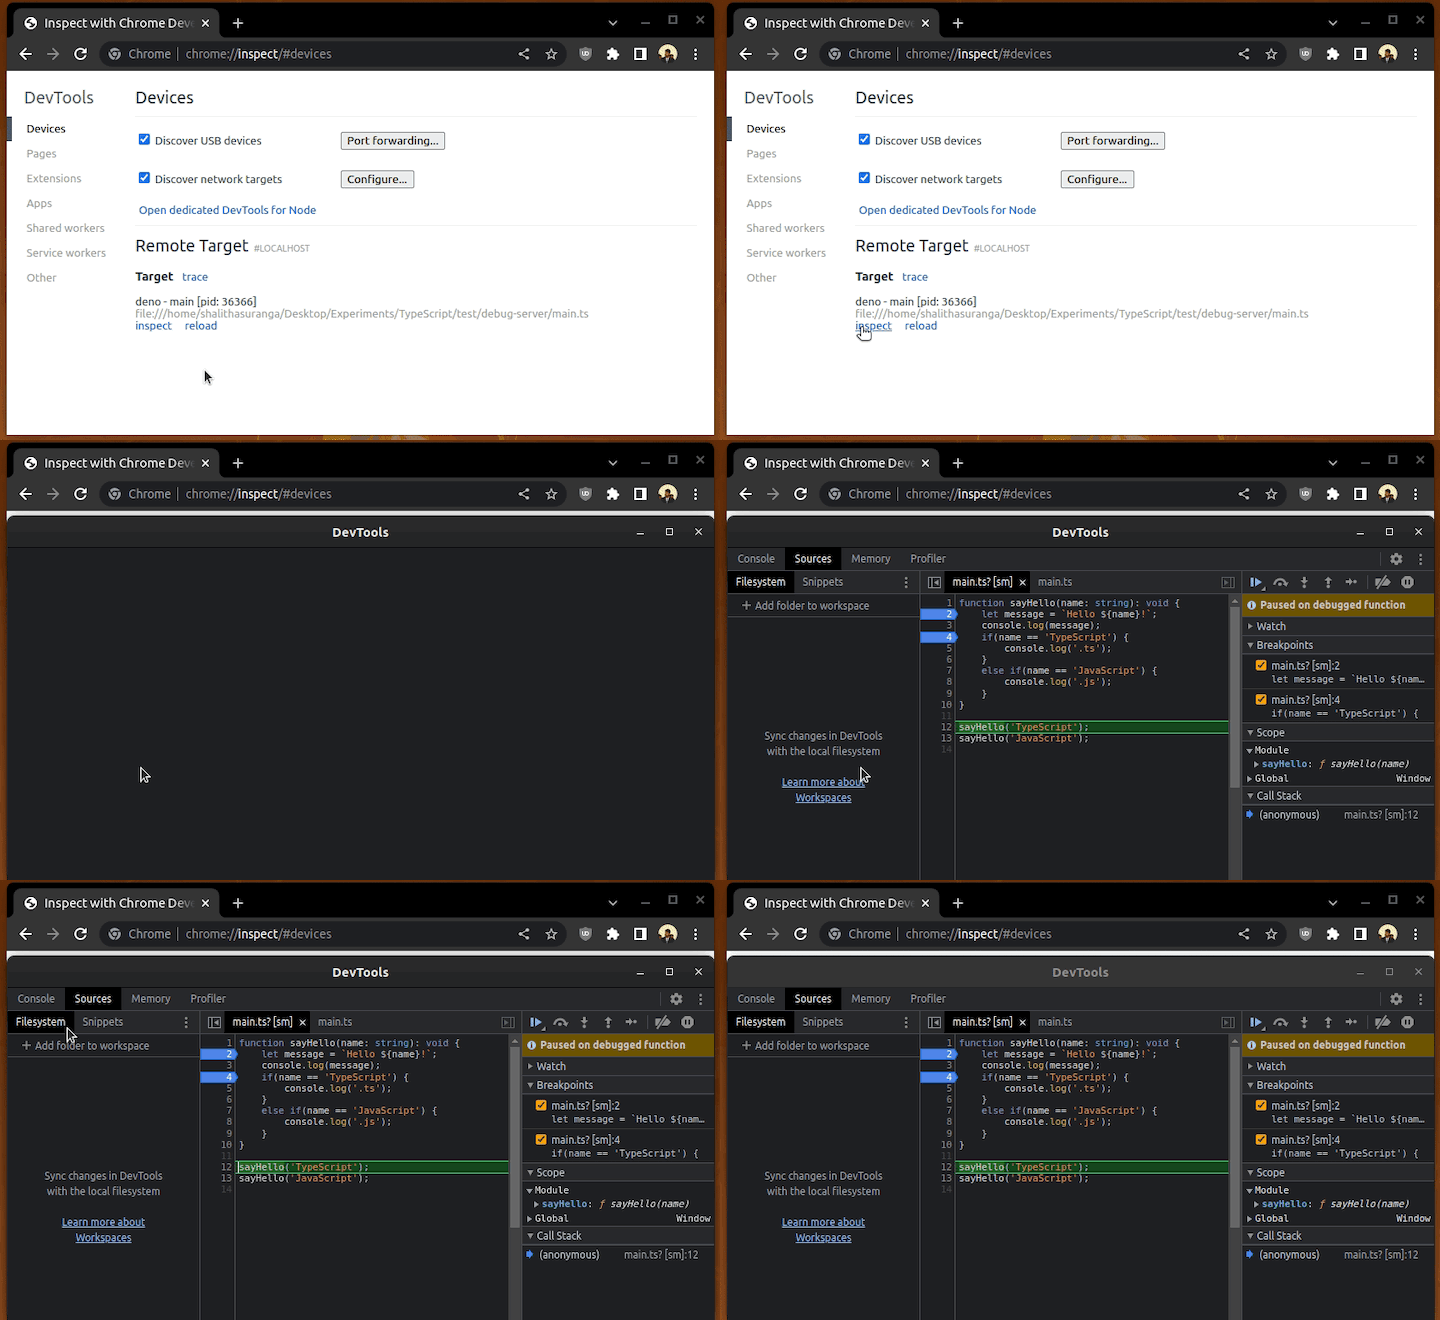
You can debug the TypeScript file via the Chrome DevTools interface. The debugger utility reflects your debugging actions on the terminal. Look at the following preview:
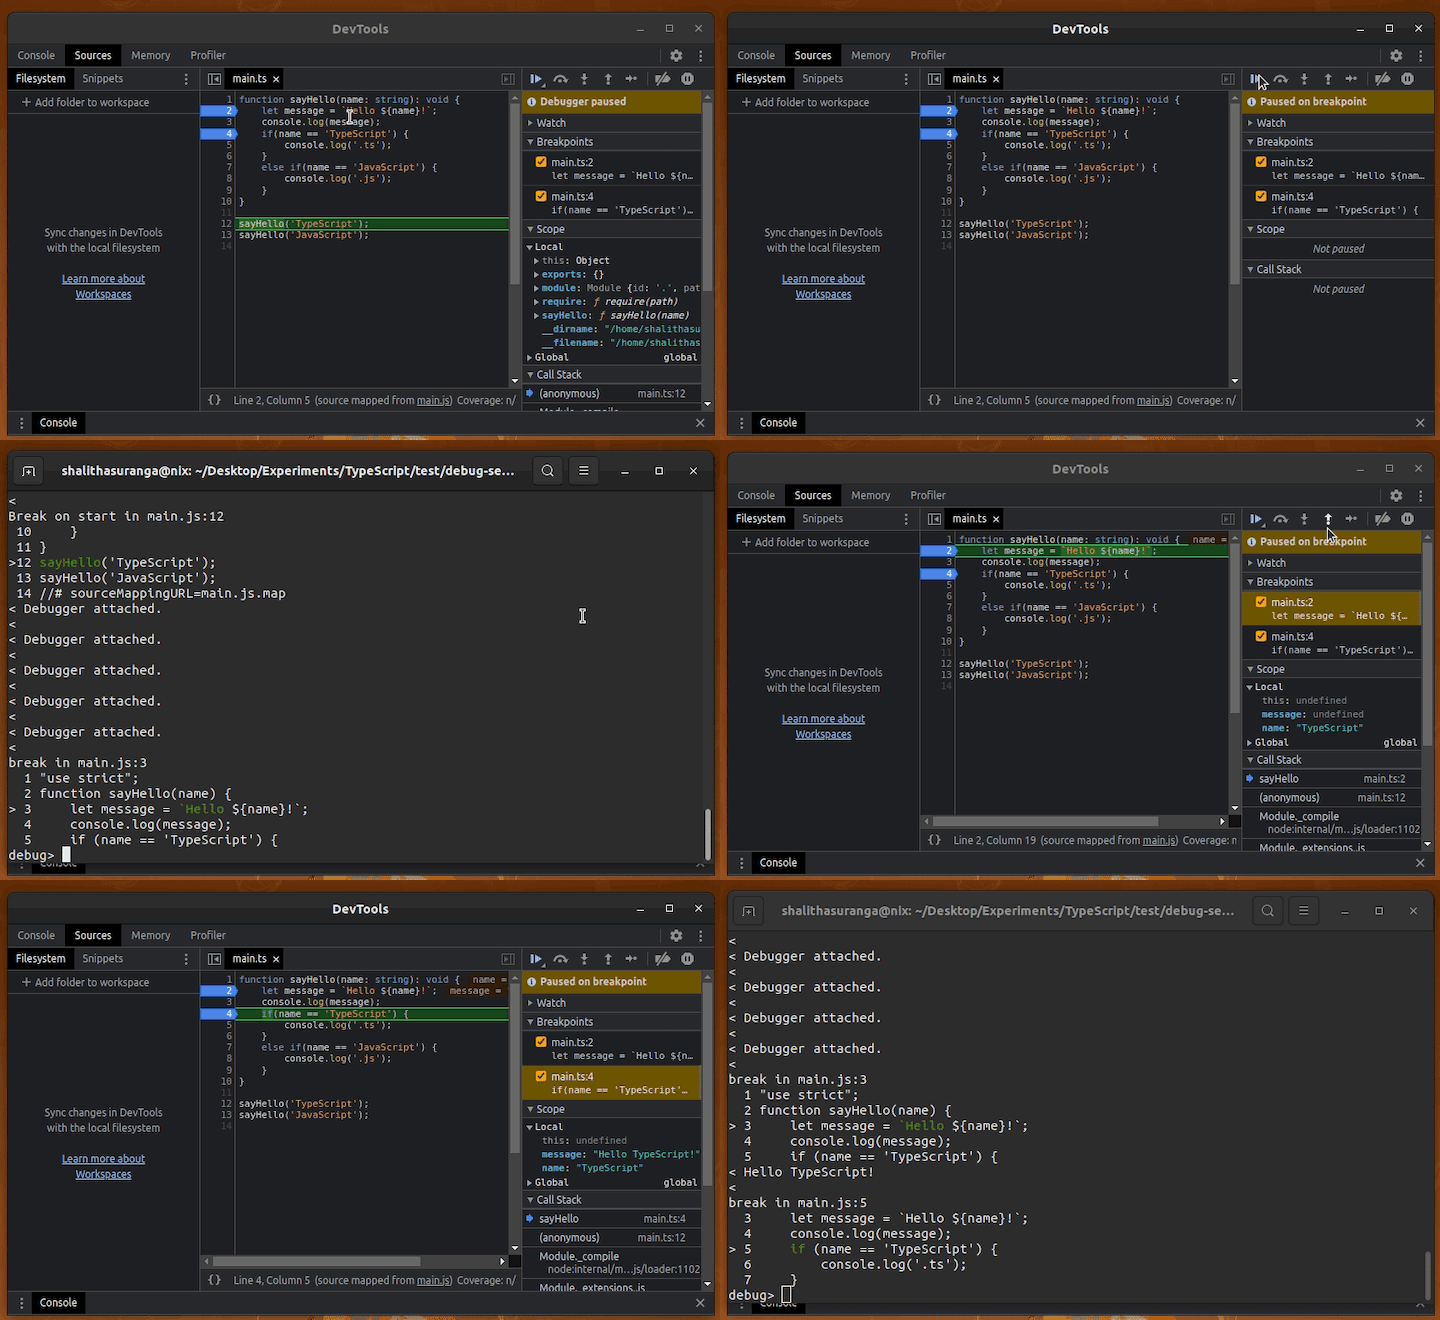
Earlier, the sample React project pre-transpiled modified TypeScript code during code changes. You can do the same for server-side TypeScript projects with tsc --watch and nodemon or ts-node-dev.
Deno is a secure TypeScript runtime that you can use as an alternative to the Node.js runtime. Debugging TypeScript in Deno doesn’t require manual configuration the way TypeScript-based Node.js apps do, since Deno natively supports TypeScript.
First, make sure that you already have Deno installed on your computer. If not, install the latest Deno runtime version according to the official installation guide.
Start the Deno debugger with the following command in the TypeScript-based Node.js project directory we created earlier:
deno run --inspect-brk main.ts
Then, open DevTools and start debugging:
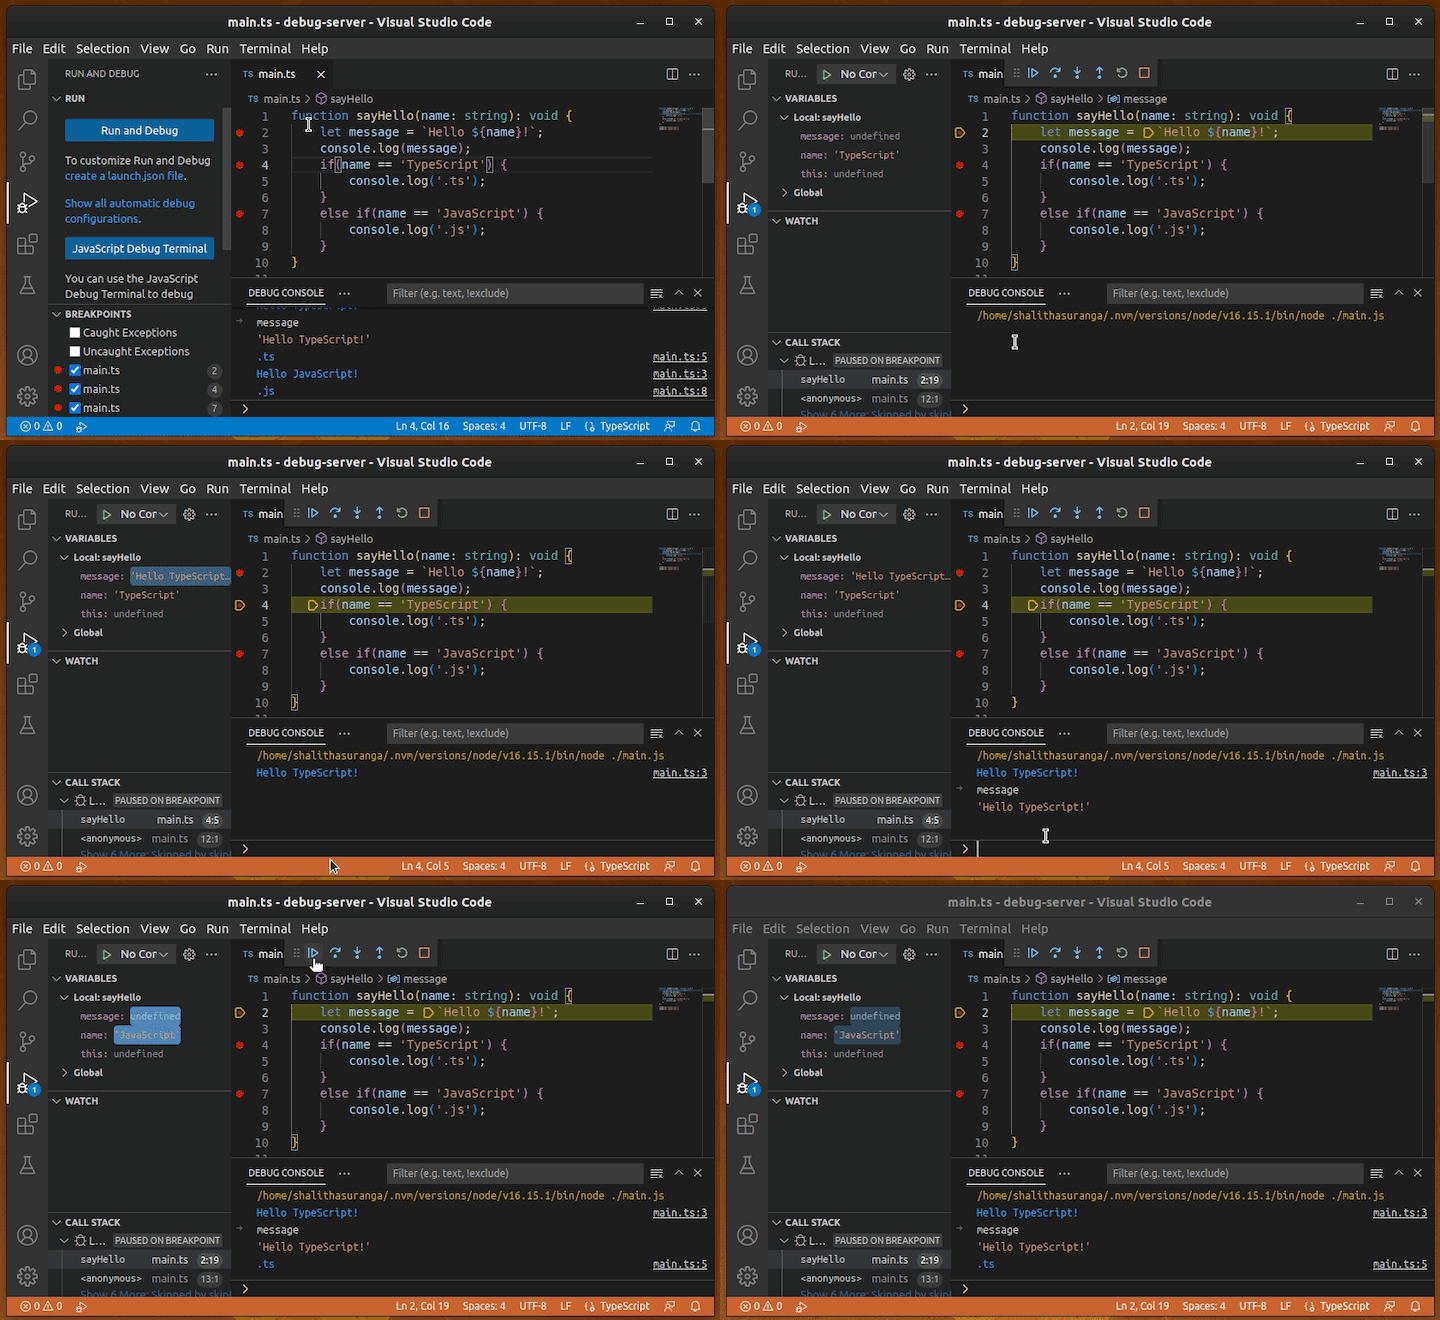
You can press F5 and debug Node.js apps without extra extensions because the inbuilt debugger extension supports Node.js debugging.
For Deno, you can either install the Deno extension for automatic launch.json configuration or manually use the following launch.json setup:
{
    "version": "0.2.0",
    "configurations": [
      {
        "name": "Deno",
        "type": "node",
        "request": "launch",
        "cwd": "${workspaceFolder}",
        "runtimeExecutable": "deno",
        "runtimeArgs": ["run", "--inspect-brk", "-A", "${file}"],
        "attachSimplePort": 9229
      }
    ]
 }
See how I debug a TypeScript file with VS Code:
JavaScript-based cross-platform mobile app development frameworks make development workflow easier by letting developers build apps with a platform-independent single codebase. There are two types of JavaScript-based mobile frameworks:
We can use TypeScript to create apps using both framework types, so it’s important that we’re able to debug TypeScript-based mobile app code. Chrome and the Android WebView implementation work collaboratively to let developers debug TypeScript web apps (loaded in WebViews) on the Chrome desktop app via the Android developer mode and Chrome remote debugging feature. The second framework type comes with inbuilt debugging tooling that allows us to use Chrome DevTools for debugging purposes.
Let’s take a closer look at how to debug various TypeScript mobile apps with Chrome.
Previously, we saw how to debug Node.js/Deno server-side apps by entering Chrome DevTools via the chrome://inspect internal page. Similarly, we can inspect currently running Android WebViews. If a WebView-loaded source maps for TypeScript, we can debug the TypeScript web app source from the Chrome desktop app. To demonstrate this scenario, we need a webview that runs a TypeScript web app.
First, start any TypeScript-based web app in development mode. If you created the previous TypeScript React app with this tutorial, you can start it too with one of the following commands:
npm start
# --- or ---
yarn start
This is the app we’ll load in an Android WebView component. We can’t refer to localhost URLs from mobile phones, even though computers and mobile phones use the same WiFi network. To load the TypeScript app from mobile devices, we need to use the computer’s IP address, like so:
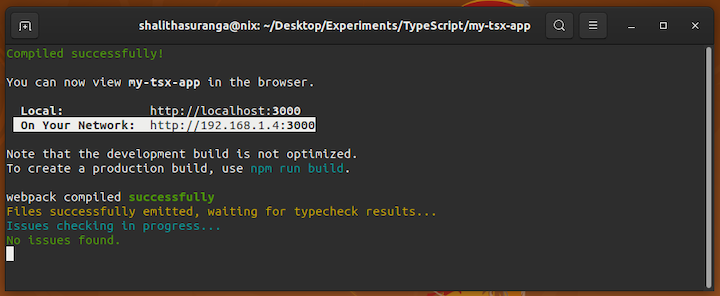
Using this URL, you’ll be able to view your TypeScript app on mobile. Next, let’s create an Android WebView instance and load this URL. I’ll use Flutter to create a native webview easily, so be sure to install the latest Flutter SDK version before getting started.
Create a new Flutter app:
flutter create webview_app_demo
cd webview_app_demo
Install the webview_flutter plugin:
flutter pub add webview_flutter
Update the minimum SDK version property in android/app/build.gradle :
defaultConfig {
    // ----
    // ---
    minSdkVersion 19
    // ---
}
Now, let the mobile app access internet and load HTTP pages by adding the following permission and the usesCleartextTraffic property to AndroidManifest.xml:
<manifest xmlns:android="http://schemas.android.com/apk/res/android">
    <uses-permission android:name="android.permission.INTERNET" />
    <application
      android:usesCleartextTraffic="true"
      ....
    ....
    ....
Finally, add the following code to your main.dart file to load the TypeScript web app into a webview. Be sure to replace <computer_ip> with the real computer IP you noted previously:
import 'package:flutter/material.dart';
import 'package:webview_flutter/webview_flutter.dart';

void main() => runApp(const MyApp());

class MyApp extends StatelessWidget {
  const MyApp({super.key});

  @override
  Widget build(BuildContext context) {
    return MaterialApp(
        title: 'Flutter Demo',
        theme: ThemeData(
          useMaterial3: true,
        ),
        home: const MyStatefulWidget());
  }
}

class MyStatefulWidget extends StatefulWidget {
  const MyStatefulWidget({super.key});

  @override
  State<MyStatefulWidget> createState() => _MyStatefulWidgetState();
}

class _MyStatefulWidgetState extends State<MyStatefulWidget> {
  late final WebViewController controller;
  @override
  void initState() {
    super.initState();
    controller = WebViewController()
      ..setJavaScriptMode(JavaScriptMode.unrestricted)
      ..loadRequest(Uri.parse('http://<computer_ip>:3000'));
  }

  @override
  Widget build(BuildContext context) {
    return Scaffold(
        appBar: AppBar(
          title: const Text('Flutter WebView Demo'),
        ),
        body: WebViewWidget(controller: controller));
  }
}
Run the Flutter app with the following command:
flutter run
Now you can inspect this webview with the Chrome remote debugging feature. First, go to the chrome://inspect internal page, find the WebView instance, and click inspect:
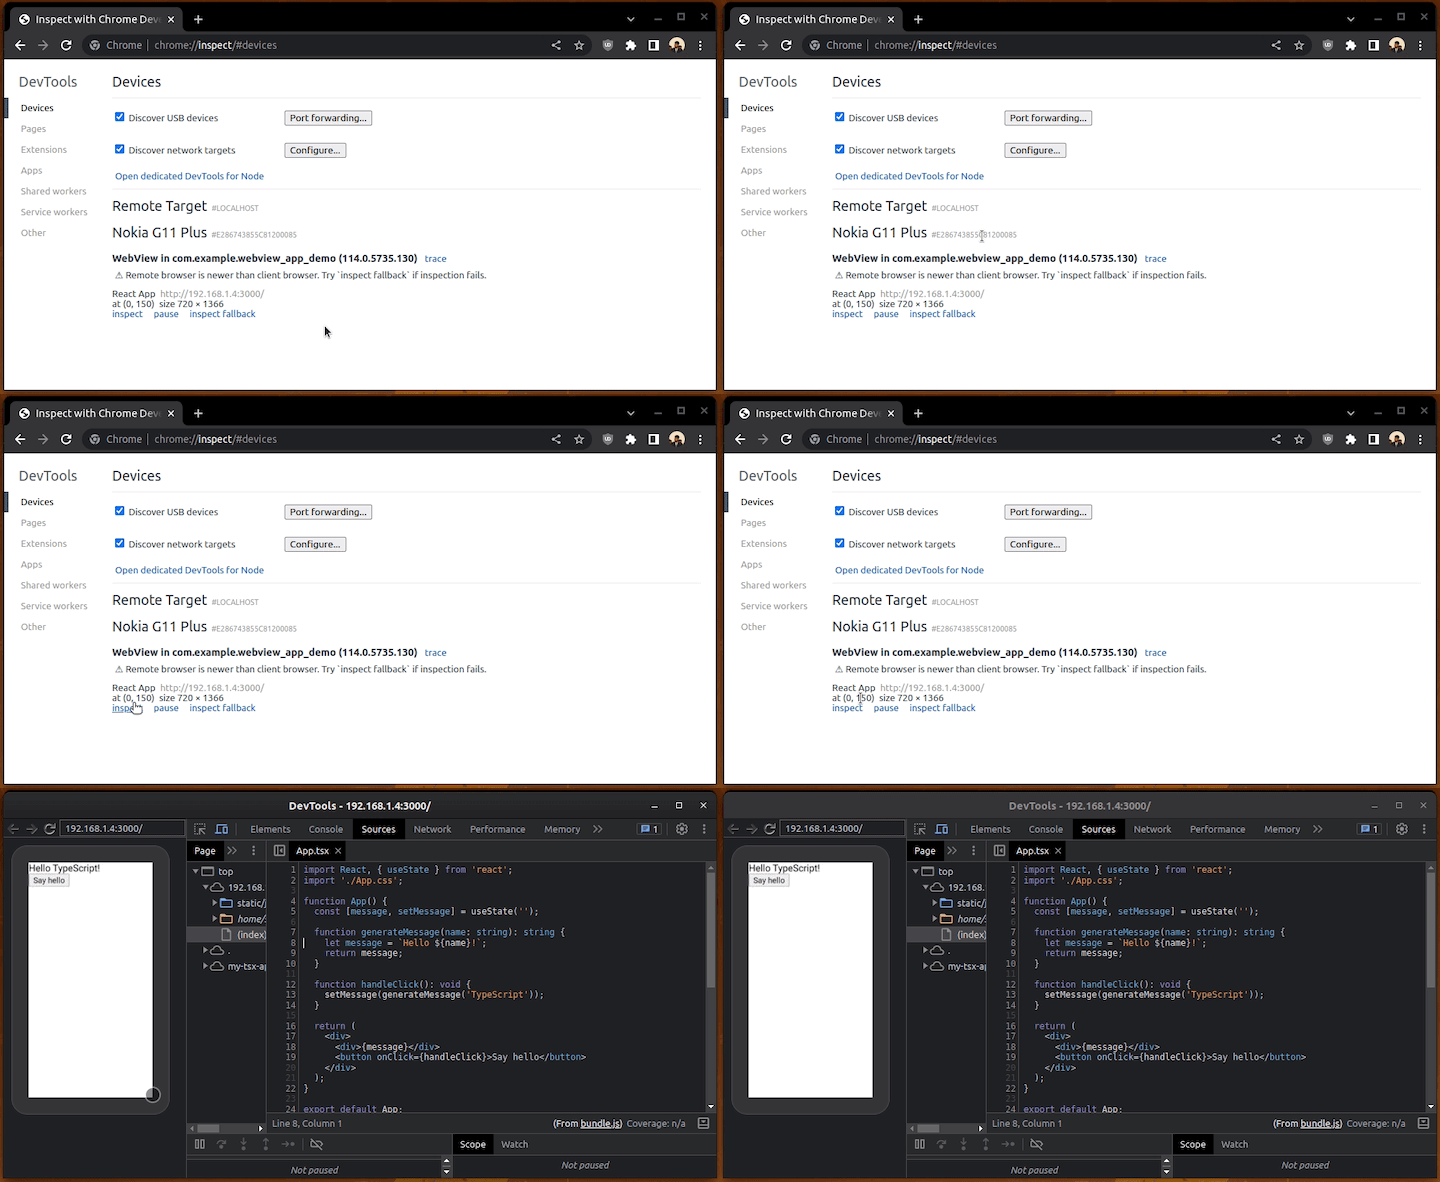
To set up a breakpoint for the TypeScript React app, tap the Say hello button from your mobile phone, and look at DevTools. The debugging process is doable in a remote way:
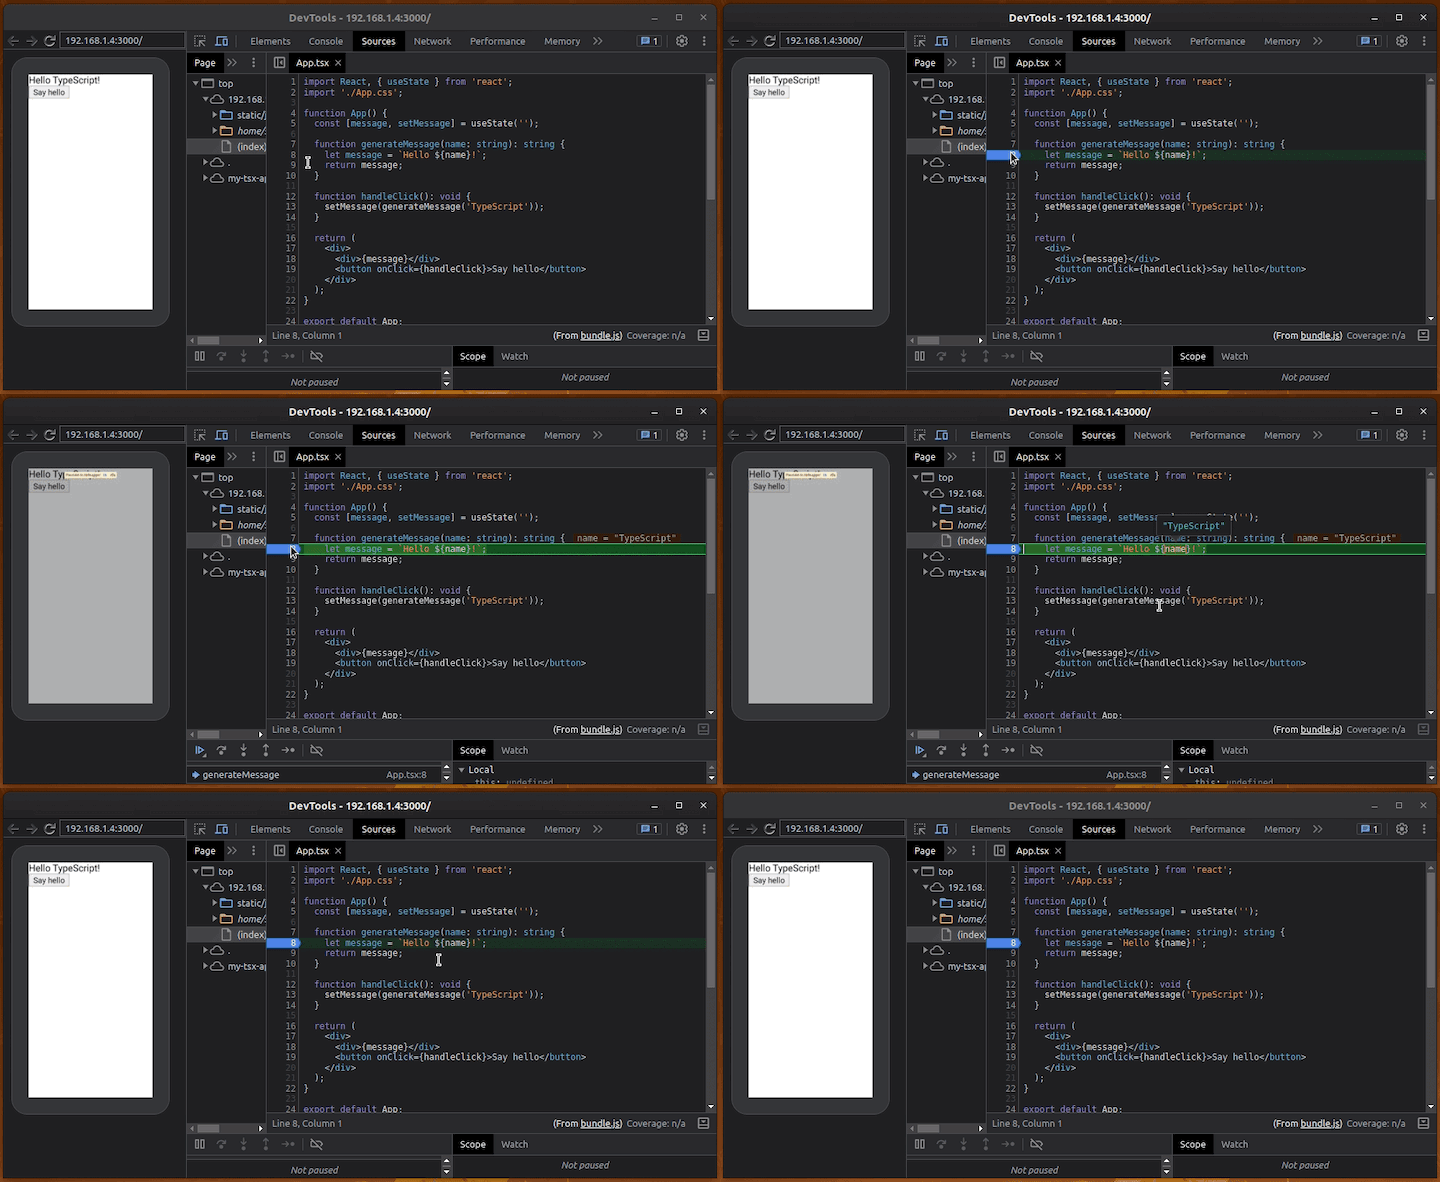
Here we used Flutter to create an Android WebView-based app, but this debugging technique works for webviews created with native Android SDK (Java/Kotlin-based) and other frameworks, like Xamarin, React Native, etc.
You can also use this Chrome remote debugging approach to debug TypeScript-based hybrid mobile apps written with the Ionic, Capacitor.js, and Apache Cordova frameworks. Chrome can’t inspect WKWebView-based hybrid apps in iOS mobile devices, but you can use Apple Safari’s web inspection feature to do it.
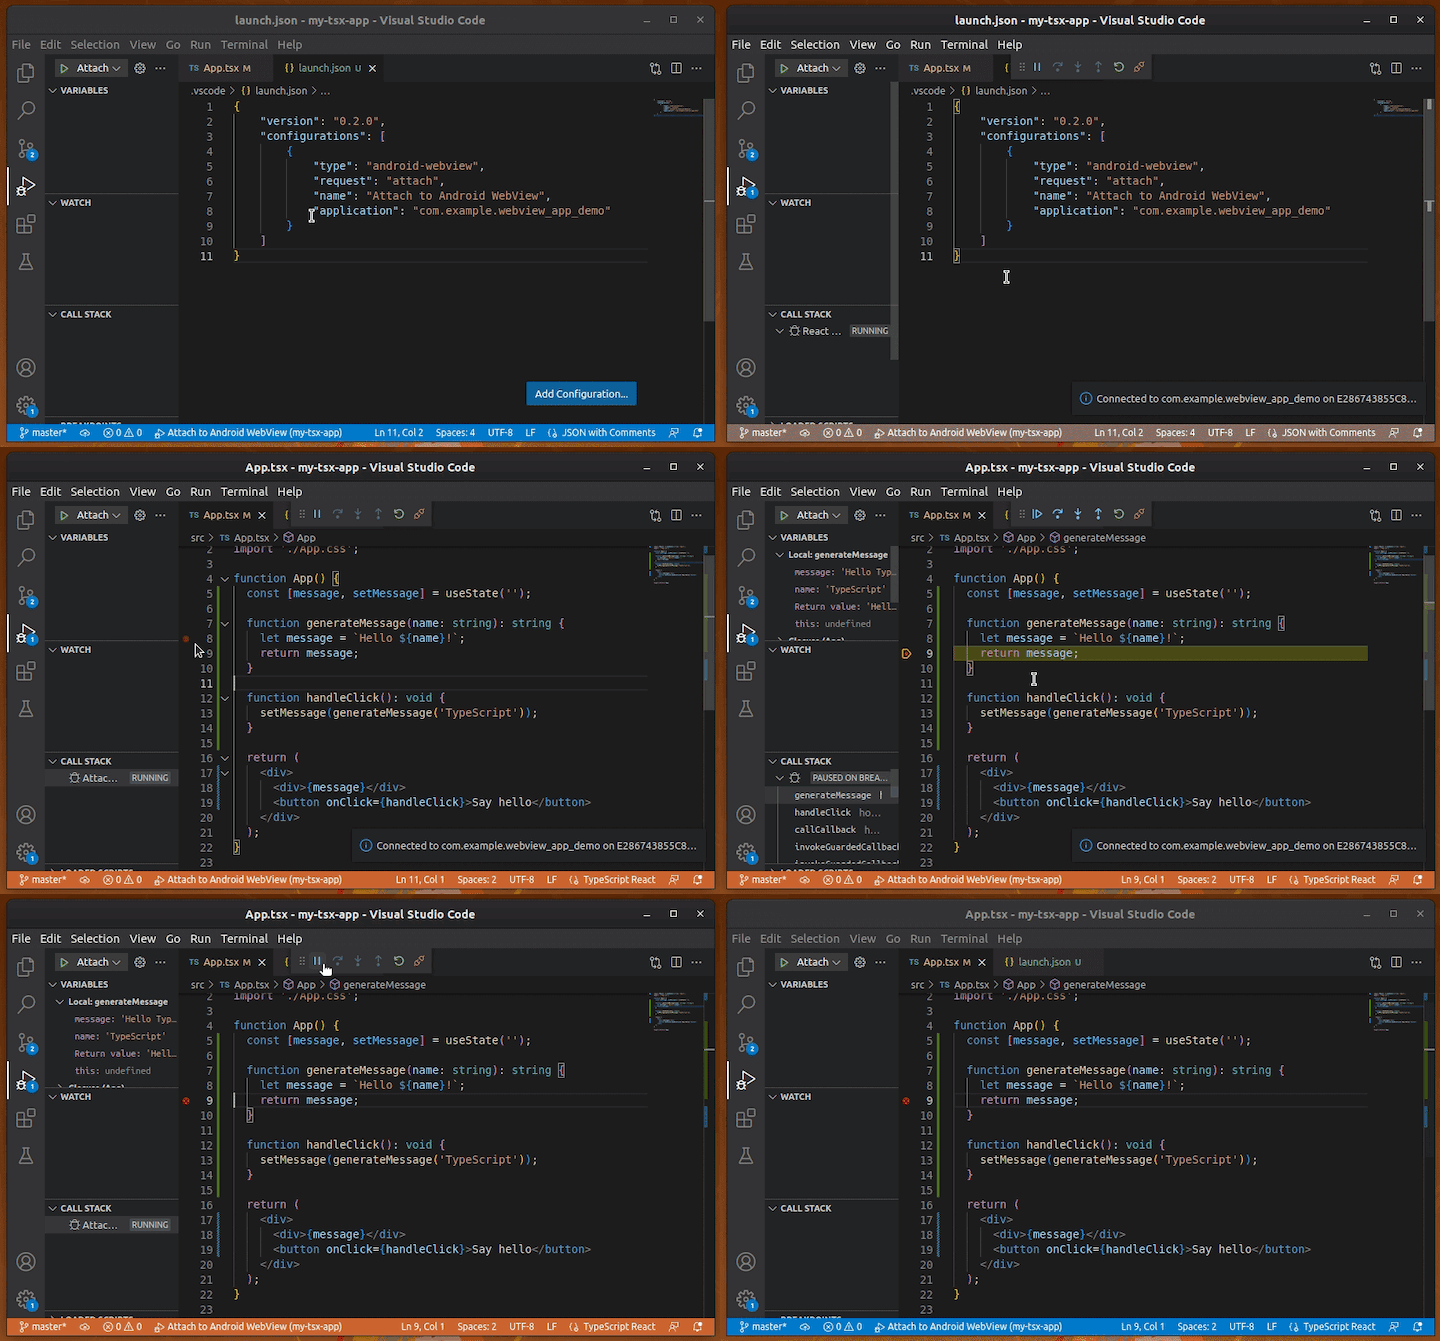
Earlier, we saw how to use the Chrome DevTools debugging interface for WebView-based TypeScript mobile app debugging. If you are a diehard VS Code fan, you can debug Android WebViews right in your editor using this free extension.
Keep running the previous TypeScript hybrid app on your mobile device. Now, let’s debug it on VS Code.
After you install the Android WebView Debugging extension, you can use the following launch.json configuration to attach the VS Code debugger interface to the running Android WebView instance in your mobile app. Be sure to use the correct application identifier for the application property:
{
    "version": "0.2.0",
    "configurations": [
        {
            "type": "android-webview",
            "request": "attach",
            "name": "Attach to Android WebView",
            "application": "com.example.webview_app_demo"
        }
    ]
}
Once you use the above configuration for your TypeScript web app project, you can press F5, attach the VS Code inbuilt debugger frontend to the preferred WebView app, and start debugging, as shown in the following preview:
Starting with v0.71, the official React Native CLI scaffolds apps using TypeScript by default, so there’s even more motivation for us to use TypeScript for building React Native apps. The React Native framework comes with an inbuilt debugger web app that hosts TypeScript mobile app code inside a web worker. Therefore, you can use Chrome or any browser that supports the web workers specification to debug TypeScript React Native app source codes.
Now, let’s see how to debug a TypeScript-based React Native app with Chrome. First, create a new React Native app with the following command:
npx react-native init MyApp
cd MyApp
Next, add the following TypeScript code snippet to your App.tsx file:
import React, { useState } from 'react';
import {
  SafeAreaView,
  StyleSheet,
  View,
  Button,
  Text
} from 'react-native';

function App(): JSX.Element {
  const [message, setMessage] = useState('');

  function generateMessage(name: string): string {
    let message: string = `Hello ${name}!`;
    return message;
  }

  function handlePress(): void {
    setMessage(generateMessage('TypeScript'));
  }

  return (
    <SafeAreaView style={styles.container}>
      <View>
        <Text style={styles.message}>{message}</Text>
        <Button onPress={handlePress} title="Say hello"/>
      </View>
    </SafeAreaView>
  );
}

const styles = StyleSheet.create({
  container: {
    marginTop: 32,
    padding: 24,
  },
  message: {
    marginBottom: 32,
    fontSize: 20
  }
});

export default App;
Next, start the app and run it on your mobile device with the following command:
npm start
# --- or ---
yarn start
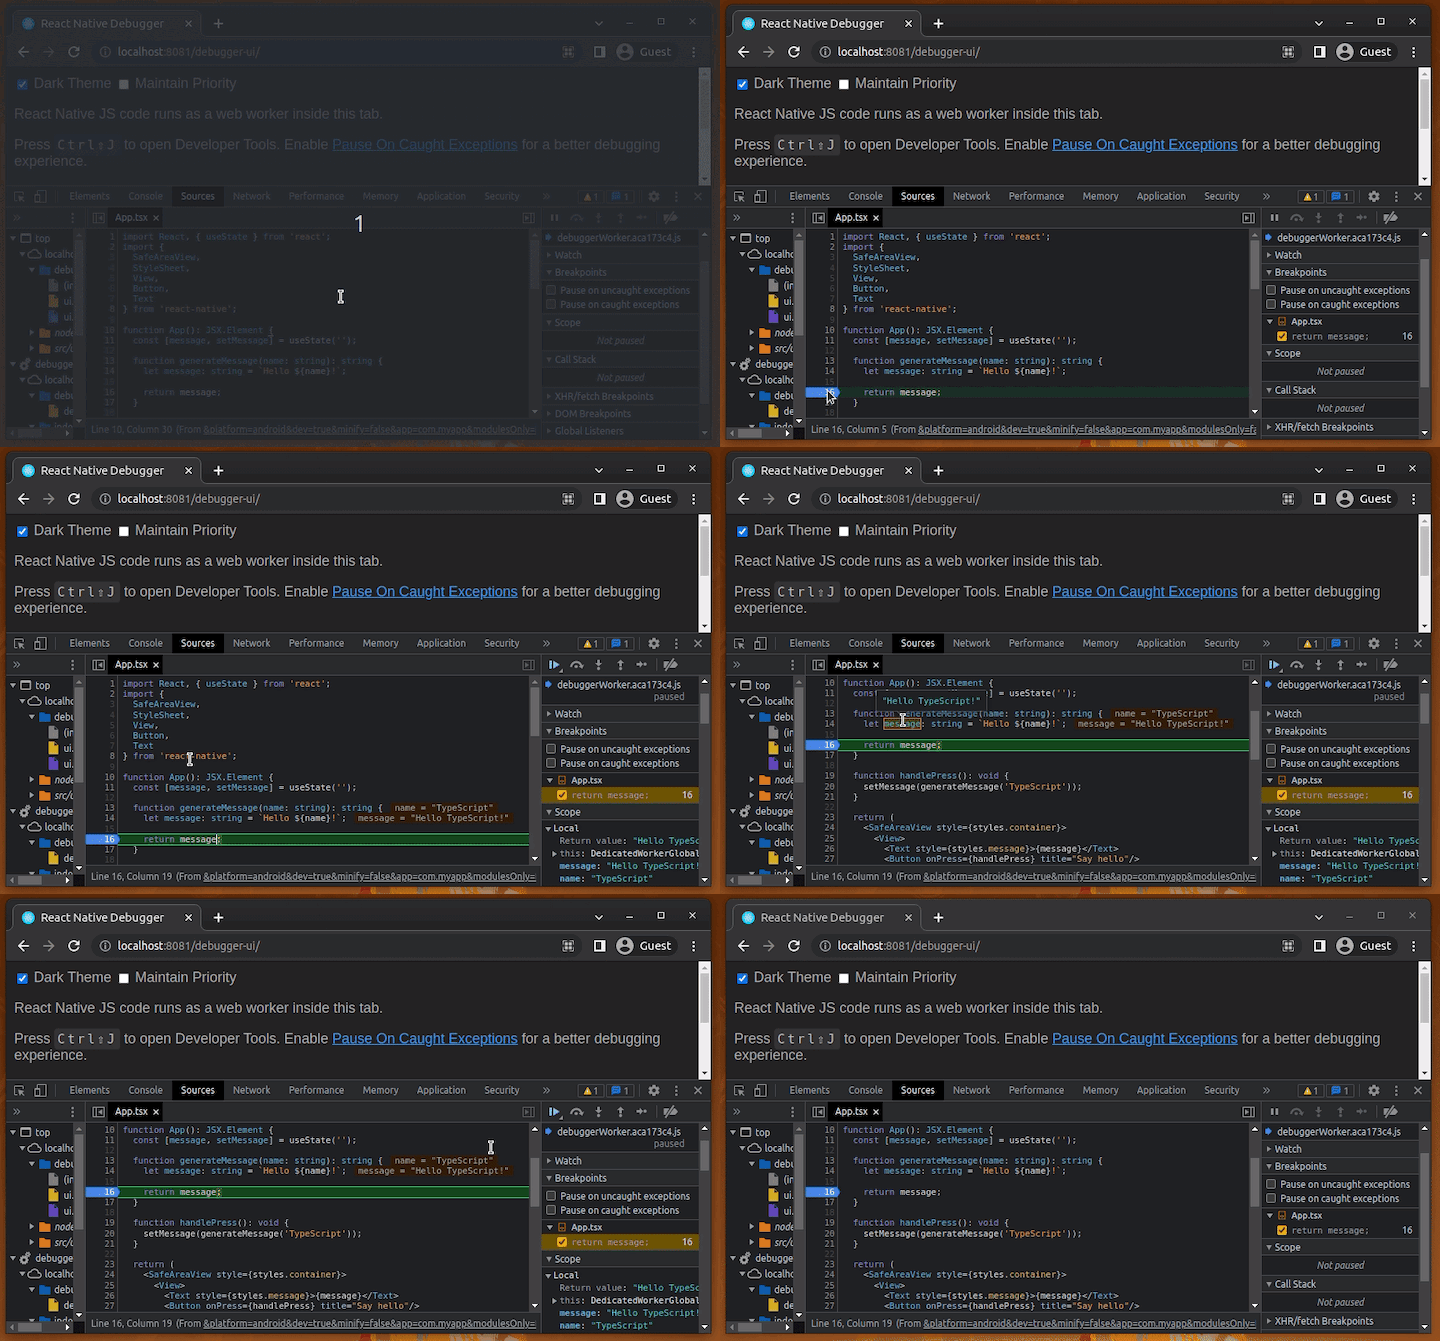
Once the app is loaded, you can press d from your terminal to open the developer tools menu in the mobile app. Then, select the Debug menu item to enable debugging features. React Native will open the debugger UI in your default browser. You should also be able to access the following URL manually with Chrome too if Chrome is not your default web browser:
http://localhost:8081/debugger-ui/
Open DevTools for the debugger web app and start debugging your TypeScript mobile code:
It’s possible to debug React Native apps from VS Code too. You can read this article and learn VS Code React Native debugging configuration.
NativeScript is a JavaScript-oriented cross-platform mobile app development framework implemented using a similar concept that React Native follows. It embeds a JavaScript runtime (v8) to cross-platform mobile apps and creates a JavaScript-native interface to let JavaScript access native SDKs, similar to React Native.
NativeScript lets developers build apps with TypeScript-ready web frameworks like Angular, React, and Svelte, so it’s important that we’re able to debug TypeScript NativeScript apps. NativeScript implements the Chrome DevTools protocol to let developers debug NativeScript apps in Chrome.
Let’s see how to debug a plain TypeScript-based NativeScript app with Chrome.
First, configure the development environment based on the official documentation and create a new NativeScript app with the TypeScript template as follows:
ns create MyApp --ts
This TypeScript starter project has a button press callback implemented already, so you don’t need to modify the source code for the upcoming debugging demonstration.
Run the app on your mobile device in NativeScript debug mode as follows:
ns debug android
# --- or ---
ns debug ios
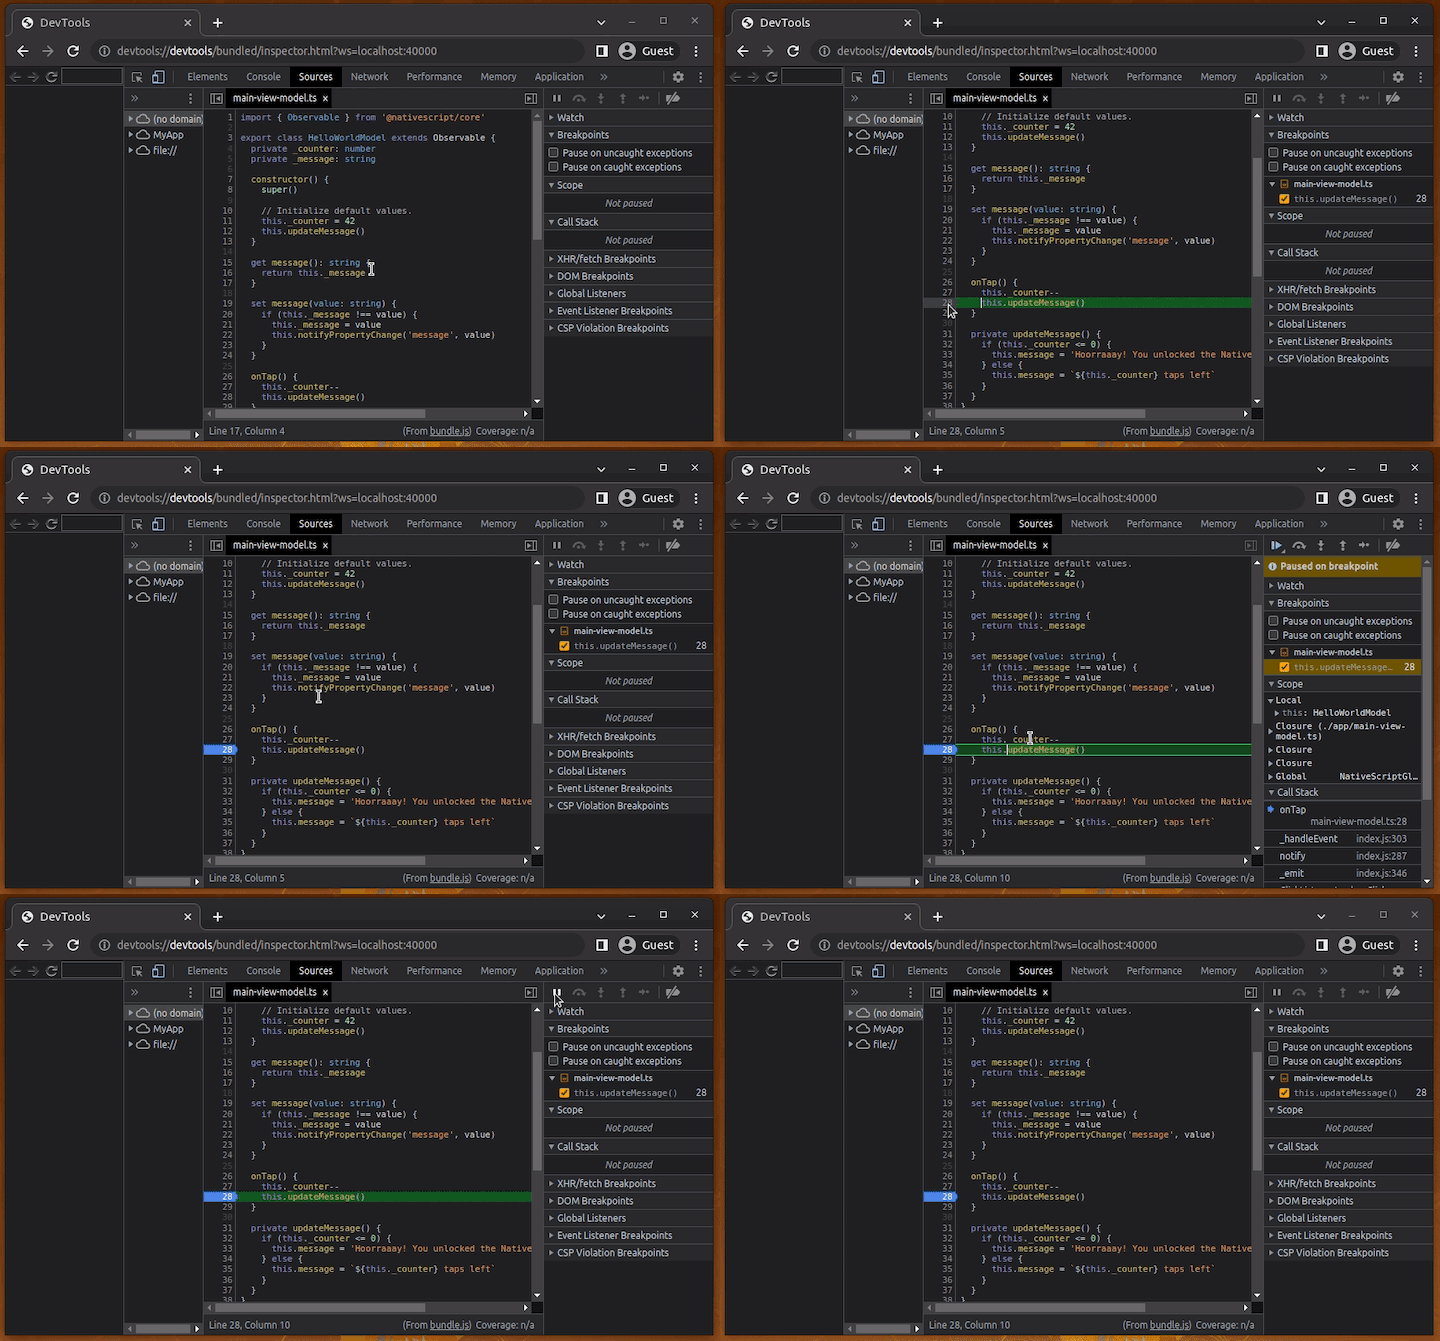
Once the app is loaded in debug mode, the NativeScript CLI will print the Chrome DevTools UI URL:
devtools://devtools/bundled/inspector.html?ws=localhost:40000
Navigate to this debugger URL with Chrome. Then, you can debug your TypeScript app source, as shown in the following preview:
To debug NativeScript apps with the VS Code inbuilt debugger interface, you can use this free extension.
The main goal of debugging is to identify software bugs by monitoring source code execution and manually reviewing code. In most web development debugging activities, we can identify bugs by reading the code and using well-known debugger utility features. But, in some complex scenarios, we have to generate many test cases and use advanced debugger features.
Most web developers use the standard Console API (i.e., console.log) for debugging purposes; others start with the Chrome DevTools debugger or VS Code’s debugger UI. When you start tracing a bug, start by analyzing the suspected code segment from top to bottom. If you haven’t found the bug, then try to log runtime values if the logical flow is not complex. If the logical flow is complex, starting with Chrome debugger or VS Code debugger UI saves you time.
In this tutorial, we discussed how to use Chrome for debugging your browser, Node.js, Deno, and mobile apps written in TypeScript. We also discussed how to use VS Code’s debugger UI.
You can customize and use these debugging techniques according to your requirements and personal preferences. Similar to frontend frameworks’ TypeScript templates, you can use the node-typescript-boilerplate to create a TypeScript-based Node.js project faster with a pre-configured debugging environment. Or, you can create your own template with the steps we discussed in this tutorial.
LogRocket lets you replay user sessions, eliminating guesswork by showing exactly what users experienced. It captures console logs, errors, network requests, and pixel-perfect DOM recordings — compatible with all frameworks, and with plugins to log additional context from Redux, Vuex, and @ngrx/store.
With Galileo AI, you can instantly identify and explain user struggles with automated monitoring of your entire product experience.
Modernize how you understand your web and mobile apps — start monitoring for free.
Hey there, want to help make our blog better?
Join LogRocket’s Content Advisory Board. You’ll help inform the type of content we create and get access to exclusive meetups, social accreditation, and swag.
Sign up now
Discover how the Interface Segregation Principle (ISP) keeps your code lean, modular, and maintainable using real-world analogies and practical examples.

<selectedcontent> element improves dropdowns

Learn how to implement an advanced caching layer in a Node.js app using Valkey, a high-performance, Redis-compatible in-memory datastore.

Learn how to properly handle rejected promises in TypeScript using Angular, with tips for retry logic, typed results, and avoiding unhandled exceptions.