As a PM, you deal with products that utilize complex product-customer interactions to build out solutions that solve user pain points and encourage them to return again and again. However, keeping track of how objects interact within a particular system can be difficult. This is where sequence diagrams come in.
Sequence diagrams help with system integration, business process modeling, and communication. This article will cover the full spectrum of sequence diagrams, from the basics to advanced concepts and practical applications.
A sequence diagram illustrates how objects interact in a particular sequence to accomplish a specific task or process by visually representing the flow of messages and events between different objects in a software system over time. Sequence diagrams are often created with the unified modeling language (UML), a general-purpose visual modeling language intended to provide a standard way to visualize the design of a system.
A sequence diagram is composed of several key components that provide a clear and detailed view of how system elements collaborate over time:
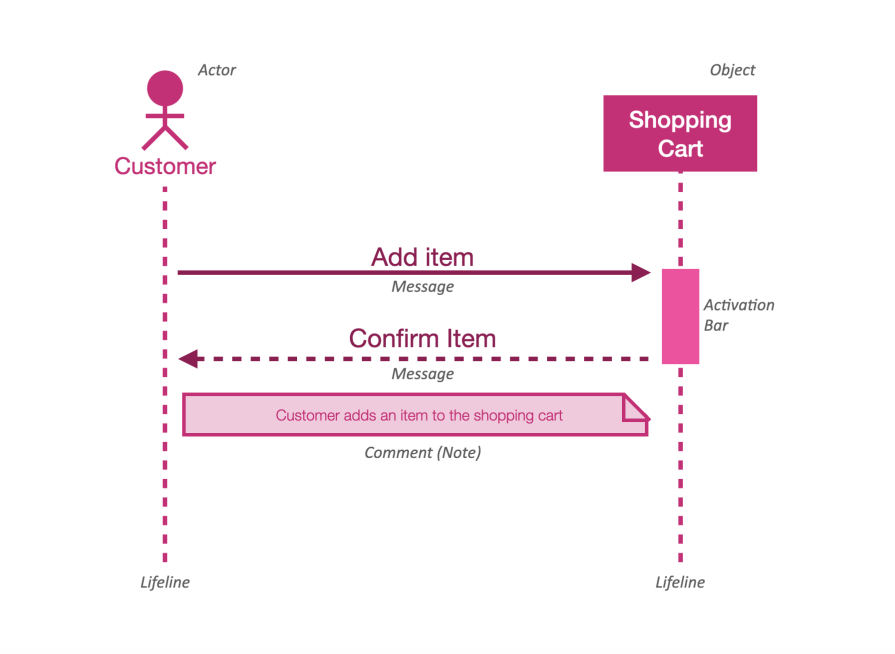
Above is a simple sequence diagram for a high-level scenario of a customer adding an item to a shopping cart. This diagram includes the basic components of a sequence diagram:
Now that you know how to read a sequence diagram, here are some more advanced methods of notation that are widely used in sequence diagrams:
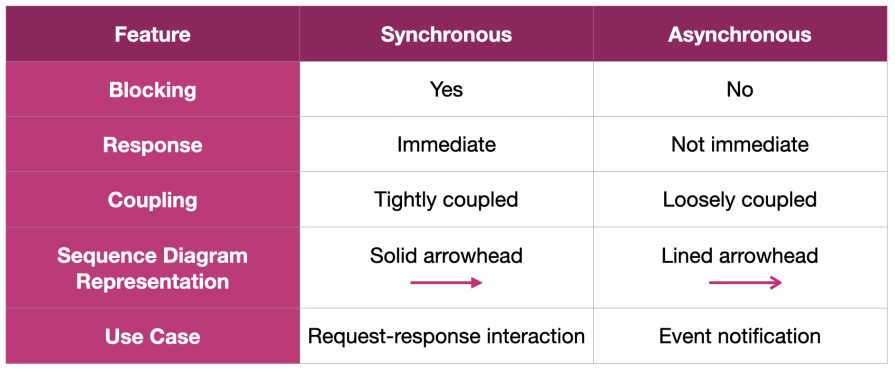
Synchronous messages occur when the sender waits for the receiver to process the message and return a response before proceeding with its next action. The sender expects an immediate response, making the interaction a tightly coupled operation.
Asynchronous messages, on the other hand, are those where the sender sends the message and proceeds with its next action without waiting for the receiver to process the message. The interaction is more loosely coupled, and often used for event-driven systems:
In a sequence diagram, a self-message (or self-call) represents a call to an internal method or function. You depicted this with a message arrow that starts and ends at the same object.
Scenario of self-message
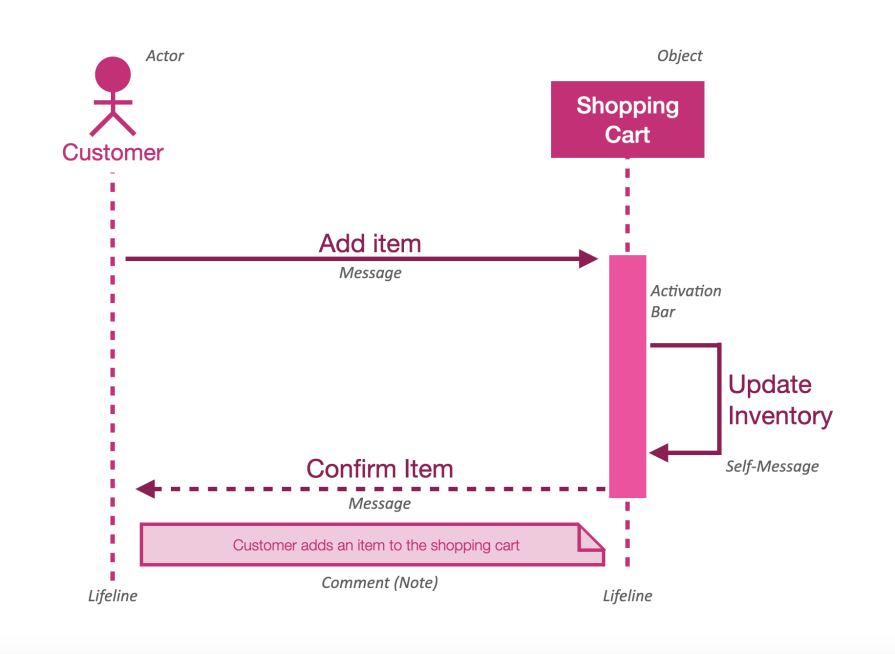
In the above scenario, the self-message “update inventory” represents an internal process within the shopping cart system, triggered by a customer’s action of adding an item.
Fragments are boxes that group interactions and depict conditional or iterative behavior. Four basic types of fragments are listed below:
Scenario of alt (alternative) fragment:
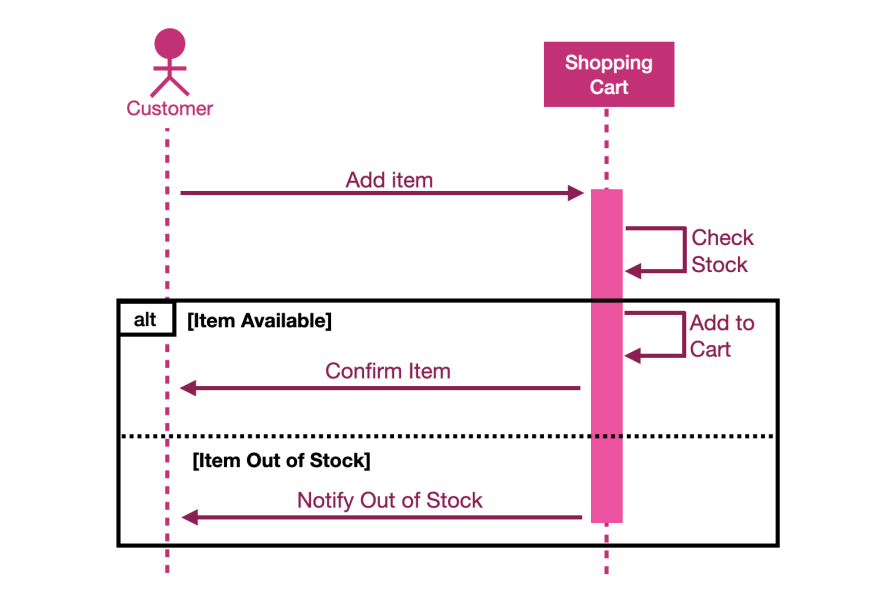
In the above scenario, you can use an “alt” fragment to represent the situation where the item might be out of stock. This sequence diagram captures the conditional logic of handling item availability using the “alt” fragment.
Creation messages — Represented by a message that leads to the appearance of the object’s lifeline
Destruction messages — Represented by a message arrow pointing to an “X” at the bottom of the object’s lifeline. They are special messages that indicate the destruction of objects
Scenario of creation and destruction:
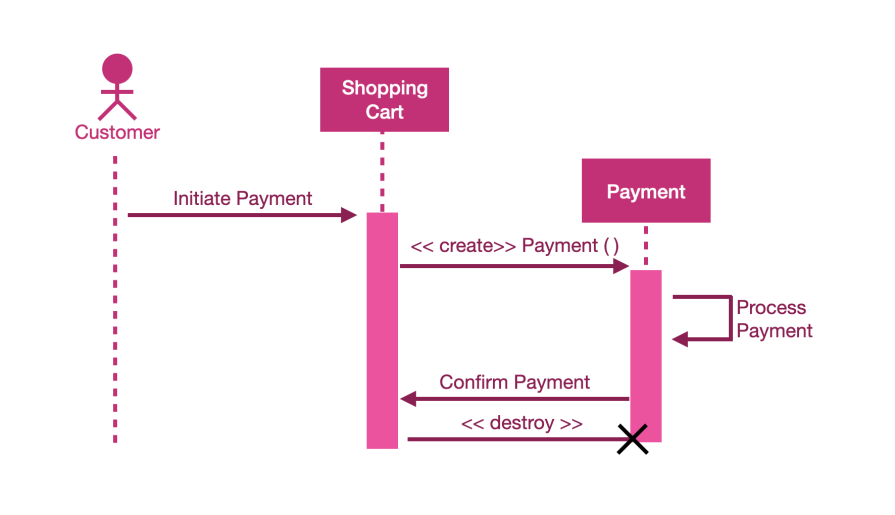
In the scenario, the “payment” object is created when the customer initiates a payment and destroyed when the payment is confirmed.
Now that you know how to read and create sequence diagrams, let’s discuss how to create an effective sequence diagram that your stakeholders will love!
When creating a sequence diagram, make sure to set boundaries. The starting point and end point of the interaction must be clear. As a PM, you write user stories to address the users, their pain points, and the solution.
You can leverage the user story to define the scope of the functionality or process you want to illustrate with the sequence diagram. When there are too many scenarios to cover, don’t hesitate to break them into multiple diagrams.
Try to keep the diagrams simple and readable, or your audience might lose focus or even interest very quickly. Avoid including irrelevant systems, as well as overloading the diagram with too many details.
An effective sequence diagram focuses on the main interactions. If a process is too complex, break it down into multiple smaller sequence diagrams.
Share the diagram with relevant stakeholders, such as developers, designers, business stakeholders, etc., to ensure the existing process is accurate and confirm that the future plan meets the requirements.
With feedback from the stakeholders, you can make necessary adjustments and ensure the diagram accurately represents the desired interactions.
Common use cases for sequence diagrams include modeling user interactions, designing system processes, and understanding object interactions within a system. The biggest benefits of using sequence diagrams include:
It’s easy to verify interactions with sequence diagrams because they provide a visual representation of system requirements. They serve as a common language for discussing functionalities and requirements, making sequence diagrams great for facilitating communication between stakeholders, developers, and designers.
Sequence diagrams help with validating and refining system design by enabling you to visualize detailed workflows. They help identify potential design issues, such as missing interactions or incorrect message sequences, early in the development process.
Documentation can be challenging as a team grows or a product/system scales. Sequence diagrams capture the behavior of system functionality. Because of this, they’re a comprehensive documentation tool, valuable for future reference and maintenance.
When using UML to create sequence diagrams, you can also enjoy the standardized way of documenting system interactions.
The diagrams are useful in planning and designing how different parts of a system or different systems integrate and interact with each other. It’s critical to ensure that all the components and services can work together seamlessly.
By explicitly showing the flow of messages in sequence diagrams, you can clearly focus on integration and see the timing of interactions, which is crucial for understanding the dynamic aspects of the system.
Sequence diagrams are a powerful tool in the realm of system integration and business process modeling. This guide has walked you through the essentials of sequence diagrams. By visualizing the interactions and message flows within a system, sequence diagrams facilitate clearer communication, enhance design validation, and provide valuable documentation.
Embracing these diagrams can lead to more efficient development processes, better system integration, and ultimately, a more cohesive and well-functioning software system. Hopefully the sequence diagram becomes a part of your toolkit and enables you to create products with confidence!
Featured image source: IconScout

LogRocket identifies friction points in the user experience so you can make informed decisions about product and design changes that must happen to hit your goals.
With LogRocket, you can understand the scope of the issues affecting your product and prioritize the changes that need to be made. LogRocket simplifies workflows by allowing Engineering, Product, UX, and Design teams to work from the same data as you, eliminating any confusion about what needs to be done.
Get your teams on the same page — try LogRocket today.
Maryam Ashoori, VP of Product and Engineering at IBM’s Watsonx platform, talks about the messy reality of enterprise AI deployment.

A product manager’s guide to deciding when automation is enough, when AI adds value, and how to make the tradeoffs intentionally.

How AI reshaped product management in 2025 and what PMs must rethink in 2026 to stay effective in a rapidly changing product landscape.

Deepika Manglani, VP of Product at the LA Times, talks about how she’s bringing the 140-year-old institution into the future.