As a project manager, you need answers to tough questions like “Are employees taking on too much work?” or “Is this a reasonable timeline for this task?”

One way to find data-informed answers to these is by using cumulative flow diagrams. Visualizing your data can provide insight into workflow dynamics. And with the right data on your side, you can adapt your project workflows to ensure efficiency.
In this article, you’ll learn what a cumulative flow diagram is, what it reveals, and how to make one. You’ll also learn how to analyze a cumulative flow diagram and what actions you can take to enhance productivity.
A cumulative flow diagram is an advanced analytic tool that represents the stability of your workflow over time.
The purpose of a CFD is to visualize work in progress, anticipate bottlenecks, and make accurate workflow predictions. Using a CFD can help you make better decisions about deadlines and reasonable workflow timelines.
Cumulative flow diagrams are used in the Kanban methodology, but they also apply to other agile methodologies like Scaled Agile Framework (SAFe).
The CFD visualization is composed of three colored bands representing stages:
The colored bands are layered in the same graph and the width of the band represents the number of tasks in that stage.
All tasks or backlog items start in the to-do stage, which is the top band. Then it moves to the work-in-progress band before you can mark a task as completed. The completed tasks band is an accumulation of all tasks and serves as the bottom band.
With this data collected, you can visualize three important metrics:
Knowing these metrics can help you make informed decisions when optimizing a workflow or process.
In Kanban methodology, a cumulative flow diagram is important for ensuring workflow stabilization. Here are a few other benefits of using a CFD:
Reading a cumulative flow diagram doesn’t appear straightforward at first glance, but CFDs are understandable once you know where to look.
First, you need to know that the horizontal axis represents the timeline. The vertical axis demonstrates the number of tasks. When the data is entered, the colored bars should increasingly grow upward as time passes.
The top line of each band represents the point where a task enters one of the three stages. The bottom shows when the task left each stage. The space between the top line and bottom line reveals the number of tasks in the stage.
A healthy CFD should look like the bars are progressing parallel to each other. It indicates your team has a stable throughput where tasks are entered at the same rate as when tasks are finished.
While parallel bands are the ideal scenario, you will probably run into two other likely scenarios of a CFD:
Narrowing bands mean the lines are suddenly growing closer together. In this case, it means that your throughput is significantly higher than the number of tasks entering the workflow.
Essentially, your team is completing tasks faster than they are getting created. It means your team has room for more work, and you can move their efforts to different areas.
Widening bands mean the lines are increasingly moving away from each other. It indicates tasks are arriving faster than your team can complete them. It’s a classic bottleneck situation.
There are many different ways to solve a bottleneck problem in your project workflow. You may want to consider finishing tasks before assigning new ones to avoid further delays. You can also evaluate the tasks your team is working on and determine if they are high-priority or not. This can help move along important tasks and free up the workflow.
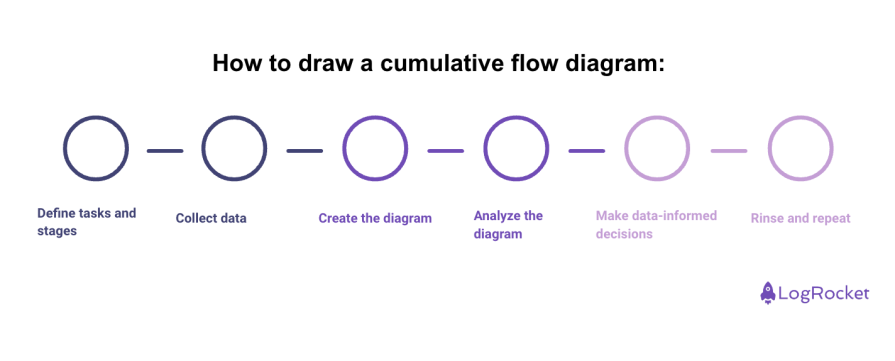
Let’s review the steps you need to take to draw a cumulative flow diagram:

Start by identifying tasks, sub-tasks, and the backlog items of your project. Then you can establish the workflow stages like to-do, doing, or done. Using a project management tool may make this process easier to handle.
Now you need to gather data related to your project. A project management tool can help you collect this information together. Otherwise, you need to determine:
You can also include any other metric you feel is important to note. However, you want to avoid overcomplicating the CFD with unnecessary details or visuals.
Once you’ve identified and collected your data, you’re ready to create the cumulative flow diagram. The exact process will vary, depending on the software.
Drawing a cumulative flow diagram with project management software is probably the most efficient way to create a CFD. It’s also possible to use Excel or Google Sheets and create a line graph, but it may take more effort.
You’ll want to ensure data accuracy when creating the CFD. For example, the completed tasks band should either rise or stay the same. It counts all of the finished items of the process. If it ever goes down, then you have a calculation error.
When you have completed a CFD, you can start looking for trends and patterns. Ideally, bands are parallel to each other, but you should look out for rapidly narrowing or widening bands as you may have a capacity or bottleneck issue occurring.
Don’t forget to also consider cycle times, throughput, and lead times as part of your analysis. They are valuable metrics that can help optimize your project workflow.
Depending on the results of the analysis, you can make informed decisions on how to handle your project workflow. It could involve reallocating resources or adjusting workflow timelines. Whatever you decide, you can be more confident it’s the right choice because you have the data to confirm it.
Cumulative flow diagrams should be continuously updated and evaluated. They keep you involved with the project workflow and correct any issues that occur.
Cumulative flow diagrams are a vital tool to maximize workflow efficiency. They’re used to identify and correct workflow issues. CFDs can also help create realistic project timelines and task prioritization. The visualization can provide insights into task completion, project workflow, and employee productivity.
Correctly using a cumulative flow diagram is crucial to optimizing the workflow process and it’s a great tool to have for your overall project management strategy.
Featured image source: IconScout

LogRocket identifies friction points in the user experience so you can make informed decisions about product and design changes that must happen to hit your goals.
With LogRocket, you can understand the scope of the issues affecting your product and prioritize the changes that need to be made. LogRocket simplifies workflows by allowing Engineering, Product, UX, and Design teams to work from the same data as you, eliminating any confusion about what needs to be done.
Get your teams on the same page — try LogRocket today.

Maryam Ashoori, VP of Product and Engineering at IBM’s Watsonx platform, talks about the messy reality of enterprise AI deployment.

A product manager’s guide to deciding when automation is enough, when AI adds value, and how to make the tradeoffs intentionally.

How AI reshaped product management in 2025 and what PMs must rethink in 2026 to stay effective in a rapidly changing product landscape.

Deepika Manglani, VP of Product at the LA Times, talks about how she’s bringing the 140-year-old institution into the future.