debug methodEditor’s note: This article was last updated on 3 November 2023 to offer an introduction to the render, screen, and container methods in the React Testing Library.

Testing your application before deploying it to production guarantees an error-free product that will function as intended. Knowing how to perform the right tests and debug your code is necessary to make you a better developer.
In this article, we’ll cover how to use the React Testing Library debug method to identify and analyze test errors. Later in the article, we’ll also explore debugging with the RTL logTestingPlaygroundURL() method. To follow along with this tutorial, you should be familiar with React and the React Testing Library. You can find the full code for this tutorial in the GitHub repository. Let’s get started!
React Testing Library, also called RTL, provides a solution for testing React components that mimics how users would interact with them. RTL’s approach avoids testing the implementation details, thereby making our test code easier to maintain.
Essentially, React Testing Library is a set of utilities used alongside a test runner like Jest or Mocha. In React Testing Library (RTL), three essential methods are often used to interact with and test React components: render, screen, and container.
The render method is used to render a React component into a testing environment. It essentially simulates rendering a component in a controlled testing environment, allowing you to perform various tests on the rendered component.
This method returns a set of queries, including screen and container, which you can use to interact with and make assertions about the rendered DOM elements:
import { render } from '@testing-library/react';

// Render a component
const { container } = render(<MyComponent />);
The screen object is a query interface provided by RTL that allows you to select DOM elements and make assertions about their presence, content, and attributes. It provides methods like getBy, findBy, queryBy, and more, which you can use to find and interact with elements in the rendered component:
import { screen } from '@testing-library/react';

// Select an element by text
const element = screen.getByText('Hello, World!');
The container property is an object that represents the root of the rendered component’s DOM structure. You can use it to access and manipulate the entire rendered DOM tree, making it useful for advanced testing scenarios where you need to interact with the component’s structure directly:
import { render } from '@testing-library/react';

// Render a component and access the container
const { container } = render(<MyComponent />);
prettyDOM(container, maxLength, options) helps format and display the DOM structure in a more readable way. It’s often used with screen.container to make the printed output more human-friendly:
import { prettyDOM } from '@testing-library/react';

const container = screen.container;
console.log(prettyDOM(container));
These methods work together to provide a powerful testing framework for React applications. You can use render to render your components, then use screen and container to query and interact with the rendered DOM.
As a refresher, Jest is both a test runner and a testing framework for JavaScript related libraries and frameworks. Therefore, we can write tests for our React application and debug the Jest tests using only Jest.
Jest offers a few different methods to debug an application and resolve problems if something goes wrong. Depending on the environment, we can troubleshoot Jest tests using either the Node.js debugger statement in Chrome Inspector or debugging in Visual Studio Code.
While the methods above might come in handy if we’re only using Jest, React Testing Library provides us with methods like debug(), logTestingPlaygroundURL(), and the logRoles function to simplify debugging tests. Let’s dive in and implement these methods!
To perform a test on a React app with RTL and identify test errors during debugging, we have to first add RTL to our application.
React projects created with the Create React App CLI come bundled with RTL, so no additional installation is required. Otherwise, we have to include RTL using npm as follows:
npm install --save-dev @testing-library/react
We can also install RTL using Yarn:
yarn add --dev @testing-library/react
In addition to RTL, we’ll include the jest-dom utility, which lets us use custom matchers like .toBeInTheDocument():
npm install --save-dev @testing-library/jest-dom
Next, let’s clone the React project that we’ll use in this tutorial:
git clone https://github.com/Ibaslogic/react-rtl-debug
Then, head to the project folder and generate the node_modules folder:
cd react-rtl-debug

npm install
# or
yarn
Finally, run the project:
npm run start
# or
yarn start
You should see the project open in the browser at port 3000. If it doesn’t open automatically, visit http://localhost:3000/ after successfully starting the dev server:

The application shows a loading message on the initial page load while retrieving and displaying the list of posts from a backend server.
If you need a refresher on creating the project, check out this article on how to fetch data in a React project. The project file structure should look similar to the following code:
 project
   ...
    ├── src
    │    ├── components
    │    │      ├── App.js
    │    │      ├── Header.js
    │    │      └── Posts.js
    │    ├── app.css
    │    ├── index.js
    │    └── setupTest.js
   ...
Now, we can begin interacting with React Testing Library.
Before we get started with the debug method, let’s explore some of the RTL facilities.
RTL provides methods that let us query the DOM nodes and make assertions about their content. In the most straightforward implementation, we’ll write a test to assert that header text reading Fetch asynchronous posts displays in the UI of our application.
In a text file called components/Header.test.js, we can add the following code:
import { render, screen } from '@testing-library/react';
import Header from './Header';

test('should display heading text', () => {
  render(<Header />);
  const headingText = screen.getByText('Fetch asynchronous posts');
  expect(headingText).toBeInTheDocument();
});
The render method from React Testing Library lets us render the React component that we want to test into the testing environment. Meanwhile, the screen object provides access to query methods like getByText() to find DOM nodes.
Then, in the test block, we assert that the text in the returned DOM node is present on the page by using the toBeInTheDocument() matcher from jest-dom.
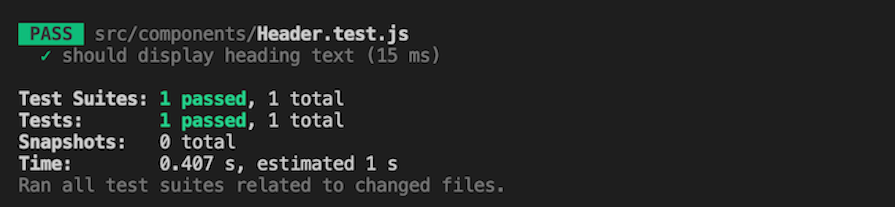
If we save the file and run the test with the npm run test command, the test should pass with the following result:
Sometimes, unknowingly, we may write a test to query a DOM element that doesn’t exist. For instance, let’s modify the text inside the query we wrote previously so that it doesn’t match a particular element:
const headingText = screen.getByText(
  'Does not exist: Fetch asynchronous posts'
);
As a result of the change above, the test will fail with the following result:
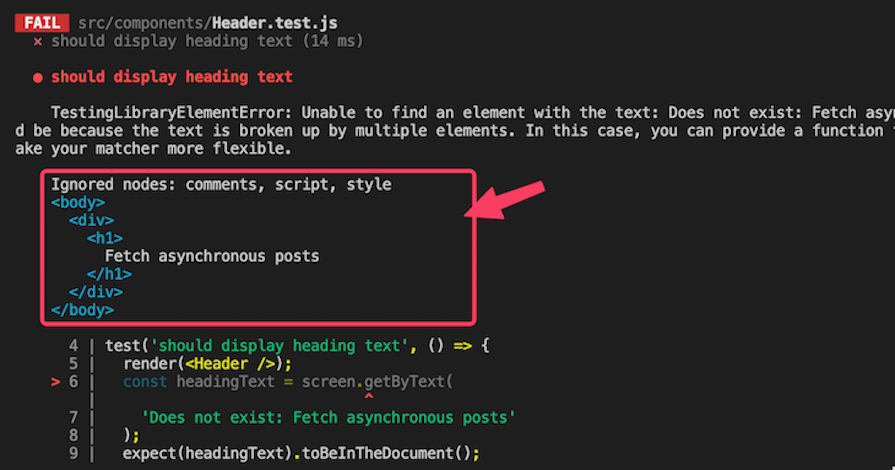
When the screen.getByText() method doesn’t find a matching DOM node, it throws a meaningful error message, as seen in the image above. This error contains the current state of the DOM, as highlighted in the image.
Thanks to this automatic logging when a failure occurs, it’s easier for us to visualize the DOM, giving us a hint as to why an assertion failed. The image above shows that the heading text doesn’t match what we provided in the test block. Now that we’ve located the bug, we can fix the text so that our test will pass.
One testing method called test-driven development (TDD) helps make development a breeze; TDD lets us write test cases based on product requirements before the product is fully developed.
screen.debug() methodReact Testing Library exposes a debug() method from the screen object to print out the state of the DOM. In addition to the automatic logging we explained above, the debug() method can also help us visualize the DOM tree before writing an assertion.
screen.debug() syntaxTake a look at the screen.debug() syntax shown below:
screen.debug(element, maxLengthToPrint, options);
The first parameter of the debug() method is the element we want the screen.debug() method to print out. This parameter can be a single element or multiple elements. If left undefined, it will default to printing the root node.
The second parameter lets us specify the content length to print. The default output length is 7000, meaning the content will be truncated after seven thousand characters. We can increase or limit the output length as needed.
We may also want to configure test formatting using the options parameter. For instance, we can turn off syntax highlighting in the terminal with the options parameter as follows:
screen.debug(undefined, null, { highlight: false });
debug() methodUsing our last test example, we’ll use the screen.debug() method to debug the document states and the heading element. First, let’s consider debugging the document states:
test('should display heading text', () => {
  render(<Header />);
  screen.debug();
  // assertion
});
Because we didn’t pass any argument to debug(), it will print the state of the DOM tree as follows:
<body>
  <div>
    <h1>
      Fetch asynchronous posts
    </h1>
  </div>
</body>
By visualizing the DOM, we can easily identify and analyze test errors, which we’ll explore later on in the article.
Next, let’s consider debugging the heading element. To log the heading element, we’ll pass the heading node to debug():
test('should display heading text', () => {
  render(<Header />);
  const headingText = screen.getByText('Fetch asynchronous posts');
  screen.debug(headingText);
  // assertion
});
Below is the output:
<h1>
  Fetch asynchronous posts
</h1>
With this output printed by the debug() method, we’re sure that the target element is present at that development stage. This will come in handy when making a proper assertion in our test.
Environment variables like DEBUG_PRINT_LIMIT and COLORS are used to control the behavior of screen.debug(). DEBUG_PRINT_LIMIT allows you to set a limit on the printed content length, and COLORS can be used to enable or disable syntax highlighting in the terminal output:
# Set a limit for printed content
DEBUG_PRINT_LIMIT=10000

# Enable syntax highlighting in the output
COLORS=true
debug()Let’s further explore the React Testing Library debug() method and see how we can use it to examine the program’s state at various development stages.
Earlier in this tutorial, we saw a loading message displayed in our application while data was being fetched from the server. As soon as the data was returned, the loading message disappeared. Now, we’ll write a test for this asynchronous operation while also debugging the test code using the debug() method.
To render the posts, we’re using the components/Posts.js component file. In the same directory, we’ll create a test file called Posts.test.js and add the following code:
import { render, screen } from '@testing-library/react';
import Posts from './Posts.js';

test('should display loading message', () => {
  render(<Posts />);
  screen.debug();
});
If we save the file, we should see the current state of the DOM:
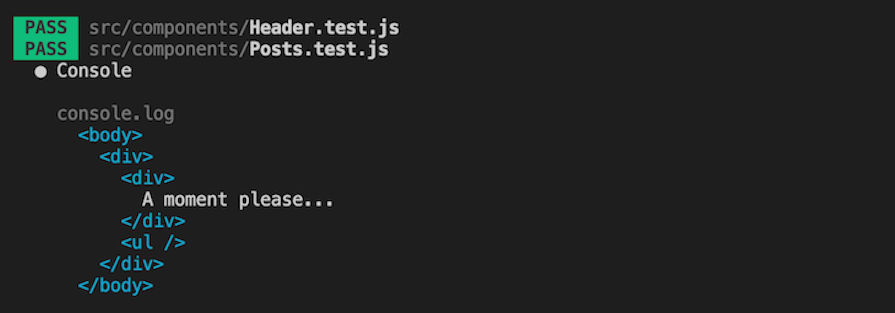
The current state in the DOM contains the loading message, which was expected. At this point, the data hasn’t arrived.
If you’re using the latest version of Axios at the time of writing, v1.2.5, you may encounter the following error:
SyntaxError: Cannot use import statement outside a module
This Jest error is due to how newer versions of Axios emit ES modules instead of CommonJS. A workaround for this is to update the test scripts in package.json to the following:
"test": "react-scripts test --transformIgnorePatterns \"node_modules/(?!axios)/\"",
Another option is to downgrade Axios to v0.27.2 using npm:
npm i [email protected]
Then, stop your test with Ctrl + C and rerun it with npm run test. You should now see the current state of the DOM tree.
Now that we know what React Testing Library is seeing, we can assert that the string A moment please… is present in the document. To do so, update the test block to the following code:
test('should display loading message', () => {
  render(<Posts />);
  // screen.debug();
  const loadingMessage = screen.getByText('A moment please...');
  expect(loadingMessage).toBeInTheDocument();
});
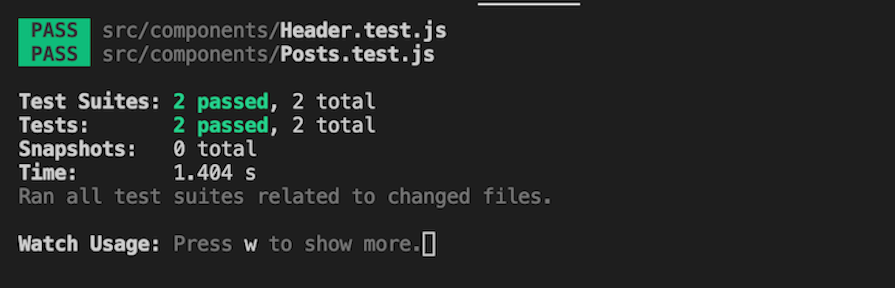
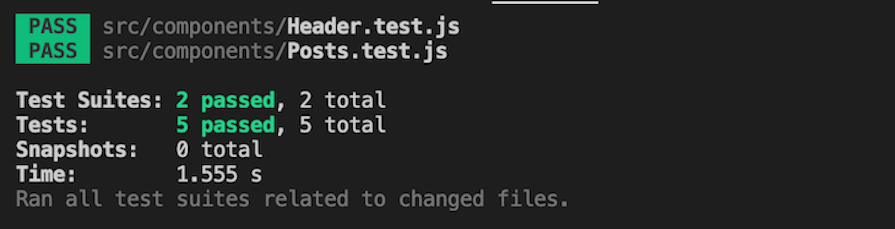
If we save the test file, the test should pass with the following result:
Let’s perform a test to ensure that our post data returns from the server and is displayed in the client. We’ll use the debug method to make the testing process easier.
Because we’re fetching the post data asynchronously, we have to set up our test to wait for the posts before it displays in the DOM. For such operations, RTL provides async methods like findBy* and waitFor. These methods return promises, so we’ll treat them as such by using the await keyword when calling them. The code below performs an asynchronous test using the findBy* async method:
test('should fetch and display asynchronous posts', async () => {
  render(<Posts />);
  screen.debug(); //post initially not present
  const postItemNode = await screen.findByText('qui est esse');
  screen.debug(); //post is present
});
findBy* returns a promise that will only resolve when an element is found or rejected for other cases. We’ve handled this returned promise with the await keyword to prevent the test from completing before the async promise settles. Doing so helps to avoid a false positive failure, which is a situation where a test passes even when the application breaks.
Notice how we strategically placed the debug() method to visualize the DOM tree before and after the post data arrives. See the output below:
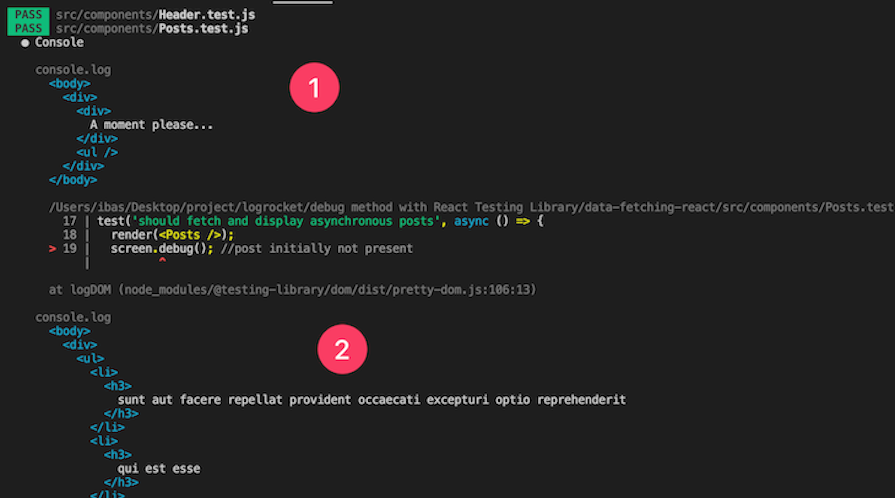
As we can see, the debug method helps simulate the app’s behavior. When the page initially loads, it prints a loading message. When the data returns, it replaces the loading message with the data.
Now that we’re sure that the post data has arrived, we can perform an assertion that a post item is present in the DOM:
test('should fetch and display asynchronous posts', async () => {
  render(<Posts />);
  const postItemNode = await screen.findByText('qui est esse');
  expect(postItemNode).toBeInTheDocument();
});
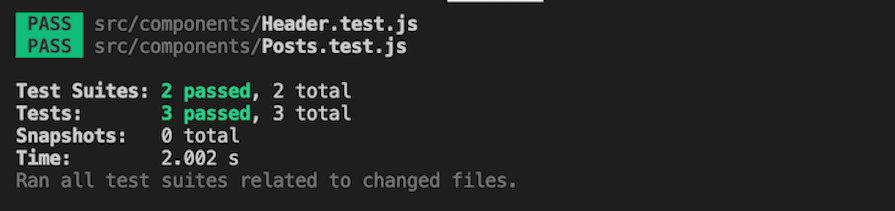
The test should pass with the following result:
In practice, when performing a test, we should avoid hitting the actual API to prevent our test from becoming slow and fragile. Instead, we should create mock data to model the API interaction. This tutorial focuses on the debug method, so we won’t cover mocking an API. However, this project’s GitHub repository implements API mocking using Mock Service Worker (MSW).
To finish up our lesson on the React Testing Library debug method, we can test that the loading message is initially present on page load and then disappears once the post data arrives. The test code looks like the following:
test('Should display loading message and disappear when posts arrive', async () => {
  render(<Posts />);
  screen.debug(); //message initially present
  await waitForElementToBeRemoved(() =>
    screen.getByText('A moment please...')
  );
  screen.debug(); //loading message not present
});
Though not the focus of this article, RTL provides the waitForElementToBeRemoved helper function to test that an element initially appears and later disappears asynchronously. It returns a promise that will resolve when the target node is removed from the DOM.
The debug() method placement lets us visualize the DOM tree before and after the loading message disappears. Below is the output:
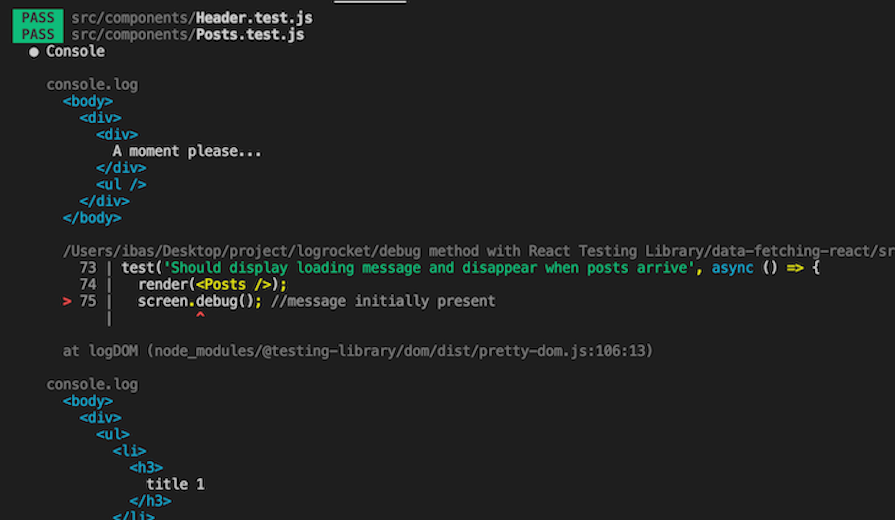
As seen in the image above, the first debug method prints the DOM tree containing the loading message, while the second debug informs us that the message is no longer present because the data has arrived from the server.
Keep in mind that we’ve implemented a mock API using MSW to intercept the network request and return a response. In this case, it returns the title 1 text seen above instead of the API post’s actual data.
Now, the test should pass with the following result:
logRoles functionLike the debug() method, logRoles can log an element’s ARIA role or a list of roles applied to elements within the DOM tree. This process can help make testing easier, as we’ll see in a moment.
In this tutorial, we used the getByText and findByText query methods to find elements on the page. While this works, RTL places *ByRole counterparts at the top of the priority list.
To use *ByRole queries, we must be familiar with the implicit roles placed on HTML elements. When dealing with non-semantic elements, we can manually provide a role attribute. A semantic element like <button> has an implicit role of button. Feel free to check out the list of ARIA roles that apply to HTML elements.
With the logRoles function, we can easily log the element’s implicit ARIA roles for use in our accessibility test. If we revisit our previous test using findByText, we can apply the helper function to our test code like so:
import {
  // ...
  logRoles,
} from '@testing-library/react';
// ...
test('should view implicit roles with logRoles', async () => {
  render(<Posts />);
  const postItemNode = await screen.findByText('title 1');
  logRoles(postItemNode);
  expect(postItemNode).toBeInTheDocument();
});
In the code above, we started by importing logRoles from the testing library. Then, we passed the target node as an argument to the function. The output will give us the ARIA role of that element:
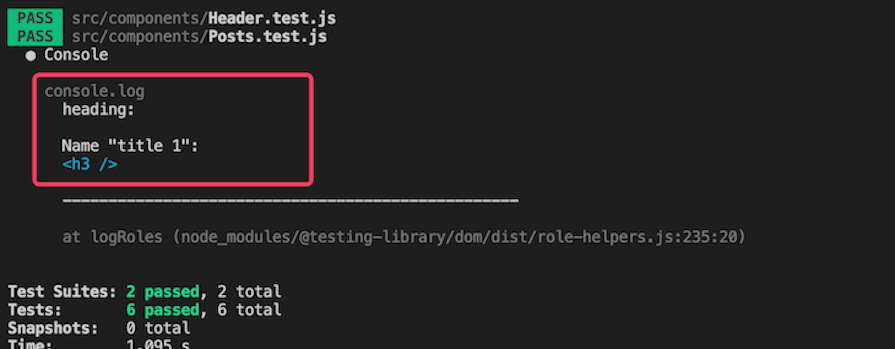
As seen in the image above, the ARIA role is heading. We can refactor the test code to use the findByRole accessible query instead of findByText, so we have the following:
test('should view implicit roles with logRoles', async () => {
  render(<Posts />);
  const postItemNode = await screen.findByRole('heading', {
    name: 'title 1',
  });
  expect(postItemNode).toBeInTheDocument();
});
To guarantee that our UI is accessible, we should consider using *ByRole before the other query types.
To print a list of ARIA roles applied to elements within the DOM tree, we can pass the rendered container element to logRoles as an argument. The code will look like the following:
test('should view implicit roles with logRoles', async () => {
  const view = render(<Posts />);
  const postItemNode = await screen.findByRole('heading', {
    name: 'title 1',
  });
  logRoles(view.container);
  expect(postItemNode).toBeInTheDocument();
});
The output will now look like the image below:
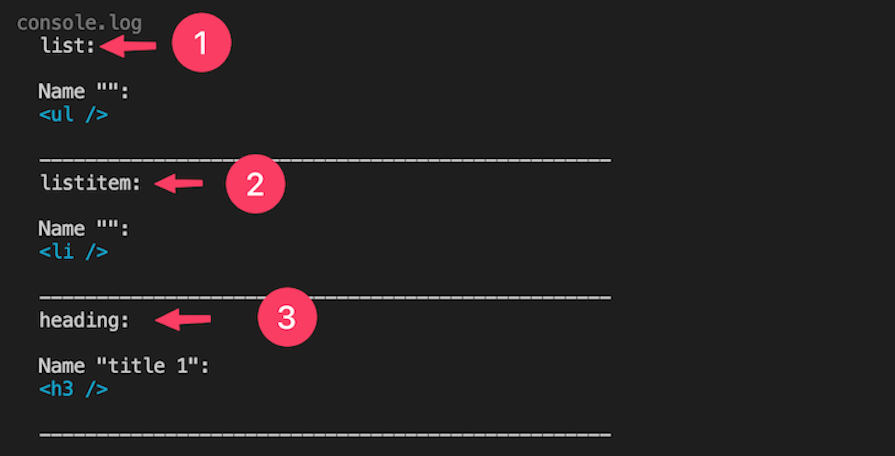
The output, as seen above, contains the DOM elements and their respective ARIA roles. We can target these elements by their implicit roles. For instance, if we want to assert that a li item is visible in the DOM, we can write the following test:
test('should list item visible in the DOM', async () => {
  render(<Posts />);
  const postItemNode = await screen.findByRole('listitem');
  expect(postItemNode).toBeVisible();
});
logTestingPlaygroundURL() methodThe screen object also exposes the logTestingPlaygroundURL() method, which further simplifies debugging tests. When we use this method in our test code, RTL returns a link in the editor terminal pointing to a testing playground.
If you know how the testing playground works, we can paste the DOM tree that we printed using the debug() method to find the best queries to target elements. For instance, let’s revisit our first example test. As we learned, using the debug() method will print the DOM tree:
test('should display heading text', () => {
  render(<Header />);
  screen.debug();
});
Once printed, the DOM tree should look like the following:
<div>
  <h1>
    Fetch asynchronous posts
  </h1>
</div>
Remember, in the example, we targeted the heading node and made assertions using the screen.getByText() method as follows:
test('should display heading text', () => {
  render(<Header />);
  const headingText = screen.getByText('Fetch asynchronous posts');
  expect(headingText).toBeInTheDocument();
});
While this works, as we mentioned in the logRoles section, we should consider using accessible queries before other query types. For beginners who aren’t sure of the most appropriate query methods to use, the playground can help.
If we copy the DOM elements into the testing playground (label 1), we can select the element in the view, (label 2). Then, we’ll see a suggested query, label 3, which we can copy into our test:
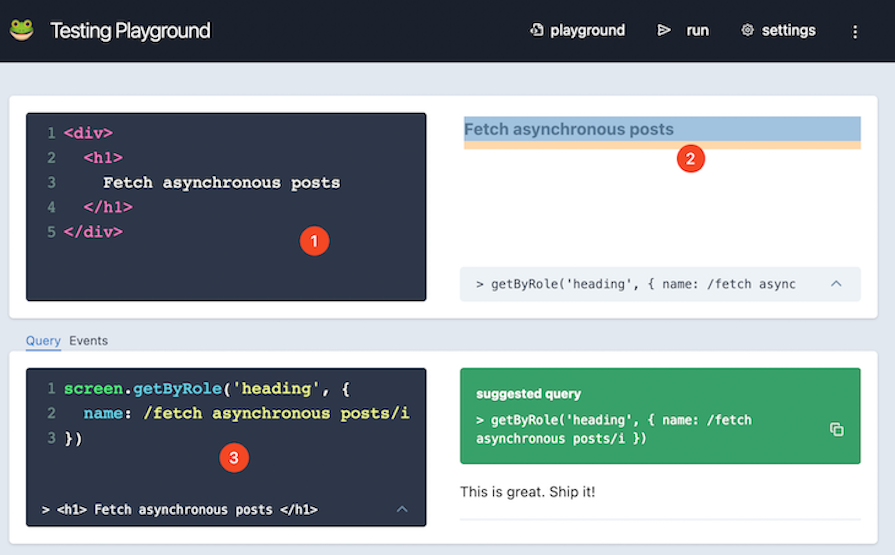
Now, with this query, a more accessible test will look like the following code:
test('should display heading text', () => {
  render(<Header />);
  const headingText = screen.getByRole('heading', {
    name: /fetch asynchronous posts/i,
  });
  expect(headingText).toBeInTheDocument();
});
With this playground in mind, let’s use screen.logTestingPlaygroundURL() in the test block as follows:
test('should display heading text', () => {
  render(<Header />);
  screen.logTestingPlaygroundURL();
});
Then, RTL will generate a link to the playground after we run the test:
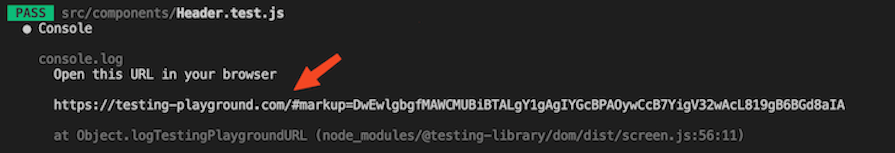
If we visit the link, we’ll get the equivalent of the playground UI shown above. Therefore, we don’t have to use the debug() method to print and copy the DOM tree into the playground. Instead, it automatically gets added.
Without the debug() method, viewing the playground via the screen.logTestingPlaygroundURL() method lets us see at a glance what elements are visible to the user. It also suggests the most suitable query methods to target the elements.
Testing can be cumbersome if you’re just getting started with it. However, the ability to debug can make this process a breeze.
In this article, we discussed how to use the debug() method from React Testing Library to identify and analyze test errors. We also learned how to use the logTestingPlaygroundURL() method to further ease the debugging process. If you enjoyed this lesson, be sure to leave a comment. Happy coding!
Install LogRocket via npm or script tag. LogRocket.init() must be called client-side, not
server-side
$ npm i --save logrocket

// Code:

import LogRocket from 'logrocket';
LogRocket.init('app/id');
// Add to your HTML:

<script src="https://cdn.lr-ingest.com/LogRocket.min.js"></script>
<script>window.LogRocket && window.LogRocket.init('app/id');</script>

Explore 15 essential MCP servers for web developers to enhance AI workflows with tools, data, and automation.

Learn how contrast-color() automatically picks accessible text colors using native CSS, without JavaScript.

Learn how to build a harness-style AI workflow using Claude Code with specialized Dev, QE, and Ops subagents, gated handoffs, MCP telemetry, and LEARNING.md.

Learn how to build smooth staggered animations in CSS using modern features like sibling-index(), complete with practical examples, fallbacks, and accessibility tips.
Would you be interested in joining LogRocket's developer community?
Join LogRocket’s Content Advisory Board. You’ll help inform the type of content we create and get access to exclusive meetups, social accreditation, and swag.
Sign up now