Editor’s note: This article was last updated 23 May 2023 to include an example of debugging Node.js code with watchers in addition to using Chrome DevTools.
When developing software, debugging is one of the most important steps. Not only does code testing ensure stability, but it also guarantees quality code and a better user experience. Typically, developers use console.log statements within their codebase to inspect issues. For example, consider the following JavaScript code:
console.log("This code will be printed in the console");
const i = 10;
console.log("The value of i is", i);
The code above will produce the following output:
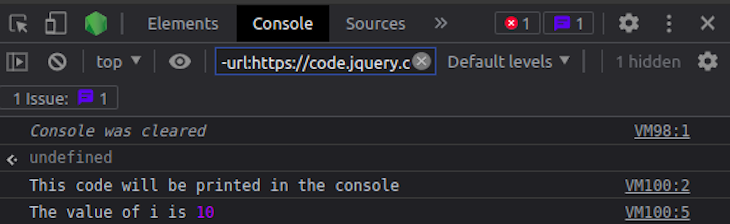
Although this is a valid way to test, there are a few issues. For one, you can’t check the app’s memory usage; tracking RAM usage is essential when it comes to optimizing performance. Additionally, there are no breakpoints, meaning you have no way to track the values of the variables during runtime.
As a workaround, you might use console.log statements, however, this could be problematic for large projects because you have to inspect many pages of logging statements:
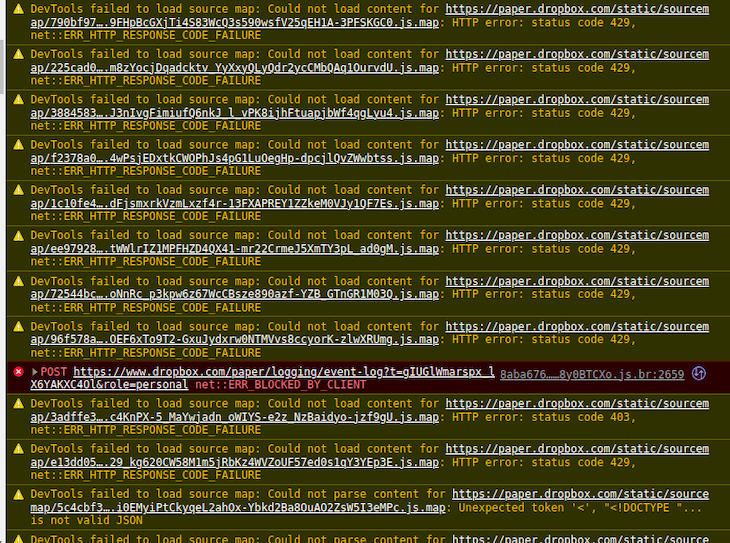
In this article, we’ll explore two different debugging methods that prevent this problem, using the GUI and CLI, respectively. First, we’ll learn how to debug a Node.js app using Chrome’s built-in Developer Tools. As an alternative, we’ll consider using the built-in Node.js debugger keyword with watchers. Let’s get started!
Jump ahead:
First, initialize a blank console project using the following terminal commands:
mkdir debugger-tools #create project directory
cd debugger-tools
npm init -y #initialize project.
touch index.js #create a file called index.js
To showcase debugger functionality, we’ll build a basic Express server. To do so, install the express module as follows:
npm install express
Chrome Developer Tools is helpful for programmers to test their web apps and debug Node.js console projects with minimal effort. Chrome DevTools supports the following features:
Now, we’ll learn how to debug our project by getting started with the Chrome DevTools menu. First, navigate to index.js and write the following code:
//file: index.js
const express = require("express");
const app = express();
const port = 3000;
app.get("/", async (req, res) => { //when the user is on the home directory,
  console.log("User is on home page"); //log out this message to the console
  res.send("Hello World!"); //send response to client to prevent timeout errors
});
app.listen(port, () => { //run the server
  console.log(`Example app listening on port ${port}`);
});
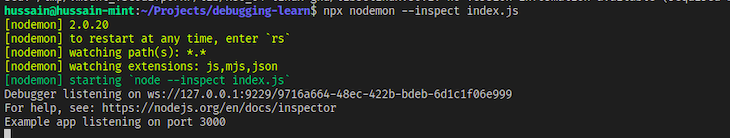
Next, we have to run the debugger:
npx nodemon --inspect index.js
The code above tells the compiler to attach a debugger daemon so we can inspect our program using Chrome DevTools:
Now that the daemon is running, open the debugger. In an empty browser window, right click and click Inspect to open Chrome Developer Tools. Then, click the green Node.js icon, which will tell the browser to launch the Node.js debugger:
Now, let’s test our code! Go to localhost:3000:
Every time the user refreshes the page, we get console logs in the DevTools Console view, indicating that Node.js has successfully attached a debugger to our program.
The breakpoints feature is arguably the most important feature in the debugger toolset. As the name suggests, a breakpoint pauses code execution whenever it reaches a certain point, which can be useful in the following situations:
The following code will help us to better understand debuggers:
let count = 0; //initialize a count variable.
app.get("/", async (req, res) => {
  console.log("User is on home page");
  count++; //when the user visits this page, increment the count variable
  console.log("User visit count", count); //log out its value
  res.send("Hello World!");
});
To enable breakpoints, select Sources in the DevTools window. Then, double-click the line where you want the breakpoint; in our case, it is line 9. This tells the debugger that we want the breakpoint to track the value of the count variable:
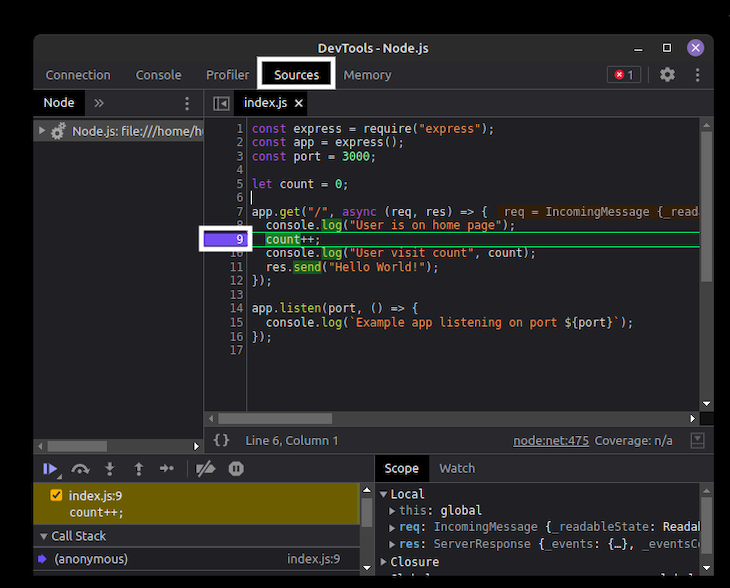
When we run the code, we can see that the debugger pauses code execution every time it reaches line 9:
Thanks to the debugger service, we can now track the value of count during the program’s runtime.
debugger keywordWhen we don’t want to manually activate breakpoints through the GUI, we can also use the built-in debugger keyword in our code as follows:
const count = 0;
const myArray = []; //create an empty array
app.get("/", async (req, res) => {
  console.log("User is on home page");
  count++;
  myArray.push(count); //push element into this array
  debugger; //activate a breakpoint.
  //All of the variables before this line will be tracked
  console.log("User visit count", count);
  res.send("Hello World!");
});
Below is the output of the program:
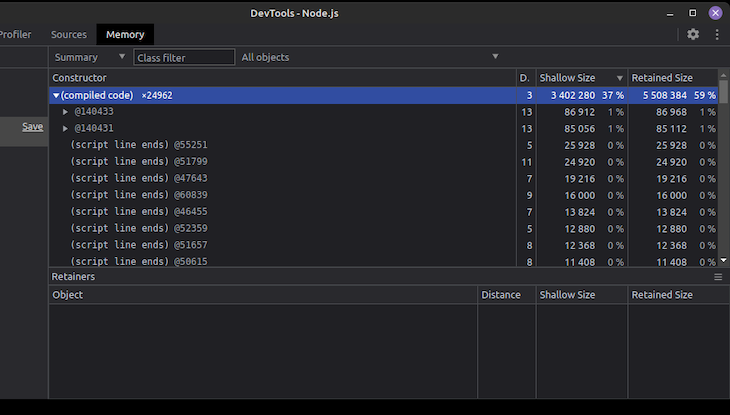
Memory profilers help developers track their app’s memory usage, which is useful for finding memory leaks and optimizing performance. To use a memory profiler, go to Memory, make sure Heap Snapshot is selected, scroll down, and click Record:
In this option, you can see how much memory your program consumes in total. Additionally, expanding each option can provide deeper insight into how much memory your code is using. As a result, you can monitor the project for memory leaks:
debugger keyword with watchersIf you prefer to debug in the CLI, you can monitor variables using watchers in the terminal the same way you can step through code and monitor variables using Chrome DevTools. A watcher allows you to monitor the value of a specific variable or expression while the program is being executed. You can set up a watcher for a variable or expression of interest, and the debugger will display the current value of that variable or expression at various points during the program’s execution.
We’ll use the built-in watch() function with a string argument that contains the variable name. This feature is helpful for tracking changes in variable values and understanding how they evolve during runtime. To demonstrate, create a file called index.js and add the following code to it:
let count = 0;

for (let i = 1; i <= 10; i++) {
  if (i % 2 !== 0) {
    count++;
  }
  debugger;
}
Open a terminal or command prompt and navigate to the directory where the index.js file is located. Start the Node.js debugger by running the following command:
node inspect index.js
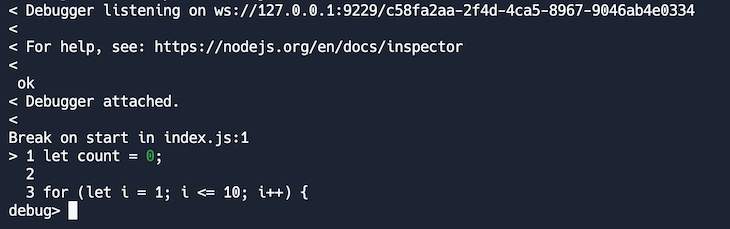
The debugger will pause the execution at the first line of code. To set a watcher for the count variable, type the following command in the debugger prompt:
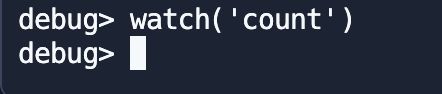
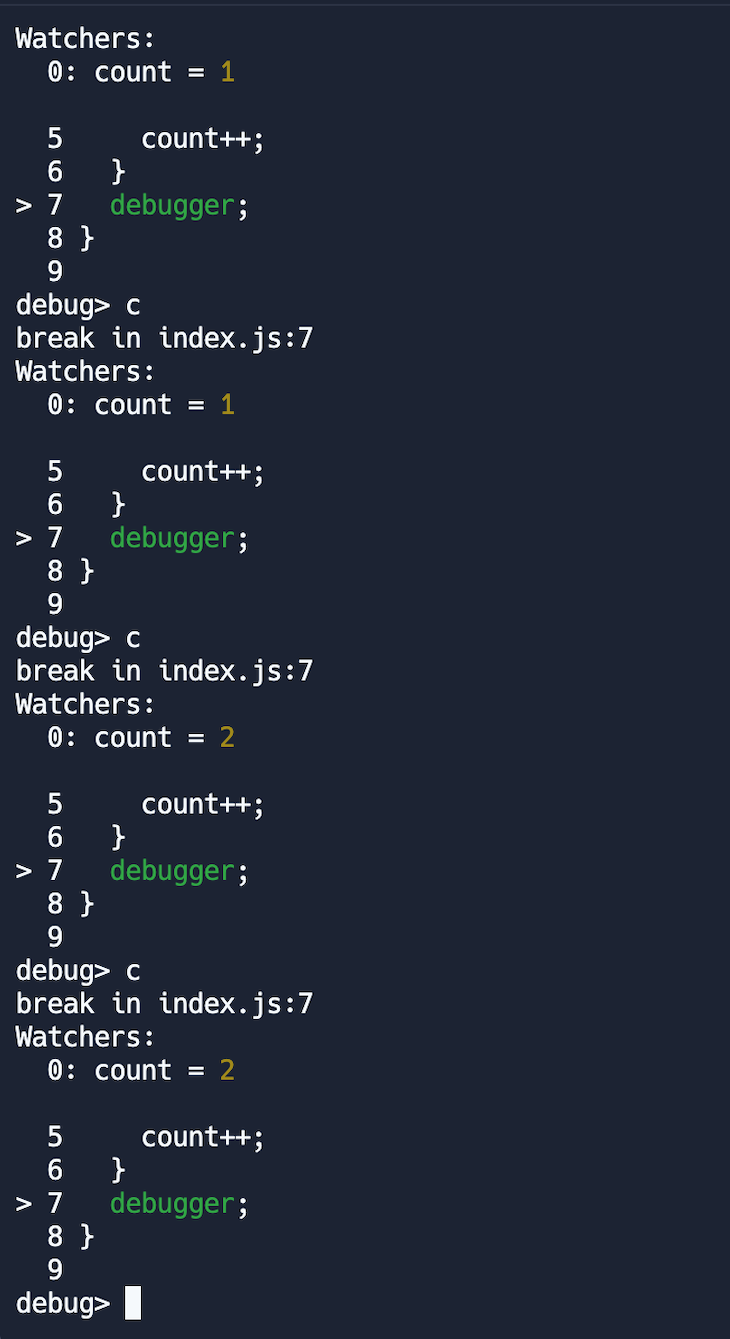
Now, you can continue the execution of the code by typing c and pressing Enter. The debugger will proceed through the loop, and at each iteration when it encounters the debugger keyword, it will display the current value of count as a watcher:
Alternately, if you want to monitor the code execution line by line, you can also use the letter n to move to the next line of code:
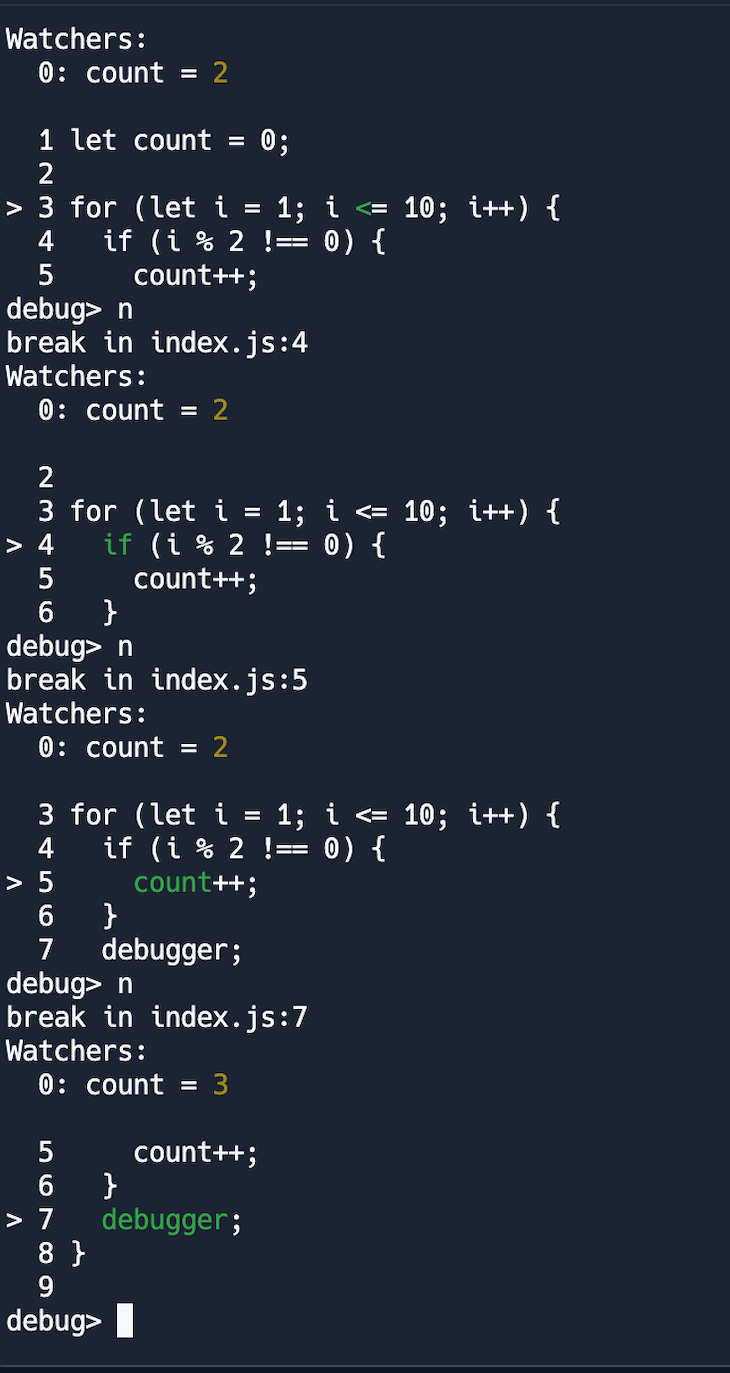
You can inspect the value of count at each iteration by looking at the output in the debugger console, allowing you to easily debug your code.
In addition to debugging Node.js applications using the built-in Node.js debugger and watchers, Google Chrome DevTools is one of the most crucial pieces of software used during app development. Not only does it help programmers squash bugs, but it also helps them enhance their app’s user experience, ultimately leading to happier users. Thanks for reading, and be sure to leave a comment if you have any questions. Happy coding!
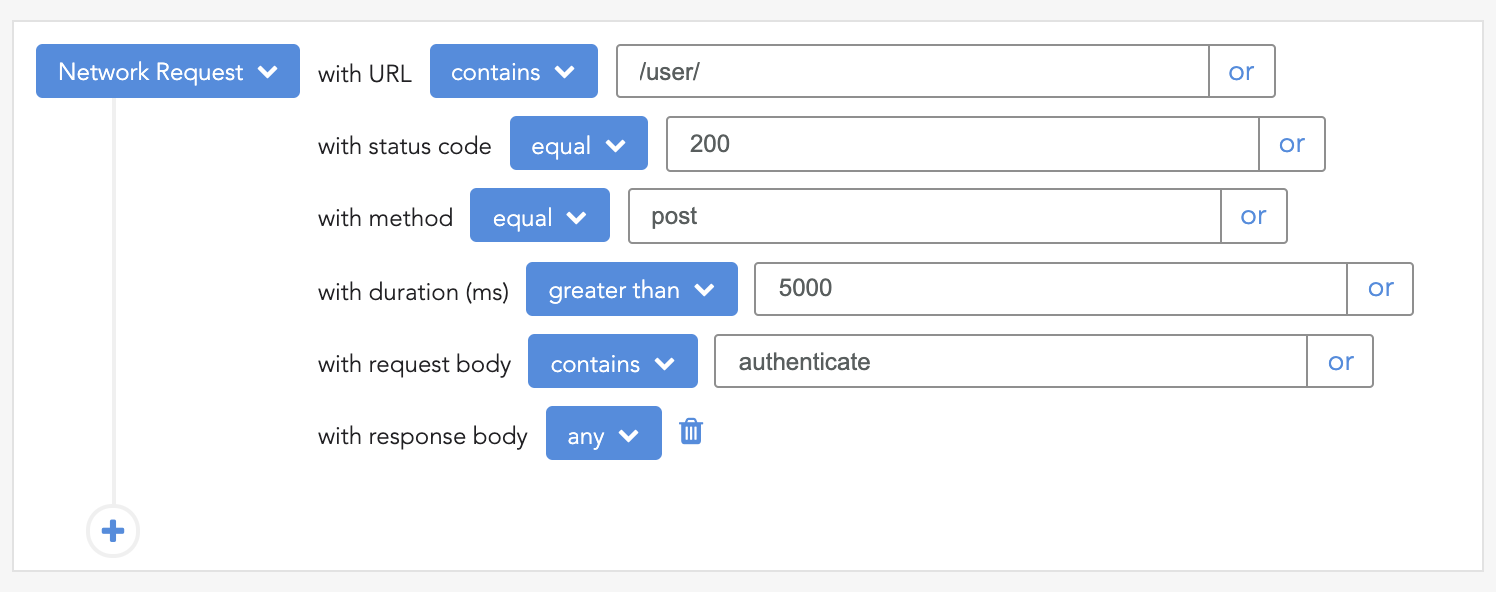
 Monitor failed and slow network requests in production
Deploying a Node-based web app or website is the easy part. Making sure your Node instance continues to serve resources to your app is where things get tougher. If you’re interested in ensuring requests to the backend or third-party services are successful, try LogRocket.
LogRocket lets you replay user sessions, eliminating guesswork around why bugs happen by showing exactly what users experienced. It captures console logs, errors, network requests, and pixel-perfect DOM recordings — compatible with all frameworks.
LogRocket's Galileo AI watches sessions for you, instantly identifying and explaining user struggles with automated monitoring of your entire product experience.
LogRocket instruments your app to record baseline performance timings such as page load time, time to first byte, slow network requests, and also logs Redux, NgRx, and Vuex actions/state. Start monitoring for free.
Learn how to protect full-stack projects from NPM supply chain attacks with a practical security checklist.
Explore 15 essential MCP servers for web developers to enhance AI workflows with tools, data, and automation.
Learn how contrast-color() automatically picks accessible text colors using native CSS, without JavaScript.

Learn how to build a harness-style AI workflow using Claude Code with specialized Dev, QE, and Ops subagents, gated handoffs, MCP telemetry, and LEARNING.md.
Would you be interested in joining LogRocket's developer community?
Join LogRocket’s Content Advisory Board. You’ll help inform the type of content we create and get access to exclusive meetups, social accreditation, and swag.
Sign up now
