A prioritization matrix is a simple yet powerful tool that helps teams streamline decision-making, align goals, and keep projects on track. It works by ranking tasks based on key factors like urgency, impact, and effort — ensuring that teams stay focused on what truly matters instead of getting bogged down by an endless to-do list. By applying this framework, teams can allocate resources more effectively and consistently deliver high-impact work.

Editor’s note: This article was updated on 25 March, 2025, to expand on prioritization frameworks, including Eisenhower, MoSCoW, RICE, and WSJF. We’ve also added images, a comparison table of different prioritization methods, and a downloadable prioritization matrix + worksheet template.
Download the prioritization matrix template
Product managers constantly juggle competing priorities, and without a clear framework, it’s easy for teams to invest time and resources in the wrong initiatives. That’s where a prioritization matrix comes in handy. It helps teams:
With the right framework in place, teams can confidently tackle what matters most, avoiding the trap of endless debates and scattered focus.
A prioritization matrix is a framework that provides visual insight into which tasks should be completed first. It enables teams to compare and rank tasks or initiatives based on chosen criteria.
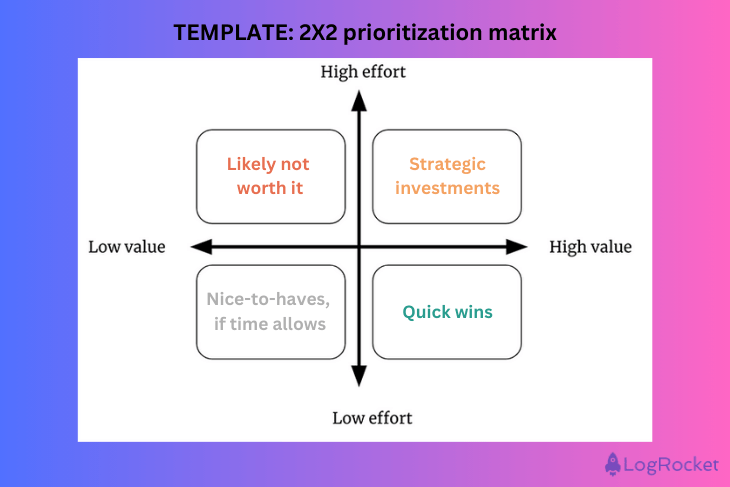
The most common type of prioritization matrix is a 2×2 framework where the two axes represent different factors, such as effort and impact or cost and benefit:
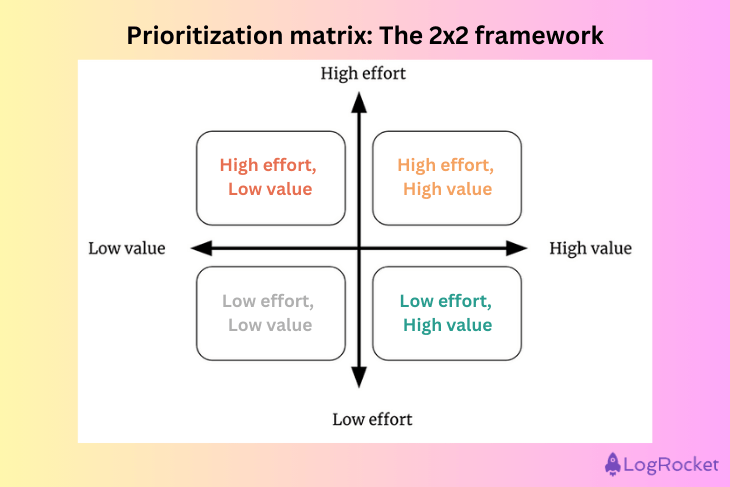
Each task or initiative is plotted on the matrix, which helps visualize its relative ranking compared to the others. You can use logic and your team’s bandwidth to figure out the action item for each quadrant:
| HIGH IMPACT | LOW IMPACT |
| Low effort — Quick wins (prioritize these) | Low effort — Fill-in tasks (do these when time allows) |
| High effort — Strategic investments (worth the effort) | High effort — Time wasters (avoid or eliminate) |
Let’s go through examples in the matrix above:
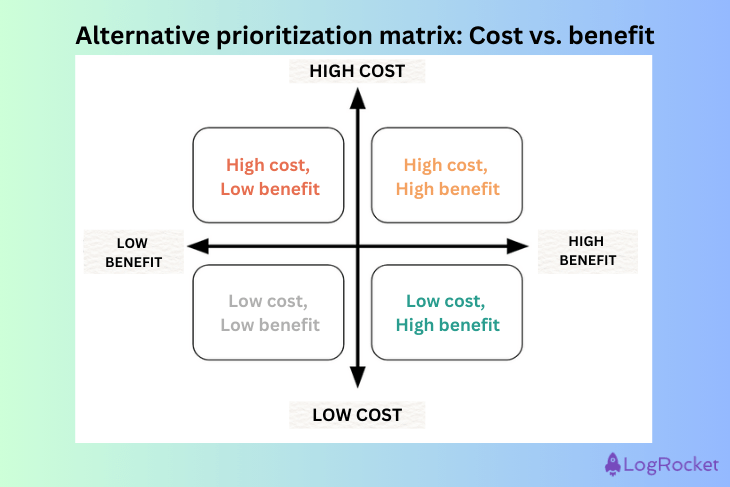
A different approach is to weigh the costs against the benefits. The rules for each quadrant shift accordingly:
| HIGH BENEFIT | LOW BENEFIT |
| Low cost — No-brainer tasks (Prioritize) | Low cost — Optional tasks (Consider) |
| High cost — Big bets (Evaluate carefully) | High cost — Wasteful tasks (Avoid) |
On the graph, this would look like this:
The 2×2 matrix is a solid go-to, but there are many different prioritization frameworks for PMs to choose from. I’ll talk about them next and compare them in a table:
This classic “urgent vs. important” framework helps teams separate what needs immediate action from what can wait (or be scrapped altogether). The Eisenhower matrix sorts tasks into four quadrants:
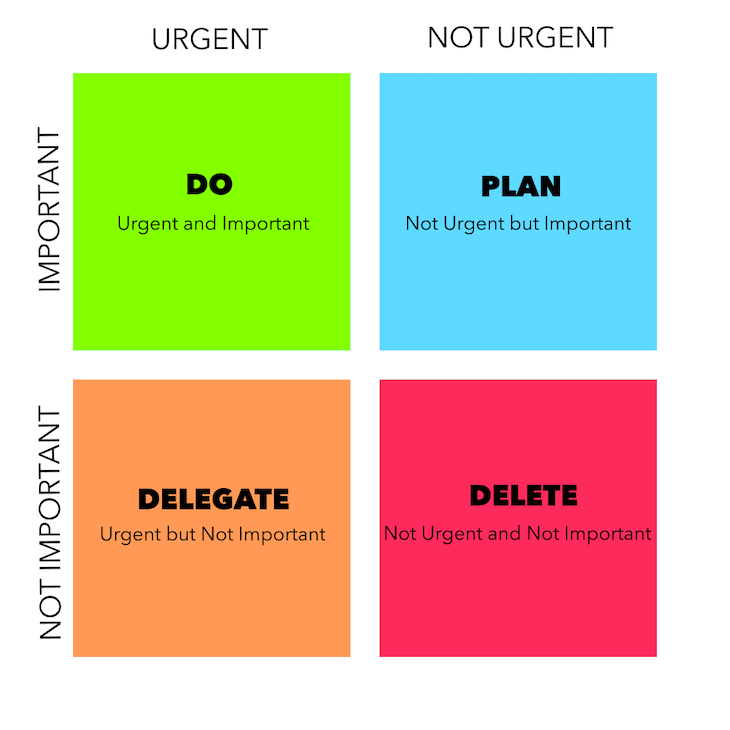
This framework works best when your backlog feels overwhelming and you need to quickly distinguish between “must-do” and “can-wait” tasks. Here’s an Eisenhower matrix template to get you started right away.
This one’s a staple when it comes to prioritization frameworks, but it’s often overlooked. It helps teams categorize features and initiatives into:
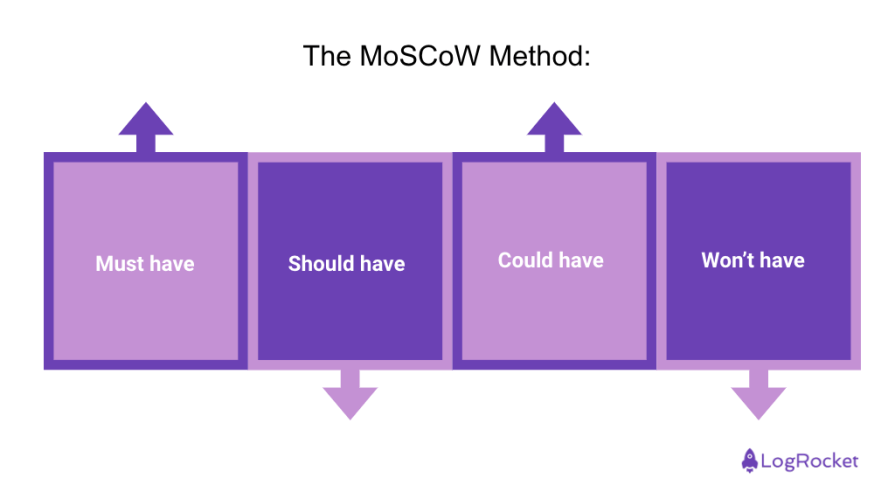
MoSCoW is great when you’re managing expectations with stakeholders because it clearly defines what will — and what won’t — get done in a given timeframe. If competitors are using it, you should, too.
This one’s perfect for product teams who love numbers. RICE provides a scoring formula based on:
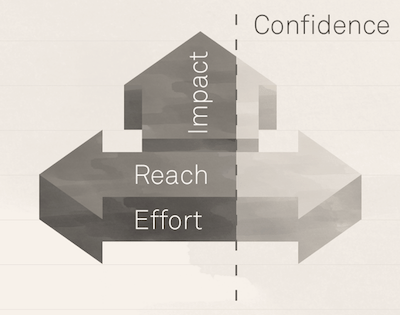
For example, if you’re debating between two new features, one that benefits 10,000 users but takes two months to build and another that helps 1,000 users but can be delivered in a week, RICE gives you a clear score to compare them. This method helps ensure that resources are allocated to the highest-impact initiatives.
WSJF (Weighted Shortest Job First) is a go-to for Agile teams juggling multiple priorities. It ranks tasks based on:
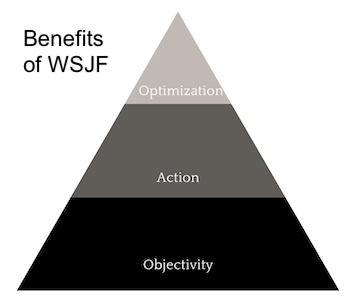
The goal is to work on the high-value, low-effort tasks first to deliver quick wins while ensuring long-term strategic goals aren’t neglected. For example, if a feature significantly improves user retention and only takes a few days to build, WSJF ensures it jumps to the top of the queue.
Each of these frameworks has its strengths — choosing the right one depends on your product, team structure, and decision-making style. Here, I compare them for you:
| Framework | Best for | Key considerations | Example use cases |
| Eisenhower matrix | Time-sensitive decisions | Balances urgency and importance | A SaaS product manager prioritizes fixing a critical bug over a routine check-in |
| MoSCoW method | Feature prioritization in Agile | Categorizes tasks into must-have, should-have, could-have, and won’t-have | Used in sprints to prioritize checkout flow over optional UI animations |
| RICE scoring | Data-driven decision-making | Evaluates based on reach, impact, confidence, and effort | A feature with high reach and low effort is prioritized over one with limited reach and high effort |
| WSJF (Weighted Shortest Job First) | Balancing business value and urgency | Considers business value, time criticality, risk reduction, and job size | A fintech company prioritizes compliance updates over UI tweaks to meet regulatory deadlines |
When everything feels like a priority, making clear, strategic decisions can be tough. This downloadable 2X2 prioritization matrix and accompanying worksheet are designed to help you evaluate tasks based on effort and impact:
Together, these tools will help you identify quick wins, tackle high-impact initiatives, and avoid getting stuck in low-value work. Follow the step-by-step instructions below and start optimizing your workflow today!
Let’s walk through how to create a 2×2 prioritization matrix to measure value vs. effort.
While other factors like cost, time, resources, and stakeholder buy-in can be used, effort vs. value is the most common for product teams, so we’ll use it in this example.
Decide which factors you want to evaluate — effort vs. value is common, but you can also consider cost vs. benefit, risk vs. impact, or other dimensions relevant to your team.
Create a 2×2 matrix with four quadrants:
Here’s a blank example:
Use a collaborative whiteboard tool like Miro, FigJam, or Canva Whiteboard. You could start by brainstorming and listing all relevant backlog items, features, or tasks that need evaluation. Write each task on a sticky note, making sure descriptions are clear and specific to avoid confusion.
Have team members individually assess each task based on estimated value and effort, using predefined criteria. Then, facilitate a structured group discussion to place each task on the matrix. Encourage team members to voice their reasoning and work toward a consensus when discrepancies arise.
Adjust placement as necessary to ensure tasks accurately reflect the agreed-upon prioritization.
Engage with stakeholders to review task placement on the matrix. Assess whether current rankings align with overarching business goals and the latest resource availability.
If necessary, make adjustments to ensure the prioritization remains strategically sound and reflects evolving company objectives.
Determine the next steps for each quadrant by strategically assigning resources and focus and implementing the action plan.
Start by tackling high-value, low-effort tasks, as these provide immediate impact with minimal investment. These quick wins help build momentum and demonstrate progress.
Next, allocate resources wisely for high-value, high-effort tasks, ensuring that teams have the time, budget, and support needed to execute them successfully.
For low-value, low-effort tasks, consider deprioritizing or scheduling them for later. Low-value, high-effort tasks should be reevaluated or eliminated to avoid unnecessary resource drain.
A prioritization matrix is not a one-time exercise. Product managers should revisit it at least monthly to adjust for shifting priorities, stakeholder input, and evolving customer needs:
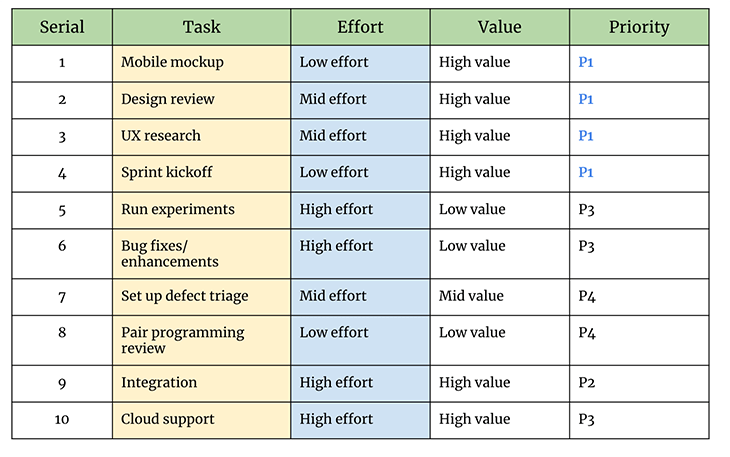
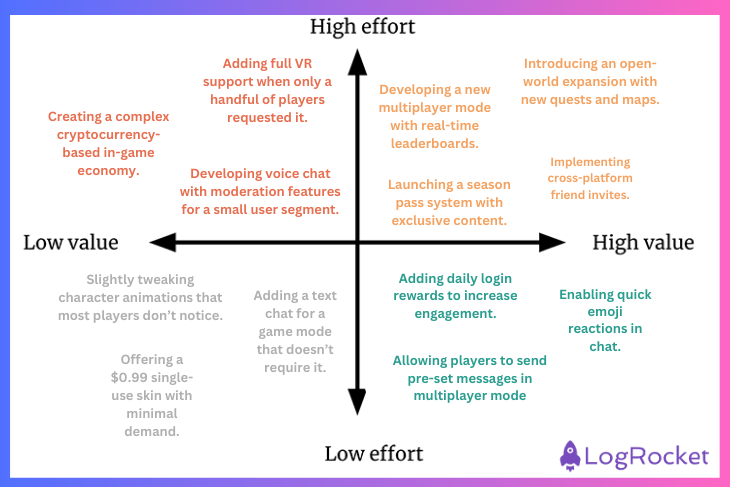
Imagine a company developing a mobile gaming app. The product team needs to determine which features and tasks to prioritize to ensure an engaging user experience while optimizing development efforts.
The team first evaluates each feature based on two key factors:
Once the team assigns a value and effort score to each task, they plot them on a 2×2 prioritization matrix. The visual approach allows for a clear understanding of what to tackle first.
Before finalizing priorities, the team engages in a collaborative discussion to validate their assumptions. By re-examining the estimated value and effort of each task, they ensure alignment with user needs, technical feasibility, and business objectives.
Beyond just prioritizing individual tasks, teams can use user story mapping to define the minimum viable product (MVP) experience. This approach helps teams:
For instance, in the case of a gaming app, the team might categorize potential features under different product capabilities, such as core gameplay mechanics, social interactions, and monetization strategies:
Even with the best intentions, product teams can make critical mistakes that reduce the effectiveness of a prioritization matrix. Here are the most common pitfalls — and how to avoid them:
What is a prioritization matrix used for?
A prioritization matrix is a simple way to figure out what to work on first. Instead of guessing, you rank tasks based on stuff like effort, impact, and urgency, so you’re not wasting time on things that don’t matter.
How do you create a prioritization matrix?
Which prioritization matrix is best for product managers?
It depends on what you need! Some good ones:
What are common mistakes when using prioritization matrices?
Prioritizing your product roadmap isn’t about making a perfect list — it’s about making smart trade-offs that push your product forward. Whether you’re improving gameplay, adding social features, or tweaking monetization, a solid framework (like the 2×2 prioritization matrix) keeps things clear and focused.
To make things even easier, I’ve put together a downloadable prioritization matrix + worksheet template that you can use with your team. It’ll help you map out priorities, compare trade-offs, and keep your roadmap on track. Grab your copy and start making prioritization a breeze!

LogRocket identifies friction points in the user experience so you can make informed decisions about product and design changes that must happen to hit your goals.
With LogRocket, you can understand the scope of the issues affecting your product and prioritize the changes that need to be made. LogRocket simplifies workflows by allowing Engineering, Product, UX, and Design teams to work from the same data as you, eliminating any confusion about what needs to be done.
Get your teams on the same page — try LogRocket today.
Red-teaming reveals how AI fails at scale. Learn to embed adversarial testing into your sprints before your product becomes a headline.

Cory Bishop talks about the role of human-centered design and empathy in Bubble’s no-code AI development product.

Learn how to reduce mobile friction, boost UX, and drive engagement with practical, data-driven strategies for product managers.

Jim Naylor shares he views documentation as a company’s IP and how his teams should use it as a source of truth.


