As a product manager, you need to be able to adapt and prioritize tasks on a moment’s notice. This has become even more important with the rise of agile. The good news is that you can implement prioritization methods within your product roadmaps to help streamline and simplify the process.

This article takes you through two of the most popular methods: MoSCoW and RICE. Keep reading to learn how to use both of them, how to overcome obstacles they may present, and understand how they differ from one another.
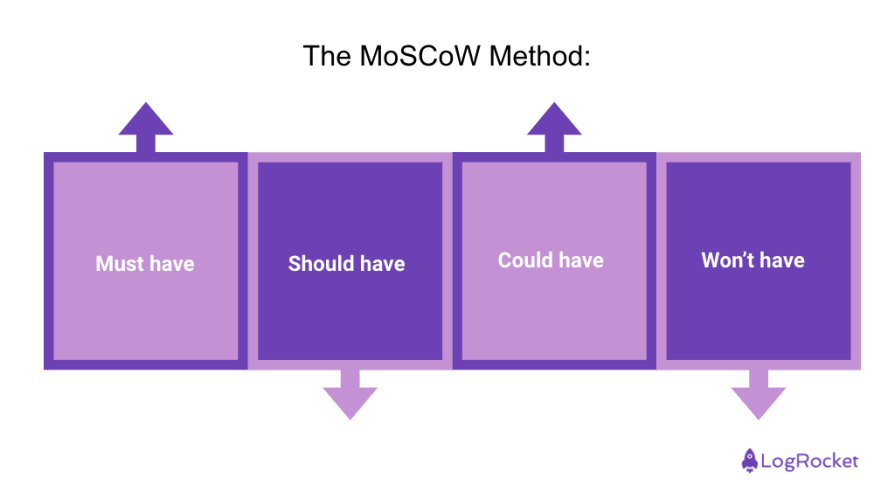
Dai Clegg created the MoSCoW method in the early 2000s while working at Oracle to prioritize issues according to their time criticality. Its name comes from an acronym that stands for “must have, should have, could have, and won’t have.” Sometimes people also use the “W” as “wish for.”
You can start using the method to differentiate your stories according to their impact and importance. Top priorities stay in the first phases on your MVP. Blocker or multi-team requirements can disrupt your deadlines, so keep them on your mind.
To help you understand the method, let’s take a look at each of the categories:

Must have stories represent critical or blocker requirements that affect a product’s deadline. These are your top priorities. To determine if a story is a must have, ask the following:
Must have features might include a login system, payment security systems, or GDPR requirements.
Should have stories are still important for the product or customer but won’t drag you into failure. These are time sensitive and you need to assign them in the correct phase.
Common should have stories include additional capabilities like design improvements, new functionalities, minor bugs, and performance upgrades. You can decide if a story is a should-have or not by asking, “If the story doesn’t go live in this phase, will the product cover customer needs?”
Could have stories are the ones you can do if you have enough time and resources. Think of adding these when a considerable amount of customers request them but remember that you won’t be able to focus on them very often.
Save these for after you already take care of your must and should have stories.
Won’t have or wish stories are ones you won’t get to because of time limitations. Oftentimes PMs will leave stories in this phase until their importance increases. If not, you can also send them directly into the archive of the product backlog and remove them from the product launch plan all together.
While differentiating the stories as must or not, you also want to decide whether to add them into the launch plan or not. If you label the wrong stories as unnecessary you may impact your whole product launch and drag the product into failure.
Improper characterization can also happen when you add too many stories into the must have category. When you do this it becomes impossible to hit your deadlines. You want to aim for an even split between all the categories.
When it comes to the won’t have category the name can be somewhat misleading. These aren’t necessarily bad stories, you just don’t have the time and resources to deal with them at the present moment.
As a final piece of advice, remember that your product is a living thing and its requirements may shift along the way.
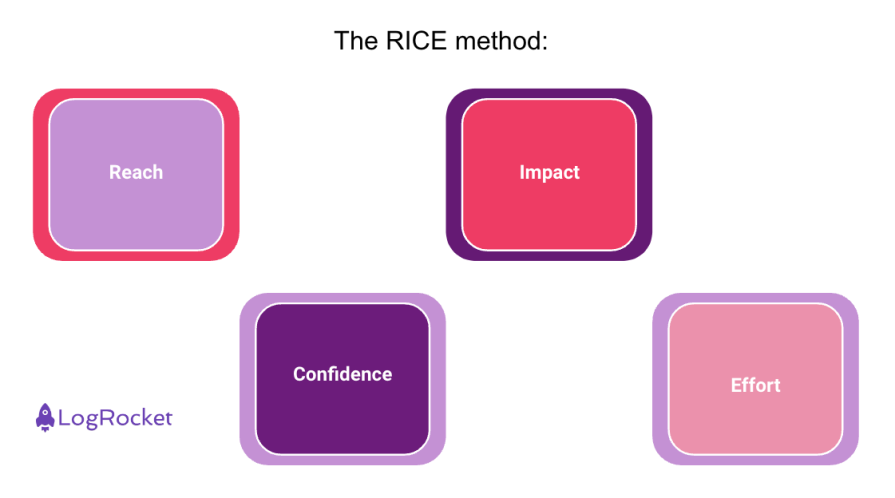
The RICE method was invented by Intercom to prioritize its project ideas. The company was struggling to determine which of its ideas to run with first and created a method uniquely suited for its style.
With the method, you calculate each of the acronym components according to: reach, impact, confidence, and effort. Each component has its formula to determine a score. To get started, ask yourself:

Before you do anything else, you need to determine your reach score. Reach refers to the number of users affected by a given story.
To make things tangible, you also need to select a specific time interval. This could involve monthly, quarterly, or yearly based plans.
For example, if 1000 users are waiting for the new Jira integration and 500 customers are waiting for the Trello integration within the next month, your reach score would be 100 for Jira, 50 for Trello.
The reach score has direct multiple effects on your prioritization method. The higher the customer requires, the higher score that story gets. In the above example, Jira stories would be prioritized before Trello.
This score speaks to the impact of the story over customers. While reach shows how many users you can affect, impact shows how many possible newcomers you could onboard. This isn’t an exact number. Instead you can categorize according to the following:
With these numbers you can guarantee that minimal impact stories don’t bring down your end score.
Your confidence measures how certain you are about the scores you gave for reach and impact. Sometimes people call this “PM certainty.” The creators of the method added this in because they wanted to mitigate the potential for personal bias to sway decision points.
This part of the RICE method is especially useful for things like impact that can’t be neatly quantified as you can say that you’re not totally confident about a prior score to help you determine whether a story should actually be prioritized.
The lower your confidence, the lower the score your story will get.
Because it’s difficult to give a direct value to each story, Intercom also separated percentages like it did with impact. This approach prevented the product team from struggling to find exact percentages:
When you go to calculate a RICE score, you multiply the values of react, impact, and confidence. Effort, on the other hand, has an adverse impact on your score as it shows how much development (or other) resources you require for that specific story in that time interval.
You calculate effort either with story points during sprints or with rough estimations according to team analysis. One way would be to calculate how many people work in a given sprint and then multiply it with the project’s time interval.
After deciding on the intervals and the effects of each component, you score each story with this formula:

The formula can be arranged to get specific scores. You can give intervals to user counts and select specific numbers for each interval to give you numbers between “0 and 100.” This helps when you have millions of users as multiplying directly with your estimated user count will give you unreasonable values.
When scoring with the RICE method, you need numbers and time intervals but what if your product isn’t live yet? You need to know how many users require a story to decide the “reach” score.
Because of this you need to consider:
If you choose to adopt the RICE method, know that you will have numbers as a deciding factor for your decision-making. However, be careful about this as wrong estimations can lead to product failure. This becomes tricker with something like “impact” since “gut feelings” aren’t a statistical result.
You need user data for that confidence level. To achieve this, you can use blog sites, comments, collect feedback, do research etc.
The MoSCoW method is mostly applied to new products or projects because it helps you to arrange the boundaries and visualize required stories. Less less work required to determine effort and user base numbers unlike RICE. Steer towards MoSCoW when preparing your product MVP phase.
On the other hand, choose RICE if you already launched your product and you have problems prioritizing your backlog. It’s a great prioritization method for live products that have data to analyze.
Unfortunately, it’s impossible to say which of the two methods is better. Both can help you create a successful product and can make a great impact on your backlog. You just need to decide which problem you need to solve and decide accordingly.
Good luck choosing the right method and feel free to comment with any questions you have!
Featured image source: IconScout
LogRocket identifies friction points in the user experience so you can make informed decisions about product and design changes that must happen to hit your goals.
With LogRocket, you can understand the scope of the issues affecting your product and prioritize the changes that need to be made. LogRocket simplifies workflows by allowing Engineering, Product, UX, and Design teams to work from the same data as you, eliminating any confusion about what needs to be done.
Get your teams on the same page — try LogRocket today.

Great product managers spot change early. Discover how to pivot your product strategy before it’s too late.

Thach Nguyen, Senior Director of Product Management — STEPS at Stewart Title, emphasizes candid moments and human error in the age of AI.

Guard your focus, not just your time. Learn tactics to protect attention, cut noise, and do deep work that actually moves the roadmap.

Rumana Hafesjee talks about the evolving role of the product executive in today’s “great hesitation,” explores reinventing yourself as a leader, the benefits of fractional leadership, and more.