Editor’s note: This blog was updated on 10 April 2023 to merge information with a different LogRocket post on product management metrics.

Choosing the right metrics and analysis methods to track them can make the difference between delivering an OK product and delivering a great product.
In this guide, we’ll discuss product metrics, their benefits, and how teams can use product metrics data to measure the success and health of their product. We’ll list some specific metrics product managers commonly track and describe several types of analysis your team can use to pull actionable insights from that data.
Finally, we’ll offer some tips to help you determine what metrics your team should be collecting and select the right type of tool to help you get the most out of your product analytics.
Product metrics refer to a set of data and indicators that reveal details about how users are interacting and responding to your product. Objective data about users’ actual behavior is incredibly valuable to a product team. Tracking these metrics can answer questions such as which features customers are using most, how long they are using a feature, what makes them stop using it, etc.
Without tracking metrics in product management, your product team would miss out on meaningful insight into its customers. While surveys and customer interviews can provide a glimpse into a customer’s perception of the product, behavioral data can reveal trends and missed opportunities.
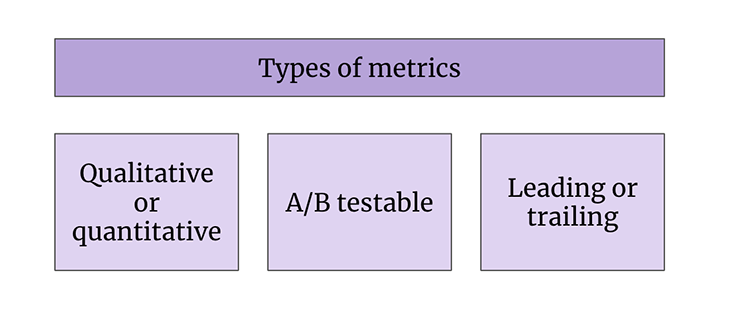
It’s important to think about the qualities of the product metrics you’re analyzing so you can know what to do with them. When evaluating metrics, product managers should consider whether they are:

When building a product, conflicting opinions tend to disrupt the development process. By providing hard data without emotional bias, you can ensure your product team is building features that appeal to users while still maintaining business goals.
Having product metrics, specifically product management metrics, is crucial to building a loyal customer base. It’s important to understand why your customers choose your product over your competitors. Data can provide insight into what makes people convert into customers and what features they use most frequently. Organizations can take this data and try to replicate it with other users to increase their conversion rate. On the other hand, you can also use product analytics to determine why a user didn’t complete a process by revealing where they may have become frustrated and dropped out of the funnel.
Additionally, product analytics will give you a new perspective on user behavior. It’s one thing to make your product and another thing to use it. Product analytics will help you uncover the nitty-gritty and stop you from guessing.
Before you can define your KPIs and determine which product metrics to analyze, you need to establish a desired outcome or goal. There’s no point in gathering data if you don’t have a plan on how to use it.
By creating list a of questions first, you can make sure your team is collecting the most relevant data without wasting time or resources. Some examples of questions you might ask to help narrow down which KPIs, metrics, and events to analyze:
Additionally, tracking product metrics comes in handy when formulating a hypothesis or goal for testing a new beta feature. For example, you might hypothesize that adding a “Help” link to a checkout page will increase sales. This would prompt your team to start gathering data and performing analysis on events related to checking out items from the shopping cart.
Because this data has a purpose, it can actually help the product team generate actionable insights rather than waste time collecting disparate data points that are filed away and seldom referenced again.
Product managers and teams encounter a wide range of metrics that are either directly related or adjacent to product. Some of the most common categories include:
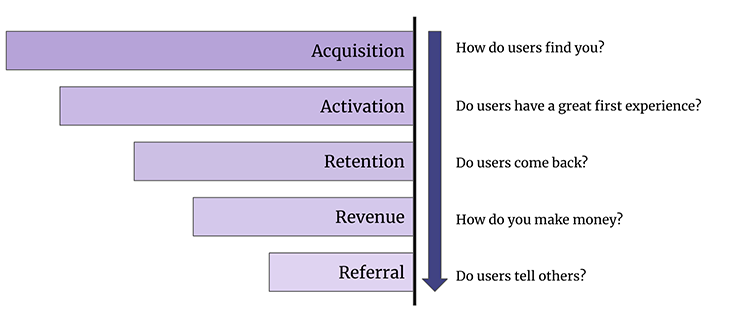
One of the most popular product analytics frameworks is called AARRR or pirate metrics. The AARRR framework follows the entire customer journey and demonstrates which user behavior metrics are analyzed for each stage. This helps product managers evaluate whether a product is meeting user needs throughout the customer journey:

The steps to the AARRR framework are as follows.
Acquisition focuses on where people are discovering a product. This is usually a summary of the different marketing channels and their effectiveness.
Some insights you can gain from tracking acquisition metrics include:
Activation refers to how many people have a happy first experience with a product and indicate they want to continue engaging with it.
Some user behavior metrics to monitor include:
Retention describes how long users stay engaged with a product or app over time.
Below are some examples of user behavior metrics to help you determine retention:
As a product manager, it’s your responsibility to prove that features are or will be profitable. Some product analytics software, like LogRocket, can create revenue insights for funnels to pinpoint critical areas. (In a recent G2 guide to best product analytics software, LogRocket was spotlighted as “Best for session replays and bug tracking”).
Otherwise, you can look at metrics that answer questions such as:
Once you’ve identified which AARRR stage and metrics you want to analyze, product teams can then implement tools to collect data. The product is a factor here, but far from the only factor. If the product isn’t selling well or making much money, it could be due to poor sales, marketing, content, pricing, and/or product. The next step is to analyze the data and make necessary adjustments to improve the product and marketing strategies.
Now, don’t get me wrong — it makes a lot of sense for sales to zero in on revenue and for it to be a KPI for the company. And the PM should be deeply involved with pricing and sales blockers. But revenue is a trailing indicator and has way too many variables to be useful for product managers to focus on directly.
When revenue is used as a definition of success, it is then often used for prioritization. And as much as people will pretend they can know how much money a feature will generate, this is not knowable. I’ve seen this approach lead to inflated predictions to get features greenlit.
Again, revenue is important, but don’t focus on it directly. You may end up forgoing long-term, truly innovative features and products that won’t directly impact revenue, ultimately putting the health of the company at risk.
It’s always valuable to track referrals to gauge customer satisfaction because happy customers are more likely to share or recommend your product.
Some metrics to monitor for insight into referrals include:
We covered a lot of the finance gist in the revenue section of AARRR, but financial metrics include anything related to money — revenue, sales, margins, operating costs, etc. There are a lot of factors that go into these metrics, and as we stated above, the product is a factor here, but not the only factor. It’s important to dig deeper into these numbers and see what’s driving them.
Remember that these metrics require context to be truly informative and actionable. Isolating a metric without considering things like industry standards, historical trends, and external influences may lead to misguided conclusions.
Anything related to usage: monthly active users, time spent in app or on site, pages views, churn, abandonment rate, activations, etc. The product is a major factor, but marketing and sales are also crucial here, as is design. Engagement metrics are trailing indicators of success, which means that improving engagement isn’t necessarily a good thing. It also means that if engagement doesn’t improve, it isn’t necessarily a bad thing.
Consider the example of booking a reservation for a restaurant in a map application. This is a cool feature that both Google Maps and Apple Maps allow you to do. But if people aren’t thinking to use their maps application to decide where to go and instead are focused on getting to where they’ve already decided to go, the initial engagement for such a feature is going to be very low.
This doesn’t mean it was a bad idea or that the feature wasn’t successful; it just means that users need to evolve their thinking about what the maps application is for. They may not ever do this on their own, but with the help of good marketing and the support of other features (such as local guides), this should change over time.
The other canonical example is scrolling on Facebook and Instagram scrolling. There is a point at which continuous scrolling makes people increasingly less happy — the infamous doom scroll. So, if you as a PM are focused on increasing the amount of time spent scrolling the newsfeed, you may be negatively impacting your users.
All that said, used well, engagement metrics are a wonderful thing as long as you are balancing this data with other information (qualitative metrics like NPS or user surveys targeted at your impact metrics). They are quantitative and very often A/B testable, which makes them fun to focus on for the whole team. Pick a couple of engagement metrics very carefully and think about why they may be telling you something different than what you think before you decide on which ones to use.
Quality metrics include performance, bug rates, scalability numbers, reliability, compliance, security, etc. Usability is also something I would consider a quality metric — time to complete a task, for example.
The product is the only factor when it comes to quality metrics.
Are your products having the intended impact on the people using them? If you aim to inform people, are you doing so? If you hope to make people more productive, are they? If your product is designed for entertainment, are your users truly entertained, or just distracted or compelled?
Again, the product is the only factor here.
How do people feel about the product? Would they recommend it?
Net Promoter Score (NPS) is the main metric to track here. NPS measures whether your users would recommend your product. Product-market fit determines how disappointed your users would be if they couldn’t use your product anymore. Sentiment itself is just the beginning.
Reviews on the app store or TrustPilot are another. Churn rate is important, too. These metrics are mostly product-related but can also be impacted by customer support, customer success, and sales. A lot goes into sentiment, and product is a major factor, in addition to customer support and success, cost, help content, etc.
If you see a drop in NPS, you need to look deeper at what’s behind it. It could be product-related, but it may not be. Doing analysis on the qualitative responses that you receive (for example, including s question at the end such as, “Can you tell us more about why you rated us this way?”) is an essential responsibility of the product manager. But this qualitative data doesn’t necessarily move easily and is definitely not A/B testable, so you shouldn’t focus on it day-to-day.
Marketing metrics that are relevant to product managers include customer acquisition cost, advertising metrics such as cost per click and click-through rate, all things SEO, conversion rates, etc.
As a product manager, for the most part, you should understand but not focus on marketing metrics. The exception to this is conversion rate. This is most common if there is something the user literally buys in your product, but could also come into play for a more subtle definition of conversion, such as booking a ride in Uber.
There is overlap here with marketing because if someone comes to your app or site that isn’t the “right” customer, conversion will be low. In this case, it isn’t the product’s fault; it’s marketing’s fault. Or, if the “right” customer comes and they don’t buy anything, the problem may be related to either the supply or the product.
If you have access to them, conversion rates are important to focus on as a PM, in concert with marketing and whoever is in charge of supply.
It’s one thing to track product metrics, but it’s an entirely different skill to glean meaningful and actionable insights from the resultant data. This is where data analysis comes into play.
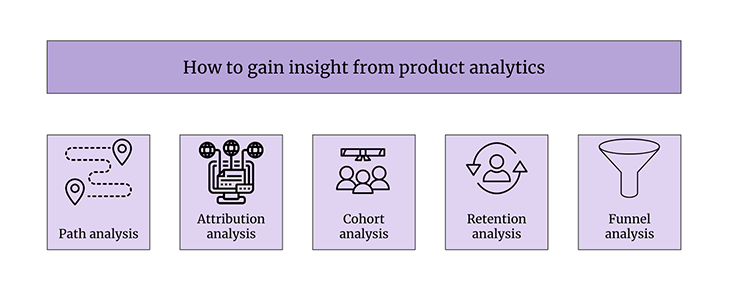
The most relevant type of analysis depends on the kind of answers your team needs. Let’s review some common types of product analysis you can use to measure and understand the product data you collect:

A trends analysis evaluates how certain features perform over time. The main goal of a trends analysis is to determine whether the adoption rate is increasing or decreasing. This can help you decide whether a product feature needs adjustments.
For example, many tools will reveal the exact click action that caused a person to stop using your product. This type of data can show whether an action is an isolated incident or a trend among users.
By noticing trends such as rage clicks (when a user repeatedly clicks on an element, indicating frustration), you can remedy the issue to improve the user experience.
A path analysis evaluates the steps a user takes to complete a journey. Some examples might include making a purchase or submitting a form.
By evaluating the user journey, you can see where users dropped out of the desired funnel and how successful the conversion rate was for the funnel.
Attribution analysis evaluates the users who completed the expected journey and identifies what attributes contributed to the successful completion. This can reveal positive insights into what is influencing users to continue to use the product.
For example, attribution analysis might reveal that a “Help” button has helped increase the user conversion rate.
A cohort analysis groups together users with similar characteristics and analyzes their behavior. This data can help you identify, among other things, what high-value customers are doing on the platform, how a newer cohort responded to a customer service experience, etc.
You can also group users by browser or device. This can help you discover and resolve inconsistencies in the user experience between customers who use your product on a mobile device versus those who are using a laptop.
Retention analysis focuses on users who continually use or engage with your product over time. Metrics such as customer satisfaction rate, active users, or feedback surveys can help you determine what makes a user continue to use your product.
Retention analysis also evaluates the churn rate, which is the rate at which users stop using your product.
Last, but not least, a funnel analysis evaluates the entire funnel and helps you identify areas for improvement.
The first step is to analyze user journeys that failed to complete the funnel.
For example, let’s say only 27 percent of users moved to the next step in the funnel. This rate obviously has the potential to grow, so you might decide to analyze video playback, or sessions, of users who didn’t complete the funnel.
You may also evaluate the funnel insights provided, which will delve into possible reasons for a lost conversion, such as rage clicks, dead clicks, exceptions, and network errors.
Product teams often need to use more than one tool to gather and analyze data. That’s because it’s difficult to consolidate product management metrics and find a singular data tool that can produce every report and chart a product team requires.
When choosing product analytics software, ask yourself:
The most popular and widely used data analytics tools help product managers and teams accomplish two tasks:
Product managers frequently invest in multiple tools to gain access to all of the data they want to monitor and evaluate.
Begin your search by determining what questions they need to answer. This will help you discern which tools have the necessary features to track and analyze the data you need to keep your users happy, gain new customers, and grow your product and business.
Quantitative product data is crucial to understanding user behavior. Once you have obtained statistically significant data, your product team can use this knowledge to improve the user experience, reduce churn rate, and generate ROI.
It all begins with choosing the right tools and monitoring the most relevant metrics.
Featured image source: IconScout

LogRocket identifies friction points in the user experience so you can make informed decisions about product and design changes that must happen to hit your goals.
With LogRocket, you can understand the scope of the issues affecting your product and prioritize the changes that need to be made. LogRocket simplifies workflows by allowing Engineering, Product, UX, and Design teams to work from the same data as you, eliminating any confusion about what needs to be done.
Get your teams on the same page — try LogRocket today.

Should PMs iterate or reinvent? Learn when small updates work, when bold change is needed, and how Slack and Adobe chose the right path.

AI accuracy problems are often chunking problems. Learn how chunk size and structure impact cost, retrieval quality, and UX.

April Dunford, bestselling author of Obviously Awesome and one of the most trusted voices in product positioning, explains how to expose weak AI claims and anchor differentiation that wins deals.

See how PMs replace dashboards with AI powered Slack workflows to surface real time insights, automate execution, and reduce cognitive load.