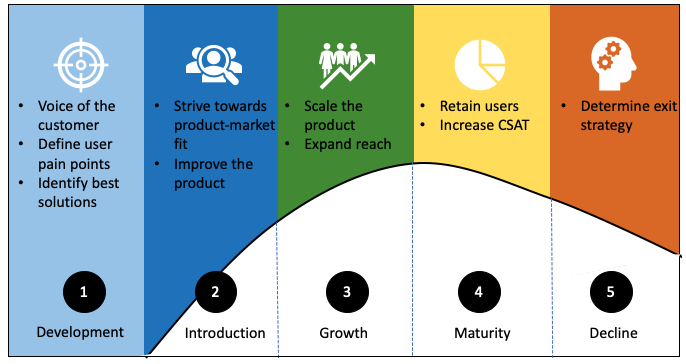
In this guide, we’ll define the five stages of the product lifecycle (development, introduction, growth, maturity, decline), and explore the role of the product manager at each stage.

The product lifecycle refers to the stages a product goes through from the moment it is introduced to users to when it is removed from the market.
Before a product is introduced to the market, it goes through a development cycle, which consists of four stages:
Following the product development cycle, the product is introduced to the market, then (ideally) undergoes a period of growth before reaching maturity and, eventually, declining from prominence in the market.
The five stages of the product lifecycle are:
Some consider only the latter four stages (introduction through decline) to be part of the product lifecycle. But in my opinion, development is an equally important stage in the product lifecycle because it lays the foundation for the subsequent stages.
These five stages complete the lifecycle of the product.
The product manager plays a major role throughout the entire product lifecycle. Each stage requires a different skill set and mindset to lead the team to success and steer the product in the right direction.
At each stage, the product manager has to evaluate KPIs and metrics to support a range of important decisions.

The process of developing a new product consists of many steps, from idea generation, to prototyping, building, and testing, to product launch.
Throughout these stages, the product manager acts as the voice of the customer, conducts market research and surveys, understands the user’s pain points, and determines solutions to address them.
Product managers define the product vision and strategy to help the product team understand why and how they are to build what they are building.
At this stage, the goal is to build the right product to attract early adopters. At each stage of the product development process, product managers ensure the team’s decisions revolve around the customer’s pain points.
Let’s break down the product development stage even further and explore the role of a product manager at each step:
It’s hard to measure performance during this stage because the product is still under development. However, the product manager might conduct focus groups or surveys to get more information about user pain points and validate their assumptions.
Before launch, the product manager might consider looking at the following:
It’s good to know about the potential target market size and set a bar on how much the product can tap the market upon launch.
If there is a website or a minimum viable product (MVP) launched, you can measure the number of potential signups. More signups indicate high interest and higher likelihood of success.
During the pre-launch stage, the marketing team often tried to generate buzz on social media to attract early adopters. Engagement rate can help you track users’ ongoing interest in your product.
Keeping track of the progress of features and whether they are being tailored to user needs is a key responsibility of the product manager.
The introduction stage refers to the period when a product is launched to the market, whether it is the first of its kind or you’re introducing a product into a new market. During this phase, the sales volume is low and demand is built gradually.
The product manager works with the marketing team and helps educate early adopters about the benefits of using the product. Product managers are subject matter experts on the product, so they should be able to explain its core values to internal teams such as marketing, engineering, support, sales, and design.
Usually, enough data is gathered to support the product launch and the gap it will fill in the market, but product managers validate the need of the product in the market after its launch.
To summarize, the role of the product manager during this stage is to:
Once the product is launched, the product manager must measure its performance. Some key product metrics to keep an eye at this stage include:
The activation rate is the ratio of users who have reached the activation point versus the total number of users who signed up. The activation point refers to a user action that indicates engagement with the feature.
The adoption metric indicates whether users are actually using a feature or product. It can be calculated using the following formula:
Adoption rate = feature MAU / monthly logins * 100
A higher feature adoption rate indicates that users like the feature and are deriving value from it.
Customer acquisition cost represents the cost spent by the organization to acquire a user. This can be calculated by dividing the total amount spent on marketing and sales by total acquired customers during a given time period. The focus should be to decrease this number going forward so you can acquire more users with less expenditure.
If your product is saleable, revenue is an important metric. It is crucial to measure the revenue generated monthly and yearly, along with the revenue growth rate.
The growth stage is when the product has proven that it has a market and its demand begins to rise. With higher sales volume, other competitors typically enter the market. Increased awareness, profit, market share, and competition are indicators that a product is in its growth stage.
Marketing campaigns aim to establish brand value to gain an edge over the competition. As a product manager, you must direct the path of the product toward growth.
During the growth stage, product managers should:
During this stage, as sales increase, it’s important to keep track of metrics that measure growth and reach of the product.
Some metrics to focus on during this stage include:
Obviously, revenue grows as sales increase, but it is important to track the rate at which revenue is growing. A declining revenue growth rate is concerning and may indicate that the product is entering its maturity stage.
Expansion revenue is the additional revenue that can be gained by upselling to existing users. This is a great technique to grow revenue with the existing user base.
Referrals from active users can be really helpful to increase the user base. You may be able to boost referrals by providing small incentives to existing users, which can lead to more growth.
The likelihood of a user to remain with your product depends on how happy it makes them. It is crucial to gauge the customer satisfaction level by collecting regular feedback from users. Net Promoter Score is another metric that measures customer happiness and loyalty.
Stickiness is your product’s ability to retain users because of the value it offers.
Stickiness is calculated with the following formula:
Stickiness = DAU / MAU
High stickiness means the product has the power to engage users again and again.
There comes a time in the life of a product when sales have peaked, you’ve maximized your pool of customers, and income is constant. This is a good time to take stock of past mistakes to improve the product and boost retainment.
Stagnant sales, declining customer growth, and heightened competition are all indicators of product maturity. During this stage, the focus of product managers is to retain the existing market share. This can be done by differentiating the product from the competition.
The objective is always to steer the product back toward the growth stage, for example, by attempting to enter new markets. Retaining customers and maintaining high customer satisfaction is a key to prolonging this stage.
Every product goes through the maturity stage. The trick is to minimize the time it spends there.
The maturity stage focuses on maintaining what has been achieved and figuring out new ways to move the product back to the growth stage. To accomplish this, product managers should track the following metrics:
Churn rate is the rate at which users stop using the product — for example, canceling a subscription. Churn can be calculated by dividing the customers lost during the previous quarter by the number of customers acquired during that quarter. The goal should be to lower the churn rate and retain existing users.
Retention rate measures how many users continue using the product over a given period of time. The higher the retention rate, the more satisfied users are with the product.
Churn rate and retention rate go hand-in-hand. The higher the retention rate, the lower the churn rate.
Inevitably, for any multitude of reasons, all products reach a period of decline. This can happen due to the emergence of new technology, increased competition, the availability of cheaper solutions, and a wide variety of other factors.
Classic indicators of decline include decreasing market share, decreasing sales, and waning customer interest. The product manager must evaluate the reasoning behind the decline.
One way to respond to decline is to attempt to leverage the existing brand value and enter a new market. This is known as the pivot approach. Alternatively, you could shift the focus to reengaging inactive users by working closely with the marketing team.
If the product’s decline is inevitable, the final responsibility of the product manager is to facilitate a smooth offboarding for existing customers. When you’ve exhausted all other options to revive the product, circumstances may require that you take the product off the market.
The least you can do during this stage is to minimize customer complaints and address them as soon as possible. It might be useful to track the customer complaint count and collaborate with the support team to resolve issues.
Developing a new product and bringing it to market is a roller coaster: everyone is excited before and after the launch, momentum reaches a crescendo during the growth and maturity stages, and adrenaline levels start to normalize during decline.
Each stage of the product lifecycle has its own set of challenges and requirements. The product manager plays an important role during each stage, providing direction and support and measuring progress all along the way.
Featured image source: IconScout
LogRocket identifies friction points in the user experience so you can make informed decisions about product and design changes that must happen to hit your goals.
With LogRocket, you can understand the scope of the issues affecting your product and prioritize the changes that need to be made. LogRocket simplifies workflows by allowing Engineering, Product, UX, and Design teams to work from the same data as you, eliminating any confusion about what needs to be done.
Get your teams on the same page — try LogRocket today.

Act fast or play it safe? Product managers face this daily. Here’s a smarter way to balance risk, speed, and responsibility.

Emmett Ryan shares how introducing agile processes at C.H. Robinson improved accuracy of project estimations and overall qualitative feedback.

Suvrat Joshi shares the importance of viewing trade-off decisions in product management more like a balance than a compromise.

Great product managers spot change early. Discover how to pivot your product strategy before it’s too late.