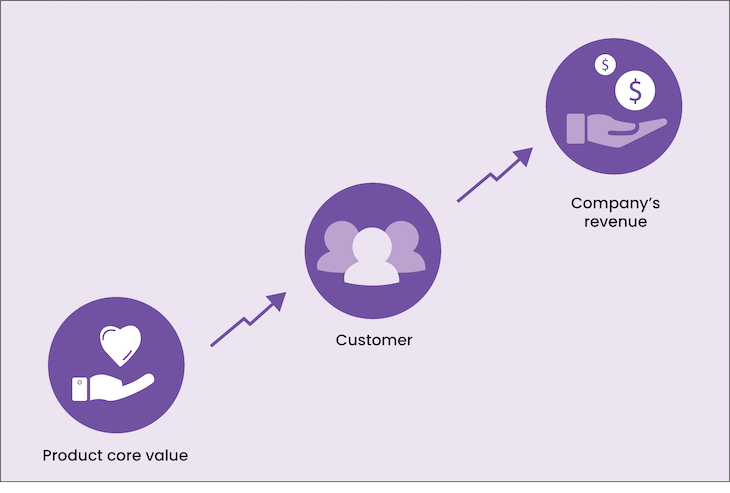
A North Star metric represents a company’s core value that gets delivered to customers via their service or product. It’s the one metric that matters most to sustain the long-term growth of the organization.

The NSM also aligns all short-term goals of the company towards one core objective of delivering value. Additionally, the NSM gives a clear direction to focus on, which subsequently brings transparency around the business outcomes achieved by different teams.
North Star metrics make teams focus on a single goal and prevents them from unintentionally working against each other on different goals. Moreover, the NSM puts the team, stakeholders, and clients on the same page. It also helps companies align their business outcomes with customer value.
Additionally, the North Star metric allows the team to see how business is doing. Transparency plays a major role in the success of the North Star metric. Through NSM growth, teams get motivated when they see how they are creating impact.
Instead of indulging in smaller details when the team discards the bigger picture, the NSM prevents teams from getting lost in team-specific goals.
Team-specific goals that don’t align with overall business goals should be avoided; instead, the team should focus on central goals through NSM.
A company’s North Star metric is not always super strategic or secretive. In actuality, it tends to make a lot of sense.
Let’s look at examples of some North Star metrics at some successful companies:
Revenue is a bad metric to use as the NSM — it doesn’t describe the company’s value to the customer. Instead, it’s generated by the amount paid by the customer to buy the service/product.
Therefore, if NSM is measured by revenue, a company will never achieve the ultimate objective of its core value and will lose its focus in the long term.
“Revenue is the outcome of the company’s value rather than the core focus.”
Netflix can use ads to earn more revenue without lowering subscription prices. As a result, it might generate short-term revenue but won’t continue in the long term. To ensure growth, Netflix must offer consumers substantial value so they’ll be eager to renew or buy subscriptions and enjoy watching with ads. Hence, it emphasizes the meaning of creating value and focusing on the customer, and a non-revenue NSM helps track it.
Ideally, there should be a North Star metric for companies with no diversified product portfolios. For example, Zoom has a North Star metric because all internal and external activities of multiple product teams, infrastructure, growth and marketing, and business work towards scaling Zoom to its core value: hosting meetings seamlessly.
Therefore, their NSM and key metric, the number of weekly hosted meetings, not only signifies all other secondary KPIs tracked by individual teams but also justifies the value offered to the customer.
On the other hand, a complex organization with multiple products and unique core value propositions can have multiple NSMs for each product, as long as it contributes to the company’s overall revenue and stakeholder returns:

For example, Amazon has many products contributing to its bottom line: e-commerce, OTT, clouds (AWS) extra, and therefore has multiple NSMs to quantify each product’s success.
Similarly, Google has multiple products, each with a unique core value. For instance, the search engine allows users to search for information, Google Cloud enables customers to store their data, YouTube has entertainment aspects, and the rest (Google Maps, Gmail, Drive, Chrome, and Calendar) have their unique values as they solve different customer problems.
In such cases, it is common to have multiple NSMs to track the value of each product. Besides the values, these products also contribute to the bottom line of the two companies and justify the concept of multiple NSMs.
Identifying the North Star needs contemplating over a few thought-provoking questions. Sample questions are:
These questions lead to finding a good NSM. The common pitfall is non-convergent thoughts.
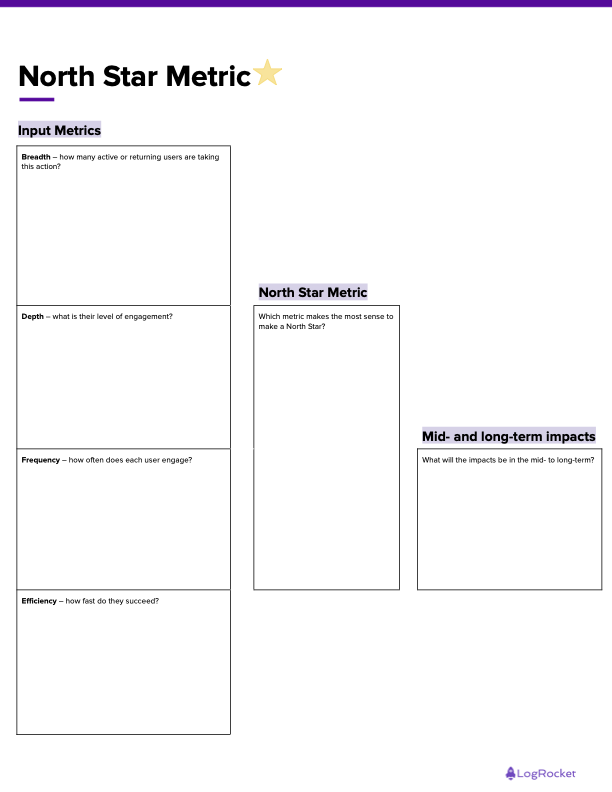
You can use multiple frameworks for brainstorming to help the team identify and explore North Star metrics, and one size doesn’t fit all. Here’s an example of a simple template with a link for free download:

Each actionable input covers four areas: breadth, depth, frequency, and efficiency. They are defined as:
Additionally, multiple free and paid frameworks, such as Miro’s North Star metric workshop, are available in the market. Also, the team can perform workshops and exercises on any collaborative tool with whiteboarding capabilities.
Ideally, product sponsors and leaders will join the effort for NSM exercises. Product, design, engineering, and marketing points of contact should also be included to ensure alignment across all of these business functions
Once the NSM is decided, it should be communicated to the wider audience across the organization or product team to influence their focus area. The organization and product teams should then work on aligning and updating their internal KPIs to NSMs.
Teams track NSMs using high availability and real-time analytics dashboards, like LogRocket. The dashboard should be readable and consistent, as the NSM is an important part of product analytics.
Multiple actionable inputs of product metrics collectively define the NSM.
Let’s talk about some popular companies and their North Star metrics.
We discussed Spotify before, and their NSM is time spent listening. They had to consider all the input metrics across breadth, frequency, and depth to derive a good NSM.
Next, we have Airbnb. Their NSM is the number of nights booked. This NSM perfectly defines the value offered to the booker and property renter. The decline in this metric shows a direct impact on the revenue and stakeholder returns.
Slack’s North Star metric is daily active users (DAU). Slack is a little bit more complex since it’s more of a B2B product. To keep their NSM growing, they embrace a product-led growth approach to focus on innovation, experimentation, user experience, and building partner ecosystems with startups and enterprises.
Finally, let’s consider Uber. Their North Star metric is pretty simple — rides per week. Uber’s NSM clearly defines the value offered to the rider and driver. More rides on both rider and driver platforms show the health of Uber’s growth engine. Uber keeps a watchful eye on all the input metrics contributing to its North Star metric.
Tip: an organization or product team must revisit all the input metrics and NSMs to see if they need to hold or change them. This can be because of the current state of the market, an evolving product, or changing goals.
It is often called “navigating the North Star,” this is a way of maintaining and evolving the NSM through strategies and tactics. A North Star strategy is built and executed in the following ways:
To wrap up, an organization needs all stakeholders to clearly understand the aspiration, goals, and value the product gives customers. Hence, clarity is an important purpose solved by North Star metrics.
A lack of a common goal doesn’t build a strong foundation for an organization or product. The North Star sets the organization’s strategy by keeping common goals at the center of all effort and vision.

LogRocket identifies friction points in the user experience so you can make informed decisions about product and design changes that must happen to hit your goals.
With LogRocket, you can understand the scope of the issues affecting your product and prioritize the changes that need to be made. LogRocket simplifies workflows by allowing Engineering, Product, UX, and Design teams to work from the same data as you, eliminating any confusion about what needs to be done.
Get your teams on the same page — try LogRocket today.

Maryam Ashoori, VP of Product and Engineering at IBM’s Watsonx platform, talks about the messy reality of enterprise AI deployment.

A product manager’s guide to deciding when automation is enough, when AI adds value, and how to make the tradeoffs intentionally.

How AI reshaped product management in 2025 and what PMs must rethink in 2026 to stay effective in a rapidly changing product landscape.

Deepika Manglani, VP of Product at the LA Times, talks about how she’s bringing the 140-year-old institution into the future.