What’s the first thing that comes to your mind when you hear “pricing”?

If you’re like most people, you probably think about an exact price, such as $2.99, but that’s only one side of the coin.
More often than not, what you charge for is equally or even more important than the exact price point you set. For example, if:
Not only would these changes shift each company’s monetization model, there’s a high chance these companies would leave money on the table if the new model was less aligned with the user’s value perception.
To decide what to charge for, you can utilize value metrics to determine an effective pricing strategy.
In this article, you will learn what value metrics are, the trade-offs of different types, and read about real-world examples of companies who use them.
A value metric gauges how much value a user gets from a product or service.
From both a user and business perspective, the optimal pricing model is when the price increases or decreases corresponding to the value the user receives from the product.
The more value you receive from the product, the more you pay. The less value you receive, the less you pay.
Aligning price scaling with value received is one of the most efficient ways to maximize your overall revenue potential and customer satisfaction.
But measuring value is tricky.
Not only do products tend to offer value in different ways, measuring some types of value propositions seems almost impossible at first. Imagine measuring metrics like:
In most cases, you need to find a proxy metric for measuring value. A proxy metric is a measurable and quantifiable metric correlated with your value definition.
There are three main types of value metrics that can help determine the value you deliver to users:
With the feature-based value metric, you assume that the value a user gets correlates best with the number of features you offer.
The more features you have available, the more value you get from the product, so the higher you can set the price.
This can scale in two ways.
You can scale vertically, offering different bundles with different sets of features (such as different subscription tiers). This simplifies the choice for the users at the cost of limited customization.
For example, if your tier 1 subscription offers three features, and your tier 2 subscription offers five features, but a particular user is interested only in four specific features, they might find the tier 1 plan unsatisfactory. At the same time, they are not willing to pay for tier 2, as they’d have to pay for the extra features they don’t need.
You can also scale horizontally, which means charging for particular features. It’s often called unbundling.
Take Ryanair, for example. You pay the minimum fee for the flight price itself, but you need to pay extra for every additional option you choose, such as seat selection, onboard meal, baggage, etc. The main advantage of this approach is the ability to personalize, but it often comes with a choice paralysis for users.
As the name suggests, usage-based value metrics scale as the product usage scales.
In this case, you assume that the more a particular user uses the product, the more they benefit from it.
Let’s take an email marketing platform as an example. It’s impossible for the platform to measure how much value you get from emails you send to your users, not to mention it’s often out of the product’s scope (that is, it depends on the type of emails you send, how effective your copywriting is, etc.).
However, one could assume that the more emails you send through the platform, the more valuable you find it, so charging for the number of emails sent would make a reliable proxy.
This would also help you control your costs better. Let’s take UserZoom as an example. Recording user tests is expensive, but if you scale the price with the number of recordings, you can maintain relatively stable margins for heavy and occasional users.
With an outcome-based value metric, the more positive outcomes a user gets, the more they pay for your product.
Say that your product helps the sales team get contracts. Charging a single customer $100, 000 in a given month won’t be a problem if you helped them close a deal worth 20 times more. On the other hand, if someone struggles and closes only small deals, they also pay only small fees, so their risk of churning is lower.
Outcomes are often hard to measure directly, so once again, you resort to proxies of various kinds.
For example, the perfect metric for OpenTable would be the revenue generated from customers who book through their website. But since the bills are usually settled on-premises, and in cash, OpenTable can’t measure it.
However, you can assume that the more seat bookings you get, the more revenue you get. So OpenTable charges per seat reservation you get thanks to their software.
Although the outcome-based value metrics might seem the best, one value metric isn’t necessarily better than the others.
Each comes with various tradeoffs. The two most important are:
The more closely a value metric is aligned with the user’s value, the better. It helps you maximize the revenue from people who benefit from the product the most without overcharging and scaring off struggling users.
Potential customers are less willing to commit to new services if they don’t know exactly how much they will cost. For some users and businesses, an unpredictable monthly bill is a no-go.
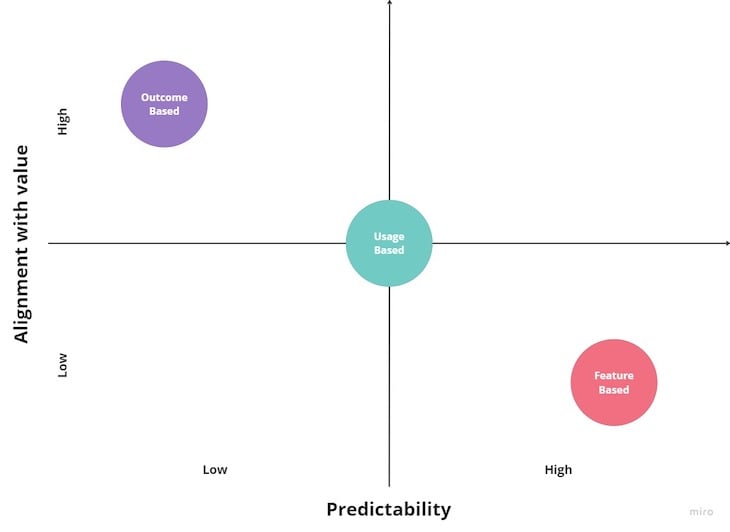
Let’s revisit value metrics with a focus on those two factors:

Feature-based value metrics are predictable. In most cases, the customer commits to a specific set of features for a particular price.
They don’t have to do any thinking or estimations and can easily budget this cost in their home or company budget. This reduces the friction to purchase considerably.
However, it often poorly reflects the actual value users get. As a result, sporadic users tend to pay more than they get in return, thus churning before they develop a habit and learn how to use the product. On the other hand, heavy users tend to pay you below what they’re willing for the value they get.
This value metric is in the middle of the whole spectrum.
While the price is still variable, potential customers tend to have a sense of how much they will use the product, thus, how big a bill they should expect.
In theory, the more they use the product, the more value they should get from it, but it’s not perfectly correlated. You can still use the product heavily without ultimately getting much value, and you can use the product sporadically yet generate a lot of value from this occasional usage.
Outcome-based metrics are most closely aligned with the value users get, thus allowing you to strike the perfect balance between price and value.
However, it’s still tough to achieve. Choosing the best outcome proxy and an adequate price for that outcome is a challenge of its own.
It also comes with a high degree of unpredictability to users, which can scare off customers that need predictability.
Now let’s take a look at how various companies charge their customers:
Theoretically, the usage-based metric would be an excellent value metric for Netflix. The more you watch, the more you enjoy the service, and the more you pay.
But the predictability tradeoff is too severe on both sides.
The promise of watching unlimited shows for a fixed price is one of Netflix’s key value offerings, and if the price increased with usage, many customers would churn.
On the business side, subscription products tend to benefit from users’ tendencies to subscribe to products they don’t even use. Not charging inactive customers would significantly reduce Netflix’s bottom line.
Given all those factors, Netflix defaulted to a feature-based model, where you pay a different monthly fee depending on your desired video quality or the number of concurrent viewing sessions.
Predictability on both sides is a more critical factor than actual alignment with value.
Since Uber’s costs depend heavily on users’ usage, feature-based pricing is not an option.
Uber could charge for usage, which in this case would be the number of miles traveled, or for the outcome, which could be proxied by the time traveled (as Uber’s promise is quickly getting from point A to B).
However, the outcome is often influenced by external factors, such as traffic or the speed of a particular driver. This makes the price unpredictable and often disconnected from a specific user’s action.
So the main value-metric Uber uses is kilometers traveled, which is the most optimal tradeoff here.
Thumbtack only monetizes one part of the marketplace: home renovation professionals looking for their new gig.
Since freelance professionals advertise their services on various websites, charging a fixed feature-based fee for access to the platform could scare some of them off. The engagement of these professionals differs a lot, with heavy users getting numerous gigs every week and casual users getting one gig a month or so. Because of this, the tactic is suboptimal at best.
It’s hard to correlate any form of usage to the value these professionals would get. The only proxy that comes to mind is the number of messages with potential customers. This doesn’t necessarily correlate to value. Some customers will require more extended conversations to explain the details of the job they need to get done, while in other cases, one message might be enough.
Although the outcome itself is hard to measure, there’s a reasonable proxy for that — the number of leads a professional gets through the platform. By lead, Thumbtack defines a customer that started a conversation with a professional.
The number of leads is the most correlated value proxy in this case. The unpredictability also doesn’t seem like a big issue if professionals can make extra revenue with every new job they get through the platform.
Considering it all, an outcome-based value metric for Thumbtack is the optimal way to scale the price the platform charges.
In summary, what you charge for is more important than how much you charge.
You can charge for:
These value metrics come with different price predictability for both the business and the customer, as well as different doses of correlation between the actual value you serve.
Feature-based pricing is the most predictable, but it doesn’t allow you to reap the full benefits of heavy users and puts casual users at risk.
Well-defined outcome-based pricing helps you charge the most optimal price, but it comes with the unpredictability that might be a deal-killer for some types of users.
Usage-based pricing lands somewhere in between. While it doesn’t correlate with value as strongly as outcome-based pricing, it comes with somewhat increased price predictability.
Consider factors such as:
These will help you determine which pricing model is best suited for your business.
Featured image source: IconScout

LogRocket identifies friction points in the user experience so you can make informed decisions about product and design changes that must happen to hit your goals.
With LogRocket, you can understand the scope of the issues affecting your product and prioritize the changes that need to be made. LogRocket simplifies workflows by allowing Engineering, Product, UX, and Design teams to work from the same data as you, eliminating any confusion about what needs to be done.
Get your teams on the same page — try LogRocket today.

Maryam Ashoori, VP of Product and Engineering at IBM’s Watsonx platform, talks about the messy reality of enterprise AI deployment.

A product manager’s guide to deciding when automation is enough, when AI adds value, and how to make the tradeoffs intentionally.

How AI reshaped product management in 2025 and what PMs must rethink in 2026 to stay effective in a rapidly changing product landscape.

Deepika Manglani, VP of Product at the LA Times, talks about how she’s bringing the 140-year-old institution into the future.