I’m a strong advocate of the idea that the main value a product manager brings to the team is decision-making. By centralizing risk-taking and assessment to a single individual, you should, in theory, get faster reactions to change and a higher degree of mitigation.

Since decision-making is so important and puts so much strain on a single individual, people have come up with all sorts of frameworks to aid product managers in making the best calls. I want to go over the ones I’ve used the most.
The entire team must take some decisions, and some might even need to involve stakeholders and customers. Most of the day-to-day decisions, though, can be made by the product manager alone.
This is an important separation between types of decision-making processes: should this definition be made by a group or individual? Do you need consensus or are you supposed to just communicate about your choices?
Whatever the context, there is an option for you.
Lone decision-making is not necessarily a synonym for safe decision-making. The key difference here is that third-party input is either unnecessary or unwanted.
Lone decision-making frameworks often exist to validate your conclusions after the fact. You made a decision and you need to foolproof it, or you need something to present to others that’s better than “I think that…”
Of course, those three frameworks might be used in a group context also, no problem. Just have in mind that they work well in the solitude of your workstation too.
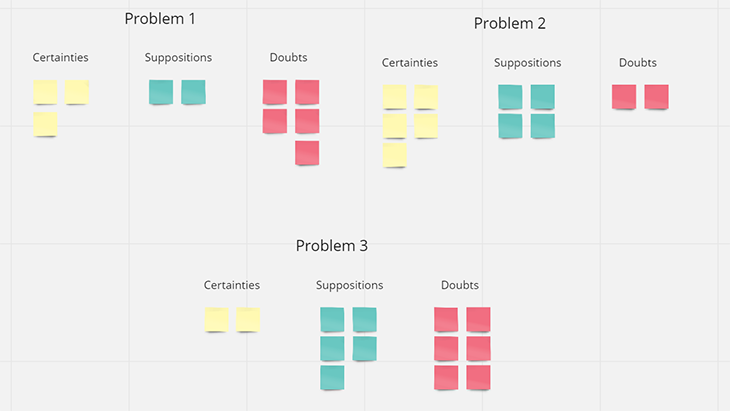
CSD stands for certainties, suppositions, and doubts. This framework is amazing for organizing the mess our heads get into with so much information.
The idea is to use post-its to plot down what you know for sure about a problem, what you think you know, and what you don’t know at all in three respective columns.
This helps a great deal to guide discovery and map out potential traps you might fall into after decisions are made.
There is no silver bullet here. Maybe diving into the problem with the most open doubts is the decision to be made? Maybe pushing for the feature you have more certainty on? This framework won’t make decisions for you, but it will help:
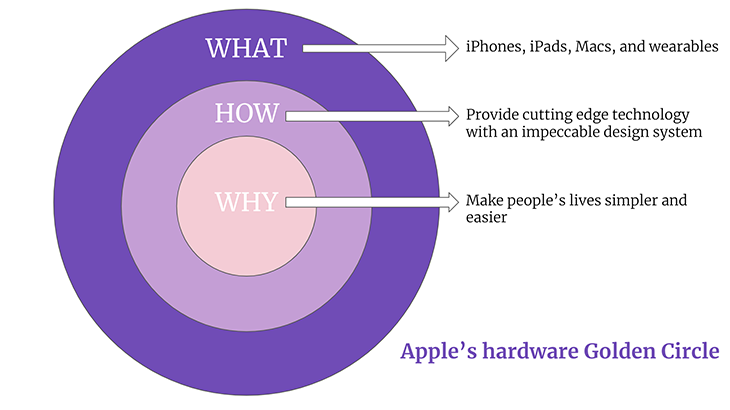
The Golden Circle was introduced by leadership specialist Simon Sinek back in 2009 in his book Start with why. It’s not much of a “framework,” but a business compass.
I list this here because I’ve lost count of how many times I had to create a Golden Circle of my own to drive decision-making. When you have to pick from multiple options at the table, it’s often just a matter of thinking about why you need to make that decision in the first place.
On the outer limit of the circle, you have the “what” — the solutions you have floating around. On the intermediary layer of the circle, you have the “how,” which is the strategy layer, such as objectives from OKRs. In the center is the “why” — the drive, the thing that is the fundamental value you want to create. This should be the bedrock that supports all your “whats” and “hows.”
In case you see yourself needing to decide between something that relates to your why and something else that doesn’t, you have your decision made for you:
Graphs are the single most interesting decision tool for people dealing with highly volatile and complex data. In the 18th century, Leonhard Euler came up with an impossible logical exercise about crossing bridges in Königsberg. 300 years later, we use his mathematical model to do all sorts of things, from creating AIs to mapping how gossip spreads.
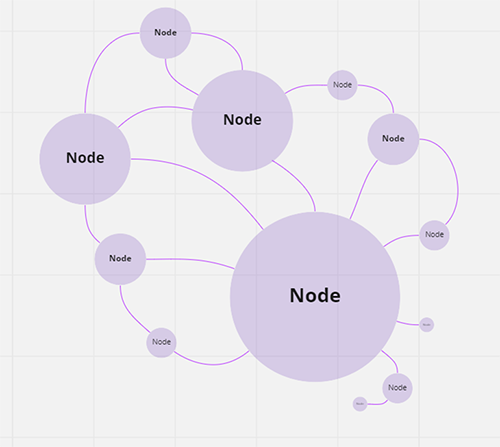
Although sophisticated, graphs are not hard to understand once you visualize them. A graph is composed of nodes and edges (or connections). The more edges a node shares with other nodes, the more important it is. It looks something like this:
How does that apply to decision-making, though? Having to make a decision alone is work enough, you don’t need to add a mathematical equation to it to make things worse.
Don’t worry, It’s all a matter of visualization.
First, you create nodes for your question or objectives and options. Once you have everything plotted down, you start making connections: how many questions/objectives does that option attend to? The more connections an option has, the more interesting it is to pursue instead of others.
As a practical example, let’s say that we have a bug in production and you need to come up with a solution plan. Your graph would look something like this:
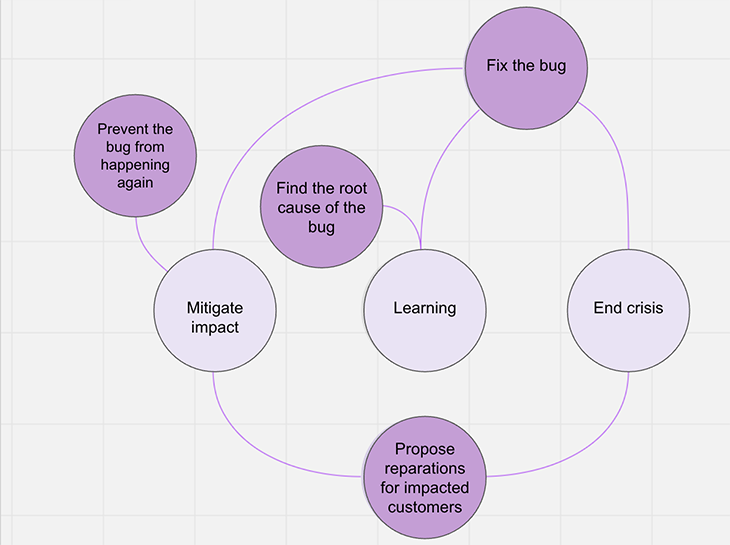
In purple, we have the available options. In gray, we have the objectives we need to attend to. It’s clear that fixing the bug right away is the immediate decision to make. The second most important thing is to propose reparations to the impacted customers, and in no particular order, it would be interesting to find the root cause of the bug and eventually prevent it from happening again.
Group decision-making is a must when dealing with sensitive topics or subjects that a lot of people have an interest in. A substantial part of what stakeholder management means is the need to share accountability. Frameworks help a great deal in organizing people and giving clarity on objectives.
On the other hand, collective decision-making can be a dangerous path to deadlocks and loss of executive power. You need to handle the processes and dynamics with a tight fist to keep people focused on the problem at hand and to maintain options below the line of the absurd.
RICE and ICE are usually seen as prioritization frameworks, but let’s not forget that prioritization is an exercise of decision-making on its own. It’s perfectly acceptable to broaden both frameworks’ applicability beyond your roadmap.
ICE stands for impact, confidence, and ease (or effort), while the R from RICE stands for reach — meaning the number of people that will be impacted by your decision. Apply a value to each variable and get your score according to the equations below:

The higher the score, the more important it is for you to prioritize that decision.
How is that collective though? I like defining each of those values either through consensus or as an average of involved people’s votes. People tend to be more accepting of their preferred options being deprioritized if they had a say in all votes.
Example: say your team is undecided between launching a feature straight away after development or spending more time looking for potential bugs. It’s a clear scenario of “go/no go.” What are the perceived impacts of doing one or the other on the team’s results? How confident are they about that outcome? What is the cost of doing each of the options?
Plot it down with the ICE score and find what is the best choice for your team to pursue.
Decision trees are one of the most traditional decision-making mapping tools out there. From prediction algorithms to military planning, we use decision trees to create a bird’s eye view of the ramifications of our decisions.
A tree can be small, meaning it has only one decision node and its branching immediate consequences, or large, which means it has follow-up decisions and their respective branching consequences.
Imagine you need to define if your team is going to sunset a product or not. What are the consequences of sunsetting it? Lose some customers, reduce expenses with that particular product, reduce work overhead…What if we don’t sunset it? You’ll need to keep supporting it, evolving it, and investing in it. In this case, a tree would look something like this:
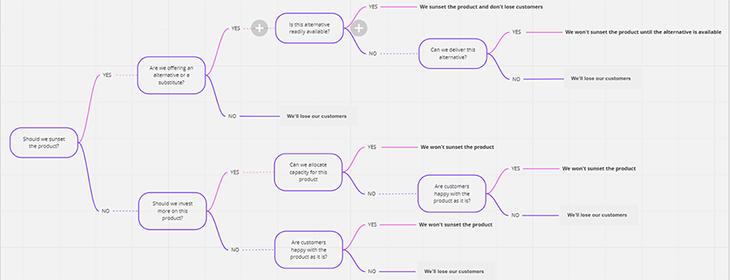
Notice that the tree is not making decisions on your behalf like RICE/ICE does, and that’s why this framework is excellent for group decision-making. When everybody is on the same page after seeing all possible outcomes of a decision, it’s easier to come to a consensus.
This is probably the simplest, yet one of the more engaging group decision-making tools available. Originally just a voting system for brainstorming sessions, I like the depth that the veto mechanic adds to the process.
First, the group must devise a list of possible alternatives to a pending decision. The list can be no smaller than two (otherwise the decision is already made) but has no maximum limit.
Once the group is satisfied with the number of available options, each person votes on the ones that they think make sense, while also vetoing the ones they think are bad ideas (or worse ideas compared to the rest).
Eventually, you’ll have a board that captures the overall feeling of the group about each option. Something like this:
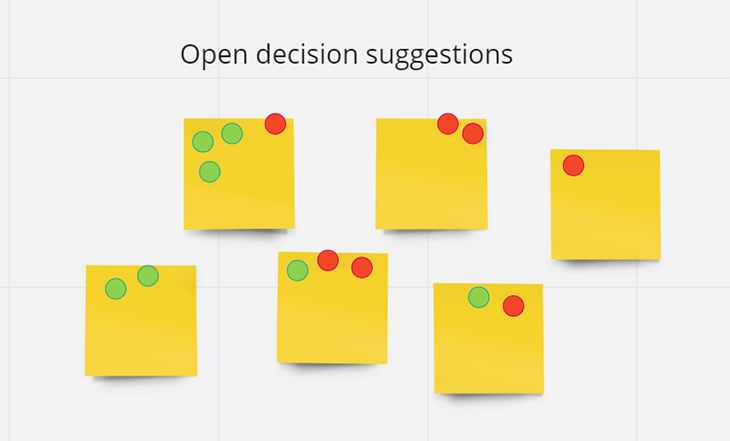
Notice that some options have both votes and vetoes. This is the most important part of this process: no decision is made until the group finds consensus on the most voted option. Adding vetoes gives people critical of that decision the ability to be voiced before a majority vote overrun them.
The group then needs to either argue to convince the ones against it or be persuaded into changing options. This way, you improve the chances of a decision being sound since it was scrutinized from multiple angles by the group.
This is a small collection of frameworks that I like to use and are not broadly available everywhere. There are plenty of other options spread across the internet for you to dive into, such as RACI, SPADE, Xanax, or even A/B testing.
Whatever the framework you chose, remember that they serve you, not the other way around. Be smart and apply some critical thinking to each decision you make even if they were brought up from a solid framework exercise. There are always nuances and variables that are impossible to be captured by tools.
Ultimately, your guts need to have a saying in your decision process. After all, there is no tool or framework that will substitute acquired experience.
Featured image source: IconScout

LogRocket identifies friction points in the user experience so you can make informed decisions about product and design changes that must happen to hit your goals.
With LogRocket, you can understand the scope of the issues affecting your product and prioritize the changes that need to be made. LogRocket simplifies workflows by allowing Engineering, Product, UX, and Design teams to work from the same data as you, eliminating any confusion about what needs to be done.
Get your teams on the same page — try LogRocket today.
A product manager’s guide to deciding when automation is enough, when AI adds value, and how to make the tradeoffs intentionally.

How AI reshaped product management in 2025 and what PMs must rethink in 2026 to stay effective in a rapidly changing product landscape.

Deepika Manglani, VP of Product at the LA Times, talks about how she’s bringing the 140-year-old institution into the future.

Burnout often starts with good intentions. How product managers can stop being the bottleneck and lead with focus.