Imagine you’ve set a high-priority goal for the upcoming quarter: improving your team’s productivity. You’re trying different initiatives to achieve this objective. As the quarter ends, you face a decision: should you continue investing to pursue this goal? Which of the initiatives that you applied had a positive impact, and which were a waste of time?

It’s hard to tell. Within the team, opinions diverge. Some see progress, while others perceive no visible change. You want to keep going, but without tangible evidence of success, convincing stakeholders to allocate more resources to improvements proves challenging.
Many organizations overlook the importance of data and metrics, viewing measurement as an added expense. This can lead to relying on intuition, which means navigating from point A to an unknown point B without a map.
Ultimately, reaching B will likely consume more time, effort, and emotional energy than anticipated. You might not even be aware of the additional costs you’ve incurred.
To alleviate this problem, you can utilize success metrics. Keep reading to learn what success metrics are, some of the key ones, and challenges that might arise when using them.
Success metrics are measurable parameters used to measure progress, effectiveness, and ultimately, success. These metrics encapsulate core objectives and enable you to track your trajectory toward achieving these objectives.
Whether you’re launching a new product, expanding into new markets, or streamlining internal processes, metrics are necessary if you want to objectively assess progress, and make effective decisions along the way. They help you understand what’s effective, what requires adjustment, and where to focus efforts for optimal outcomes.
Success metrics can be used in various industries and projects to evaluate performance and guide decision-making. Let’s explore some real-world examples:
Two common methodologies used in business to measure performance and guide decision-making are KPIs and OKRs. They are both important and serve different purposes.
These are metrics that act as barometers, measuring the baseline health of an organization or specific aspects of its operations. Imagine a dashboard showcasing various KPIs, such as customer satisfaction scores, revenue growth rates, and employee turnover rates. Based on the health of this KPI dashboard, certain metrics may stand out, signaling areas needing attention or improvement.
When there is an area for improvement identified, OKRs come into play. They represent the objectives an organization aims to achieve (objectives), along with the key results (key results), the specific, measurable outcomes that indicate progress towards achieving the objectives. Unlike KPIs, which measure the ongoing performance (business as usual), OKRs focus on setting ambitious, outcome-oriented goals and driving change.
OKRs and KPIs serve distinct purposes, but they can complement each other when used together strategically.
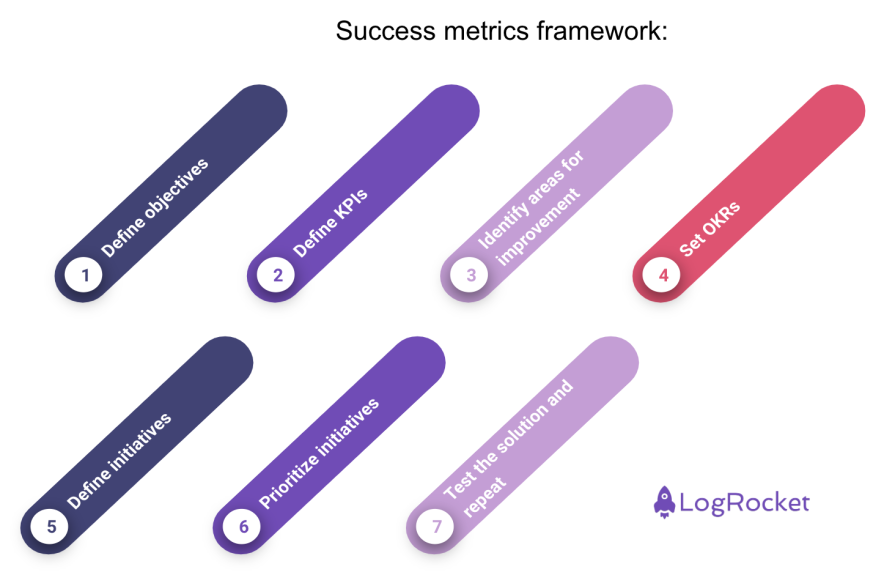
Let’s explore how you can leverage KPIs and OKRs in a structured approach, particularly within the context of a customer service center:

Integrating metrics into business practices isn’t always easy, and many organizations give up when faced with the initial challenges. Let’s explore some common challenges and pitfalls:
Despite these challenges, the benefits of leveraging data outweigh the negatives. To address these challenges effectively, it’s essential to:
Integrating metrics as a regular practice in your organization may initially feel daunting and challenging. However, the benefits far outweigh the initial hurdles. Patience is key in this process.
Over time, the process becomes more manageable, and you’ll develop a robust system for capturing data effortlessly.
With a well-equipped system in place, identifying patterns and trends becomes much easier, empowering you to make informed decisions. As you gain experience, you’ll refine your ability to formulate hypotheses effectively.
While the beginning may be the most difficult phase, in a few months time, you may find yourself wondering how you ever operated without the insights provided by metrics.
Featured image source: IconScout

LogRocket identifies friction points in the user experience so you can make informed decisions about product and design changes that must happen to hit your goals.
With LogRocket, you can understand the scope of the issues affecting your product and prioritize the changes that need to be made. LogRocket simplifies workflows by allowing Engineering, Product, UX, and Design teams to work from the same data as you, eliminating any confusion about what needs to be done.
Get your teams on the same page — try LogRocket today.

Maryam Ashoori, VP of Product and Engineering at IBM’s Watsonx platform, talks about the messy reality of enterprise AI deployment.

A product manager’s guide to deciding when automation is enough, when AI adds value, and how to make the tradeoffs intentionally.

How AI reshaped product management in 2025 and what PMs must rethink in 2026 to stay effective in a rapidly changing product landscape.

Deepika Manglani, VP of Product at the LA Times, talks about how she’s bringing the 140-year-old institution into the future.