Annual DevOps surveys provide a wealth of information about the characteristics that high-performing organizations share. The DevOps Research and Assessment (DORA) group sets the industry standards for metrics that track and organize this data to accurately assess an organization’s DevOps capabilities.

From this data, a pattern linking success to the mastery of technical practices has emerged. The DORA group outlines specific metrics to track and work towards in order to get the most out of your product.
In this article, you will learn what the DORA metrics are, how you can calculate them, and why you should implement them within your product team.
Since 2014, there has been an annual survey of DevOps practitioners that has steadily grown to have had more than 30,000 respondents.
Seeing the wealth of information available from these surveys, the DevOps Research Associates (DORA) team — started by Dr. Nicole Forsgren, Jez Humble, and Gene Kim — has parsed the data, and prepared annual reports.
It found that high-performing organizations tended to have:
Further analysis of the latest survey data by the DORA team revealed four types of DevOps organizations:
Now that we’ve looked at general DORA trends, let’s examine the 4 DORA metrics. The first two — deployment frequency and lead time — focus largely on speed (throughput), while the second two — change failure rate and time to restore service — focus on stability:
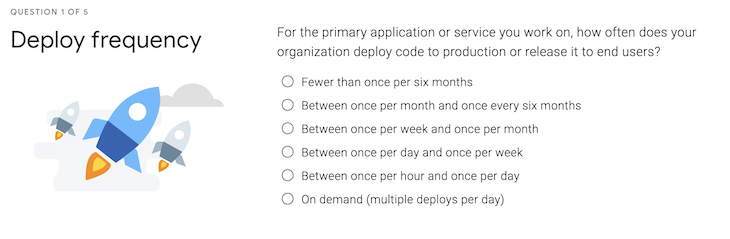
As its name suggests, deployment frequency indicates how often an organization successfully releases software to end users. This metric is an important data point and the DevOps survey data identified three different levels of organizational performance:
Deployment frequency can vary a great deal from business unit to business unit and even team to team. That being said, the survey data clearly shows that frequent deployments are strongly correlated with high-performing in organizations.
You can calculate deployment frequency by dividing the total number of deployments made in a given period of time by the total number of days in that period.
For instance, suppose that you’re focusing on the number of deployments per month and your team deployed code 10 times a month during a 31-day month. In this case, your team’s deployment frequency would be 10 divided by 31, or 0.32 deployments per day.
Lead time has been a key metric for decades in organizations that practice lean software development and leverage proven agile values, principles, and practices. Within the context of DORA metrics, lead time refers to the average amount of time that elapses between committing new code and releasing that code into production.
Lead time for changes is a key indicator because the shorter the amount of time that elapses, the greater the organization’s ability to get timely feedback from customers. This often leads to additional improvements to the software based on that feedback.
Shorter feedback loops are a hallmark of lean-agile organizations. The DORA team’s analysis of the DevOps survey data found three levels of lead time for changes:
There are many factors that directly impact lead time for changes. Some of those factors are related to organizational culture and team structure, such as the extent to which software changes need to be approved by separate testing teams and/or decision-makers focusing on compliance considerations such as security and privacy.
Technical factors inform lead time for changes as well, such as the number of software environments that exist, how much test automation is in place, and the maturity of technical practices such as continuous integration (CI) and continuous delivery/continuous deployment (CD).
To calculate lead time for changes, you need to pull data for the timestamp associated with code commits. Specifically, you’ll need timestamps for the initial code commit and the code push to production.
Thus, a formula for computing lead time for changes would need to take the median of the initial commit timestamp subtracted from the push to production timestamp.
For a detailed example of how to calculate the lead time for changes, see the DORA lead time for changes.
The change failure rate provides visibility into how often a deployment to production needs an immediate fix to address a degradation in product performance or an outage.
It’s important for organizations to monitor the change failure rate because the more time they need to spend on addressing problems, the less time they have available to deliver new features to customers. Furthermore, problems in areas such as product reliability and availability negatively impact the organization’s reputation. Analysis of the DevOps survey data shows the following three benchmarks for levels of organizational performance:
To calculate the change failure rate, it’s necessary to have the following available:
Note: When calculating change failure rate, you need to agree on definitions of what each of the terms above means.
To calculate the change failure rate, you start by subtracting the number of remediation-only deployments from production deployments, which gives you the number of failed deployments. Then you divide the number of failed deployments by the total number of production deployments.
The last of the four DORA metrics is time to restore service. DORA found the following three levels when considering the perspective of general organizational performance:
To calculate time to restore service, you’ll need to have a shared understanding of what incidents you’re including as part of your analysis. Once you’ve done that, it’s a reasonably straightforward calculation, where you divide the total incident age (in hours) by the number of incidents.
Let’s say that for the time period you’re looking at, you had five incidents that happened, where two lasted for an hour, two lasted for two hours, and one took three hours to resolve. Thus the calculation would be: (1 + 1 + 2 + 2 + 3) / 5 = 1.8 hours.
There’s a constant influx of tools related to DORA metrics. Because of this, rather than suggesting a particular tool or tool suite, let’s take a look at some general guidance. You should consider:
There are also a couple of free resources to be aware of:
The good news is that even in organizations that are just getting started, it’s not hard to get a quick read on how you’re doing. The DevOps Quick Check consists of five multiple-choice questions that provide immediate visibility into how you’re doing, along with possible next steps:
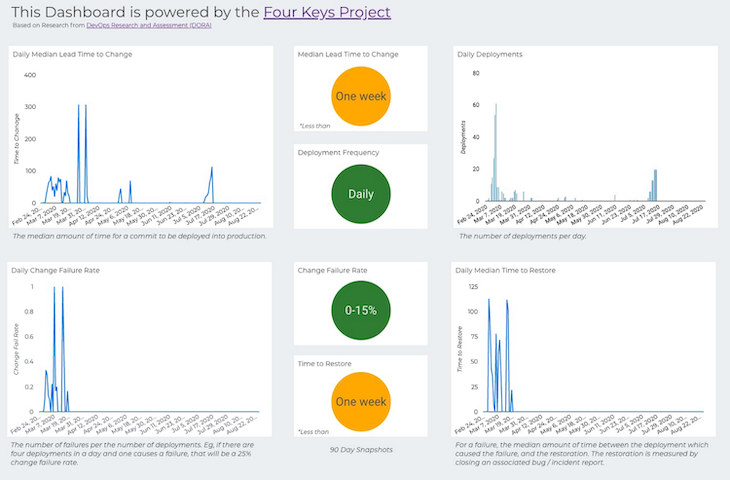
One of the most daunting challenges with DORA metrics comes down to data collection. In addition to various commercial tooling options, there is also an open-source alternative from Google’s Four Keys. Four Keys works through:
There are numerous advantages to capturing and evaluating data associated with the four DORA metrics. Those advantages include:
When using DORA metrics, especially if you’re just getting started, remember:
Because there’s so much data available related to the DORA metrics, seeing how you’re doing in each of the four areas gives you a quick read on your current capabilities. It’s especially important to understand any areas where you’re falling short, and steps you can take to bring yourself closer to your competitors.
Even if you’re already performing at a high level, monitoring your performance against the DORA metrics helps ensure that you continue to surface areas that need improvement.
Featured image source: IconScout

LogRocket identifies friction points in the user experience so you can make informed decisions about product and design changes that must happen to hit your goals.
With LogRocket, you can understand the scope of the issues affecting your product and prioritize the changes that need to be made. LogRocket simplifies workflows by allowing Engineering, Product, UX, and Design teams to work from the same data as you, eliminating any confusion about what needs to be done.
Get your teams on the same page — try LogRocket today.

Guard your focus, not just your time. Learn tactics to protect attention, cut noise, and do deep work that actually moves the roadmap.

Rumana Hafesjee talks about the evolving role of the product executive in today’s “great hesitation,” explores reinventing yourself as a leader, the benefits of fractional leadership, and more.

Trey Courtney talks about his process for evaluating partnerships or acquisitions and how he successfully implements these initiatives.

Asma Syeda shares the importance of responsible AI and best practices for companies to ensure their AI technology remains ethical.


