We live in an era where PMs worship dashboards, celebrate charts, and speak through metrics.

You walk into a product meeting, and it feels like you’re stepping into a war room of numbers. Lines go up and to the right. PowerPoint slides overflow with charts.
But somewhere between the rising curves and polished visuals, you might think to yourself: Are we actually getting better, or just better at reporting we’re getting better?
The truth? Not all metrics are created equal — some are signals, while others are noise.
And the difference between the two can determine whether your product grows, stagnates, or quietly drifts into irrelevance.
It’s easy to think that more data equals better decisions. We tell ourselves that we need to track everything, as if every click, scroll, and tap holds a secret that’ll change everything.
That said, dashboards can easily become noisy. Clicks, pageviews, downloads, and promise insights but often deliver distractions. They can make you feel productive without telling you anything useful.
You can optimize a landing page to increase signups by 40 percent. But if none of those users ever activate, what did you really achieve?
Metrics feel good. They give you a dopamine hit, fill slide decks, and offer easy wins. However, they rarely correlate with the things that actually matter like retention, revenue, satisfaction, and growth quality.
A great product isn’t the one with the most downloads; it’s the one that people come back to, the one that users are willing to pay for, and the one that integrates into their lives so deeply that not using it feels weird.
Progress isn’t just motion. If your metrics aren’t connected to long-term value creation, you’re just dressing up activity as achievement.
Signal metrics are different — they’re quiet, they don’t always spike, but they honestly reveal the health of your product (sometimes even uncomfortably).
Four factors make a metric a signal:
Try asking yourself, “What number, if it steadily increased, would convince me our product is truly working?”
That’s your signal.
Clarity begins with focus. To help with this, you can lean on a popular PM framework called one metric that matters (OMTM). It’s not about ignoring all other metrics. It’s about elevating one that represents your product’s heartbeat above the rest.
Think of it as your product’s North Star:
Some famous examples include:
Your OMTM evolves as your product grows. In early-stage startups, activation rate or weekly retention might matter most. Later, it could be expansion revenue or net promoter score.
But the rule holds: Pick one. Align around it. Use it to cut through noise.
Blockbuster didn’t fall because it lacked data. It had plenty of it.
It knew exactly how many DVDs customers rented, as well as the revenue it earned from late fees and its in-store foot traffic. All those numbers looked great, until they didn’t.
What it missed were the customer frustrations that weren’t in the metrics. Driving to a store was a hassle, people hated late fees, and the overall experience was becoming increasingly inconvenient. But none of that was showing up in its dashboards.
Netflix, on the other hand, paid attention to human behavior. Its DVD-by-mail model removed friction with no late fees and no due dates. Then, it bet early on streaming, not because data said “this is urgent,” but because it observed rising broadband adoption and shifting user expectations.
Netflix saw signals. Blockbuster clung to noise.
The result? Blockbuster filed for bankruptcy in 2010. Netflix has over 230 million subscribers today.
Before 2007, the smartphone market had clear rules: small screens, physical keyboards, and styluses.
BlackBerry ruled because it was optimized for utility. People liked buttons and trusted what they could touch.
Apple ignored it all. It didn’t chase what people said they wanted, it studied what people struggled with: complex menus, hardware clutter, and confusing interfaces.
The iPhone broke every convention by removing the keyword and adopting dynamic touch and a full-screen interface. It wasn’t based on surveys. In fact, surveys would’ve said don’t do it.
But Apple built for a behavior that hadn’t fully formed yet. It trusted intuition backed by observation.
Finding signal metrics isn’t a guessing game. It’s not about following what everyone else is tracking and it’s certainly not about copying the dashboard of a unicorn startup and hoping it fits your context.
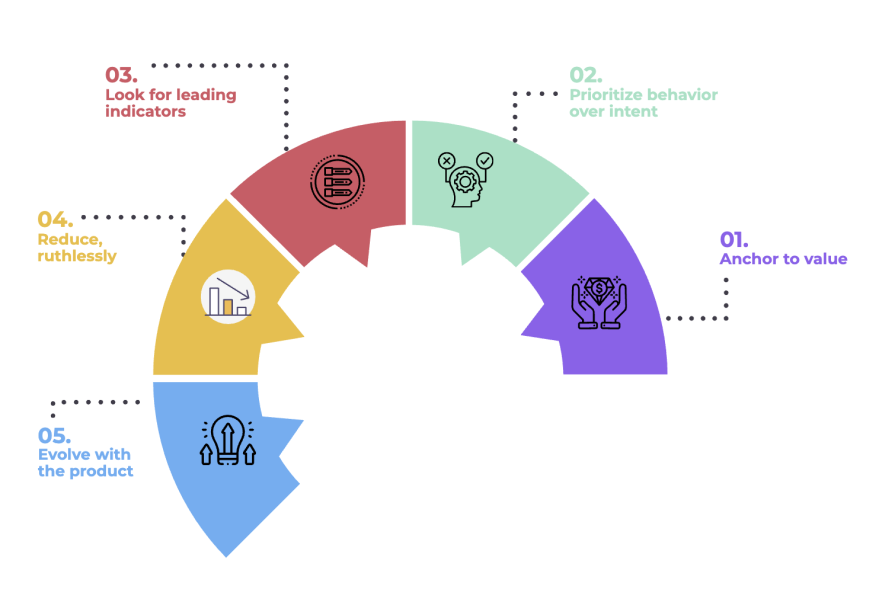
You discover signal metrics through repeatedly asking what really matters, not just what looks impressive. They emerge when you’re honest about your product’s goals, your users’ behaviors, and the stage of your company:
Start with the end in mind: What do your users truly value? This is the most fundamental and commonly misunderstood question a product team can ask.
“Value” isn’t just what makes a user smile in a survey. It’s the thing they consistently come back for. It’s what makes them open your app at 7am.
Once you’ve identified that value, reverse-engineer your metrics to track how well you’re delivering it.
For example:
Look for metrics that mirror user reliance, the kind of behavior that, if taken away, would disrupt the user’s workflow or lifestyle. Talk to power users, not just new users. Ask them what they couldn’t live without in your product. Then, find a way to measure how many others are experiencing that same thing.
People are kind in surveys and promise to return.
But their behavior tells the truth.
A user might tell you they love a feature, but if they haven’t used it in three weeks, that tells you more than their words ever could.
Track actions, not opinions:
When it comes to product development, usage data is king. It tells you whether your product is delivering consistent, real-world value.
Many teams obsess over lagging indicators like churn rate, total revenue, and monthly active users.
Those are important, yes. But they’re outcomes. They tell you what happened after the game was played. The best product decisions come from spotting what will happen next.
That’s why leading indicators, metrics that predict future success, are so crucial.
Examples of leading indicators include:
These are signals that precede the metrics your executive team obsesses over. Look back at retained users and ask yourself, “What did they do in their first session that non-retained users didn’t?” The difference is often your leading indicator hiding in plain sight.
There’s a popular lie in product culture that “If we just track everything, we won’t miss anything.”
But tracking everything doesn’t make you data-driven — it makes you data-distracted.
Every extra metric on your dashboard is another potential detour. It might look interesting but if it doesn’t help you make a decision, it’s not helping you build.
Start by auditing your current dashboards. For every metric, ask:
If you don’t get clear answers, it’s noise. Kill it. Go from dashboards with 40 charts to ones with four useful ones. Prioritize quality over quantity.
Try this exercise with your team: “If we had to make a go/no-go product decision tomorrow and could only keep three metrics, which would they be?” You’ll be surprised what ends up on the cutting room floor.
What matters when you’re pre-product-market fit won’t matter post-Series A. The activation metric that worked when you had 1,000 users might become irrelevant at 100,000.
Don’t fall in love with metrics just because they worked once. Success today may mask stagnation tomorrow.
Your evolution might look something like this:
Build a habit of quarterly metric reviews. Treat your metric strategy like your product roadmap: dynamic, adaptive, and stage-aware. Schedule “metric retros” the same way you schedule sprint retros.
As a product manager, you face a daily war between clarity and complexity.
It’s easy to hide behind charts and justify decisions with shallow metrics. But great product teams resist that urge. They cultivate the discipline to ask: What truly matters?
Building great products isn’t about tracking everything — it’s about tracking the right things, with just enough humility to know when even those need to change.
Remember: The most important metric isn’t the one that spikes, it’s the one that compounds.
Featured image source: IconScout
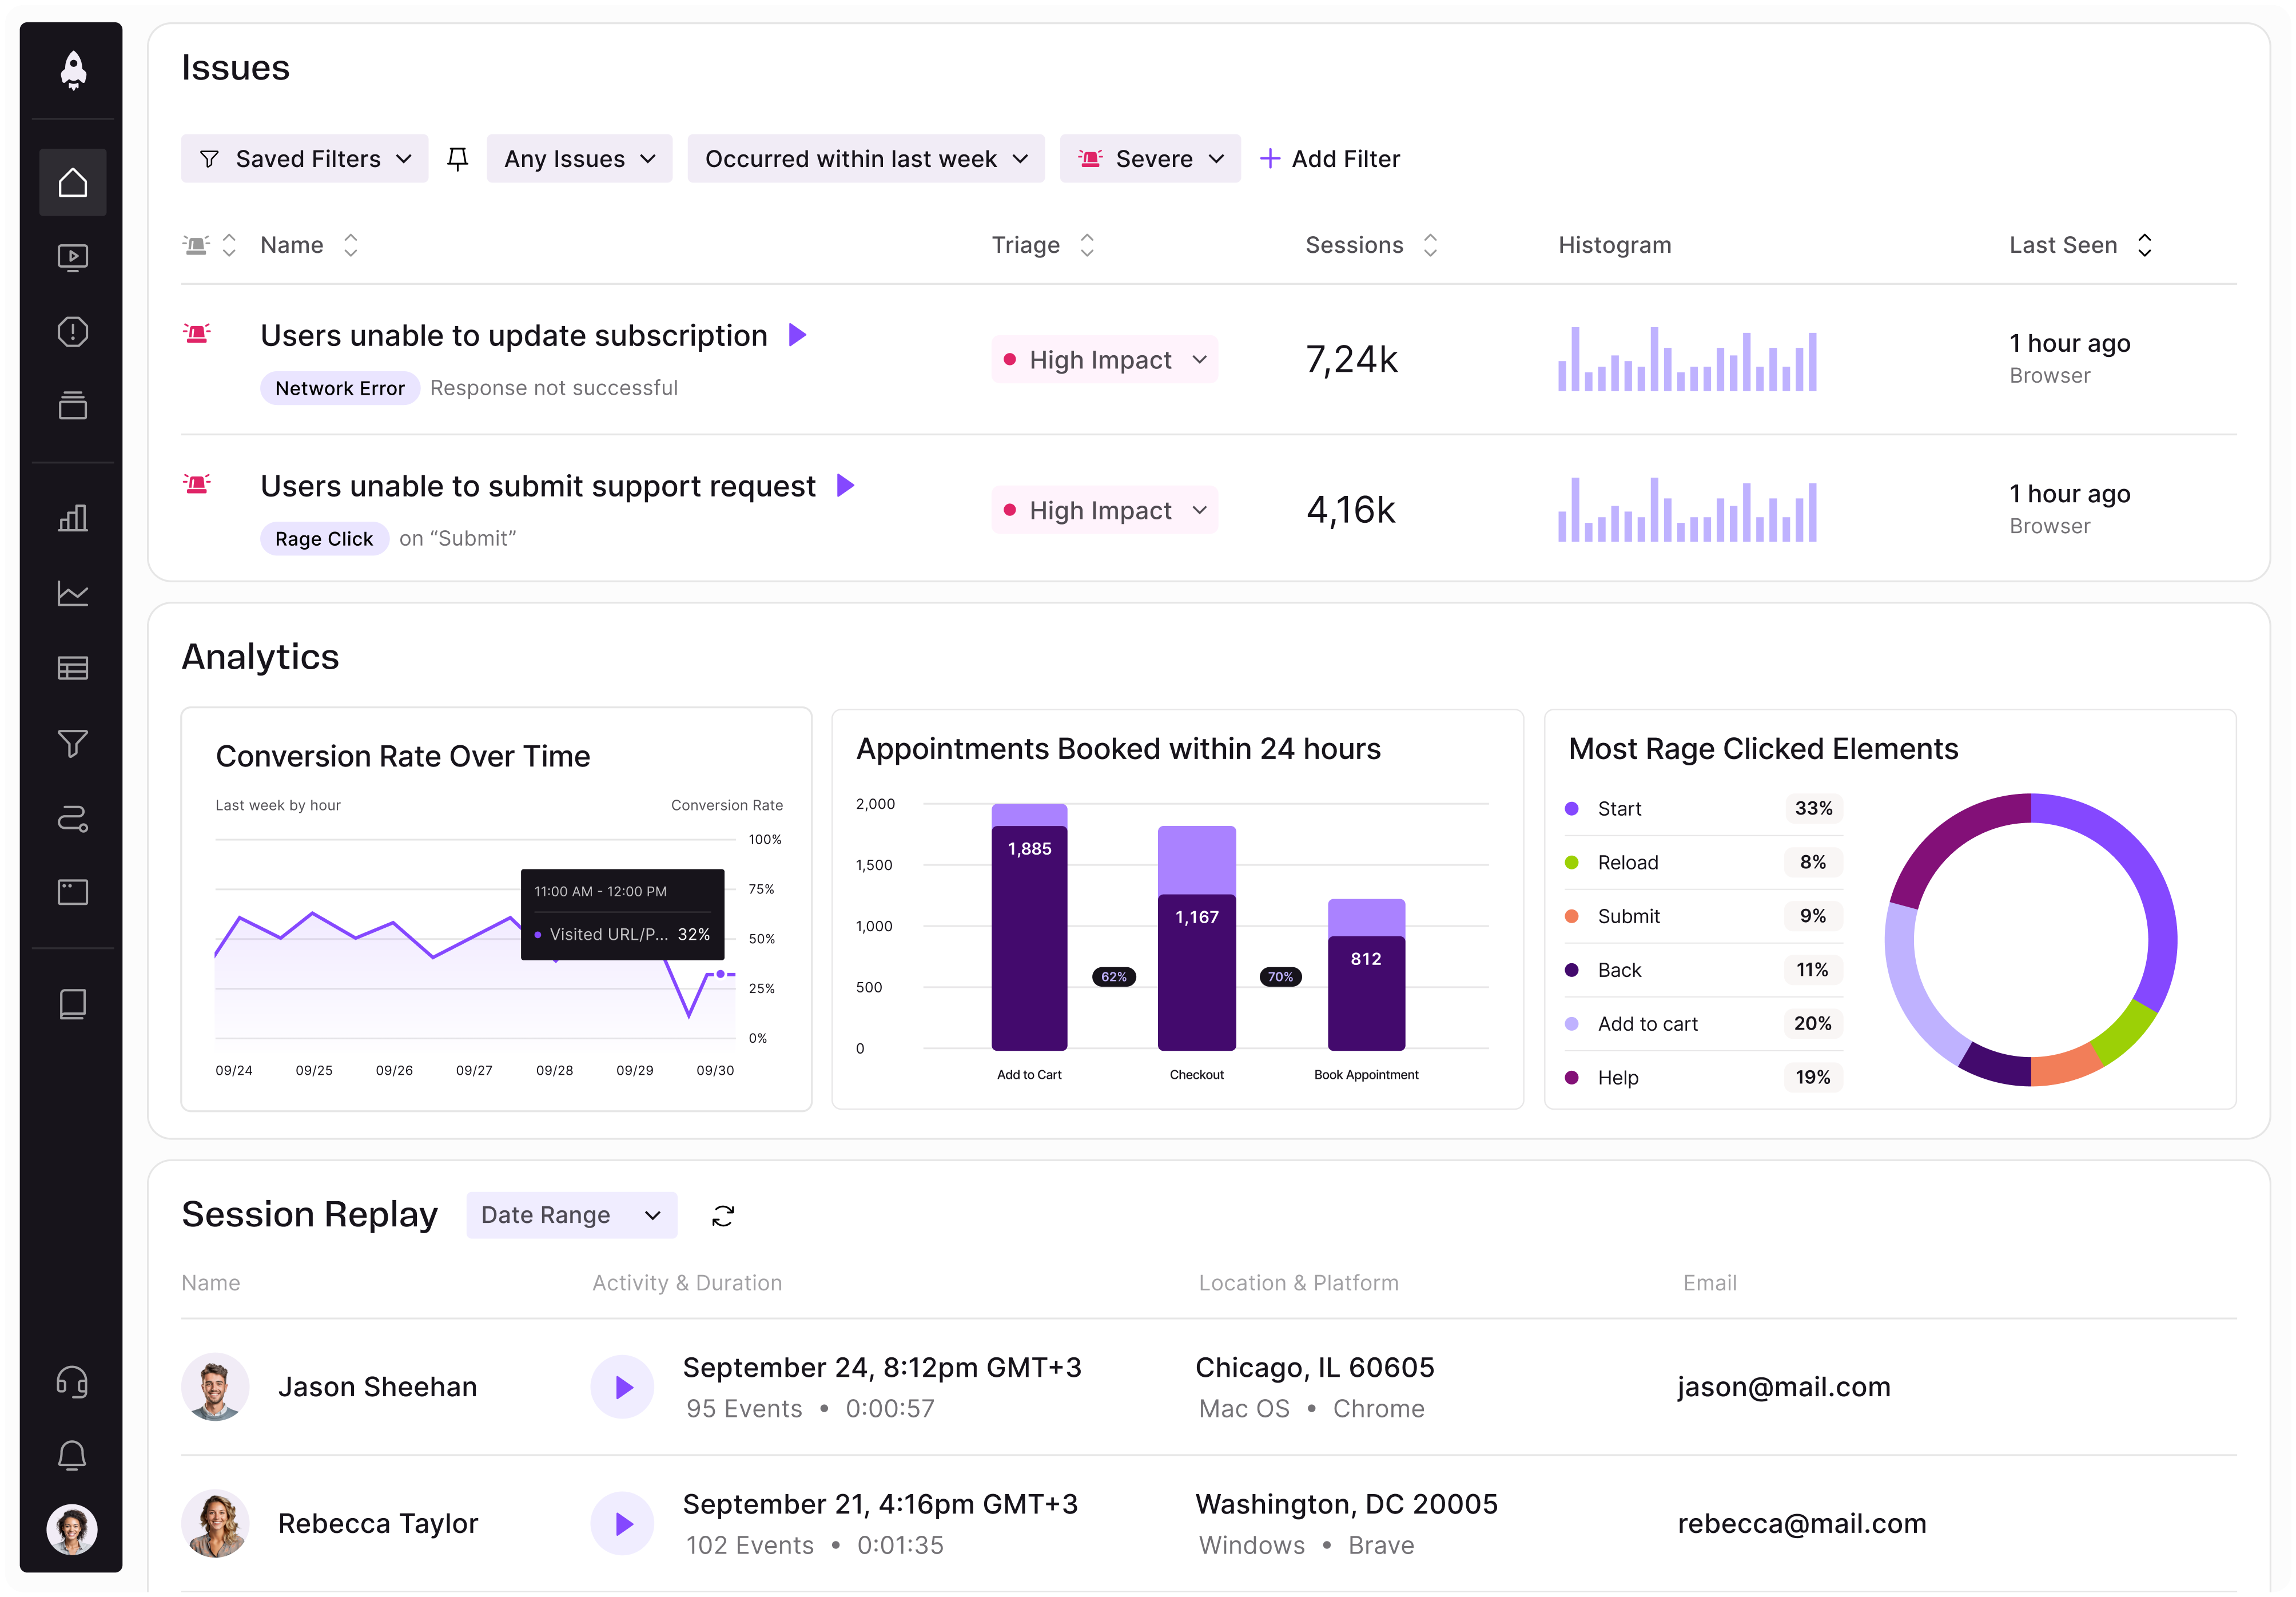
LogRocket identifies friction points in the user experience so you can make informed decisions about product and design changes that must happen to hit your goals.
With LogRocket, you can understand the scope of the issues affecting your product and prioritize the changes that need to be made. LogRocket simplifies workflows by allowing Engineering, Product, UX, and Design teams to work from the same data as you, eliminating any confusion about what needs to be done.
Get your teams on the same page — try LogRocket today.

Learn how product managers can use human-in-the-loop AI to manage decision risk, set oversight, and keep ownership and accountability human.

Learn how to choose and adapt product management frameworks based on your product stage, constraints, problem type, and business context.

Learn when streaks improve retention, when they create fragile engagement, and how PMs can design healthier systems around user progress.

A technical debt register brings transparency and clarity as to what type and how much debt you have and can be used to monitor and review your debt ratio.


