It should be no surprise that an essential step to delivering valuable products to users is finding out what their needs and problems are. We are living in the experience economy, after all, where everything revolves around the customer.

But how can we achieve this user-centeredness? And more importantly, how can we do this efficiently and effectively? User research (or UX research) plays a crucial role.
Theoretically, user research methods can be categorized by the following criteria:
We will focus in this article on the split — qualitative and quantitative research.
Qualitative and quantitative user research methods have roots in different academic disciplines and fields of study. Sociology and psychology are the backbones of qualitative methods and mathematics, statistics, and economics for qualitative methods.
Qualitative research methods aim to explore subjective experiences, attitudes, and perceptions to gain a deeper understanding of the underlying meaning and context of the data. Qualitative research can sometimes be hard to visualize since it’s not based on numbers or hard data.
On the other hand, quantitative research methods rely on empirical data and statistical analysis to conclude user behavior, attitudes, and preferences.
Both qualitative and quantitative research methods have evolved. They have been adapted for use in various fields, including user experience research, product design, marketing, and social science research. They each have their strengths and limitations and are often used in combination to provide a more comprehensive understanding of user needs and behavior.
Whenever you choose a research method — qualitative and quantitative — you must consider its strengths and weaknesses:
| Qualitative research | |
| Strengths | Weaknesses |
|
|
| Quantitative research | |
| Strengths | Weaknesses |
|
|
So which methods are used in the user research field? Let’s take a look at some of the most common ones.
There is a range of ways to obtain qualitative research. This list gives a handful of very practical ways to collect qualitative data but is not exhaustive by any means:
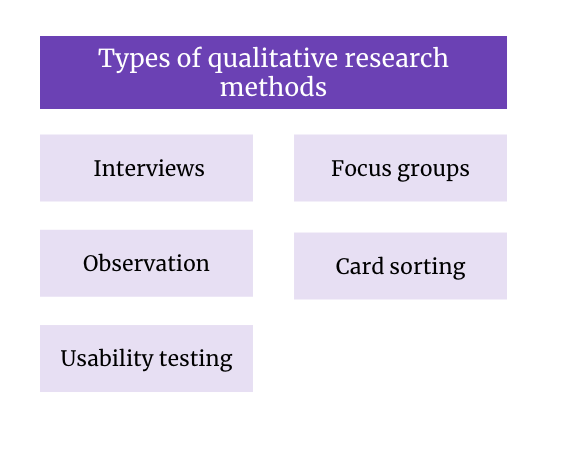
An interview involves asking individuals or groups open-ended questions to gain insights into their experiences, perceptions, opinions, and behaviors. Use interviews to explore complex or sensitive topics, gain a deep understanding of individual experiences, or get rich and detailed data.
When doing interviews, it’s important to try to remove as many biases as possible. There are several biases you can fall prey to, such as confirmation bias. This is when interviewers specifically look for answers that confirm what they already believe. Having a neutral interviewer here can help rid that.
Another common interview bias is using leading questions. This is extremely common but can dramatically skew the results of your findings. Leading questions are phrased in a way that suggest a certain answer and can sway or pressure the interviewee to answer along those lines. For example, asking “Do you think this feature is easy to use?” is a leading question because the interviewer suggests that it could be easy to use. Saying something like “Can you explain how you used this feature? Was there anything that you found particularly challenging?” removes that bias.
You want to use an interview when you are looking for in-depth, qualitative information from users, especially in the discovery and research phases.
Focus groups involve bringing together a small group of people to discuss a specific topic or issue. They’re especially helpful to understand group dynamics and social norms. Focus groups explore differences and similarities between people’s opinions and also generate new ideas and insights.
It’s important to have an experienced focus group leader to lead the sessions. They can help bring the group back on track if they go off on a tangent and can ensure that everyone gets equal participation. It’s not uncommon to have one or two people dominate the group, so having someone there to level the discussion playing field can mitigate this issue.
Use a focus group in the discovery and ideation phases when you are looking to get people’s opinions. Pay extra attention to the pitfalls, as people tend to respond in a socially-desirable way.
This is pretty self-explanatory — observation is a research method that involves observing and documenting people’s behavior and interactions in a neutral or controlled setting.
You can use observations to understand people’s behavior and decision-making in a particular context. This is great for user testing because you can identify pain points and areas for improvement. It’s one thing to think you’re accounting for all the potential users’ issues and another thing to see them interact with your product without intervention. On the flip side, observation can also help you verify self-reported data.
You can use observation in the discovery phase to better understand how your users perform a task, as well as in usability testing sessions to observe users interact with a proposed solution.
This research method asks participants to group items or features into categories based on their understanding. Card sorting can be used during the design phase to determine how users perceive and group different product features.
Card sorting is best suited in the discovery and design phases to make sense of the user’s mental models and how it makes sense to them to group different topics. This is a great technique, especially if you consider information architecture or how to group items in a menu.
During usability testing sessions, participants have to complete tasks using a product while their interactions are observed and recorded. Usability testing can be used during the design and development phases to identify usability issues and optimize product features for user experience.
Usability testing is not to be confused with observation, as usability testing asks users to complete specific tasks while using the product. Your role is to then gather feedback on the ease of use and effectiveness of the product.
Use this technique to uncover usability issues in concepts early on when you have a prototype.
Next, we’ll go through quantitative research methods. The analysis that follows is usually a little more straightforward, as you can create charts, graphs, and visuals using sets of the collected data:
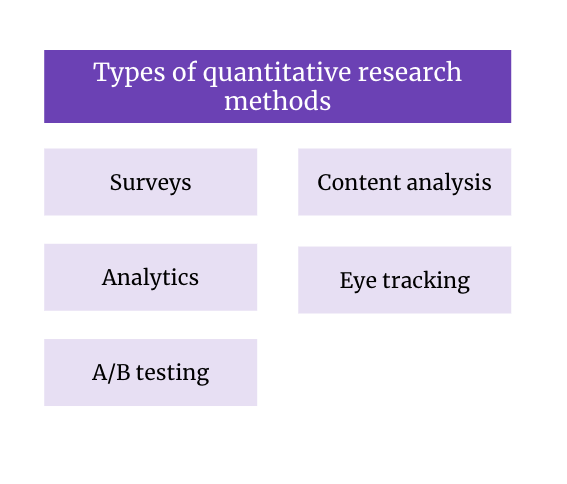
Surveys aim to collect standardized, structured, qualitative data from a large sample of people through questionnaires or online forms. It’s best to use surveys when you collect data on a large scale. They’re a great way to measure people’s attitudes, opinions, and behaviors, or test hypotheses and theories. Remember that surveys are self-reported, though, which implies an element of bias. People may respond in a way that’s more ideal of an answer to them than what the reality is.
The wording of surveys is important. The element of leading questions presents itself here too, so make sure to have a few people go over the survey questions before you send them out.
Finally, though it may seem a little elementary, always double-check the survey scale for each question. If you’re asking respondents to report their age, make sure you’re not double counting ages in the range (for example, 18-24 and 24-30 both include 24, so respondents will not know which range to put down).
Use surveys to get quick, qualitative insights from your users, especially when you aim to get many results. You can use them in the discovery phase to uncover common needs or in the delivery phase to measure user satisfaction with a solution or a certain feature.
Content analysis is all about analyzing and categorizing textual or visual data to identify patterns, themes, and meanings. Use content analysis when you need to analyze large amounts of data, identify trends and patterns in user-generated content, or evaluate the effectiveness of communication strategies.
Content analysis is especially important in the discovery phase when you are looking at secondary data sources, such as reports created by others.
Analytics involves using quantitative data from digital platforms, such as websites or mobile apps, to gain insights into user behavior, usage patterns, and performance metrics. Use analytics to understand user engagement and retention, track user journeys and conversions, or optimize product features and designs based on data-driven insights. There are many tools out there to do this for digital products, including LogRocket.
User analytics are very important for a product, especially after it has an established user base. Make sure to plan to incorporate analytics as early as possible and define your funnels to get the data you actually need.
This quantitative research method uses special technology to track eye movements while users interact with a product. Eye tracking can be used during the design phase to optimize product layouts and see how users navigate a product visually.
Eye tracking can be used with both prototypes or existing solutions to uncover navigation patterns and usability issues.
Finally, this quantitative research method compares two versions of a product (A and B) to see which performs better. A/B testing can be used during development and deployment to optimize product features and design elements.
Use A/B testing when you experiment with a new feature and are not sure whether deploying it will move the needle in the right direction for your objectives.
Before you do anything, you first need to work out your research goal and questions. They will give you the necessary information that’ll enable you to decide which method to use.
To provide a starting point, let’s look at the research methods mentioned above and which phase of the product development cycle they are most appropriate for:
| Research Method | Discover (Define the problem) | Design
(Ideate solutions) |
Develop
(Build the solution) |
Deploy
(Launch and measure) |
| User interviews | X | X | ||
| Focus groups | X | X | ||
| Usability testing | X | X | X | |
| Card sorting | X | X | ||
| Surveys | X | X | X | X |
| A/B testing | X | X | X | |
| Content analysis | X | |||
| Analytics | X | X | ||
| Eye-tracking | X |
Now that we have discussed the difference between qualitative and quantitative user research methods, let’s get more practical and look at an example.
For the sake of this exercise, we are a team working for WhatsApp looking to add a “stories” feature, similar to the ones provided on Snapchat and Instagram. Stories are a fun and engaging way of sharing updates with your contacts, and they can also be used by businesses to promote messages and services.
Depending on the phase of product development we are in, the research goals and questions may differ:
| Product lifecycle | Research goal | Research questions |
| Discover | To understand the user need and potential demand for a stories feature on WhatsApp |
|
| Design | To determine the optimal design and user experience for the stories feature on WhatsApp |
|
| Develop | To test and optimize the technical implementation of the stories feature on WhatsApp |
|
| Delivery | To evaluate the success and impact of the stories feature on WhatsApp following its release |
|
Now that we’ve defined our research goal and questions, let’s choose the appropriate research methods and plan for our research:
| Product lifecycle | Research questions | Research methods |
| Discover |
|
|
| Design |
|
|
| Develop |
|
|
| Delivery |
|
|
Once you’ve identified the research methods to use, start creating the research instruments, run the research, and then analyze the results to formulate some recommendations and conclusions.
User research is a crucial step in each product development lifecycle and should not be ignored. Depending on the research question, you may want to use either qualitative or quantitative methods or a mix of both.
Featured image source: IconScout

LogRocket identifies friction points in the user experience so you can make informed decisions about product and design changes that must happen to hit your goals.
With LogRocket, you can understand the scope of the issues affecting your product and prioritize the changes that need to be made. LogRocket simplifies workflows by allowing Engineering, Product, UX, and Design teams to work from the same data as you, eliminating any confusion about what needs to be done.
Get your teams on the same page — try LogRocket today.

Maryam Ashoori, VP of Product and Engineering at IBM’s Watsonx platform, talks about the messy reality of enterprise AI deployment.

A product manager’s guide to deciding when automation is enough, when AI adds value, and how to make the tradeoffs intentionally.

How AI reshaped product management in 2025 and what PMs must rethink in 2026 to stay effective in a rapidly changing product landscape.

Deepika Manglani, VP of Product at the LA Times, talks about how she’s bringing the 140-year-old institution into the future.