Improving your product is essential if you want to achieve long-term growth and profitability. The challenge is that improving a digital product involves a lot of subjectivity.
We all know examples of companies that have invested a lot of money and effort to redesign their website only to find out that users hate it. A/B testing is a framework that helps you make informed decisions based on user feedback.
In this article, we’ll review what A/B testing is and demonstrate how you can use it to optimize your products and features.
We’ll also implement a demo application in React Native, but you can easily adapt it to work on the web. We’ll run our example A/B test using Optimizely, one of the most popular split testing tools on the market.
A/B testing, or split testing, is a way to compare two or more versions of the same thing (e.g., a page, screen, text, feature, etc.) and determine which one performs better. It involves running experiments where we compare an existing variant (control variant) against a new variant (test variant).
Here is what A/B testing looks like in practice:
A few important things to note here:
First, it is not mandatory to split the traffic into 50/50 percentages. It’s perfectly normal to send 90 percent of the traffic to the existing variant and only 10 percent to the new one.
Second, as mentioned above, you need enough data for the experiment to be statistically relevant. You cannot draw a conclusion based on a few interactions. Calculating statistical significance isn’t easy, but any A/B testing platform worth its salt (such as Optimizely) will compute this for you.
Now that we understand how the process works, let’s review a few examples of things you can improve by A/B testing:
Well-crafted content can help in driving more sales. The more content you create, the higher your chance to position high on the search results page for high-volume queries.
Common strategies companies use to create content at scale include:
When it comes to optimizing content, marketers often A/B test calls to action, page titles, subheadings, or any other relevant bits of content that might hook readers into, for example, signing up for a free trial of your product.
The user interface is one of the most commonly A/B-tested features of any product, app, or website.
Whether we’re talking about changing the color of a button or a complete application redesign, it’s a good practice to run an A/B test before committing to a plan of action.
Even if you think your UI looks good, your customers might have a different opinion.
A/B testing is not only about testing the frontend of your product or service; you can also test different subscription models, prices, or other features.
Agile values and principles espouse embracing change. The environment is constantly evolving, and change is something we can use to our advantage.
To be competitive, not only should we anticipate change, but we should welcome it. A/B testing helps you validate whether changes to your app will attract more customers and/or enhance the user experience for existing customers.
Let’s say you want to launch a new and fancy feature. The change is a big one, and you expect some friction.
Instead of rolling out this feature to everyone, you can A/B test it with a small percentage of the traffic. If everything works well, you are good to go. If not, it’s back to the drawing board.
Success will look different for different types of products/features. Learn more about how to measure success after a product launch.
To show how A/B testing works with a practical example, we’ll implement a small demo application in React Native where we test the background color of a button.
The experiment has two variants: green and blue.
Our demo application will look like this:
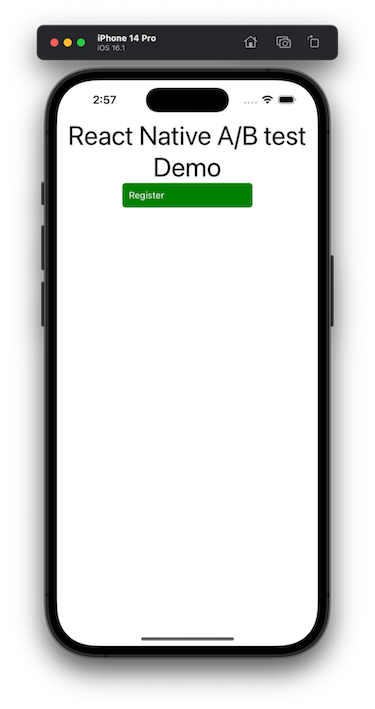
The final application is available on GitHub.
To manage the A/B test, we’ll use Optimizely, a popular tool for managing digital experiences. There are lots of alternatives out there, and they all have similar features. Feel free to replace Optimizely with what works for you.
If you want to follow along with this demo, go ahead and create an account on the Optimizely website.
Before showing you how to configure the experiment, I want to introduce the concept of a feature flag. A feature flag is a piece of software used for enabling or disabling functionality, which is how all these A/B test platforms work.
For our example, we’ll create a feature flag for the button background color.

Next, we need to create two variations:
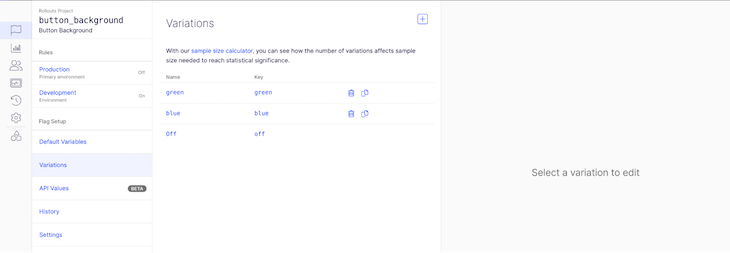
Now we can create the experiment. We also need to specify an event to track. When the user clicks on the button, we will fire this event. That’s how we measure the outcome of the experiment.
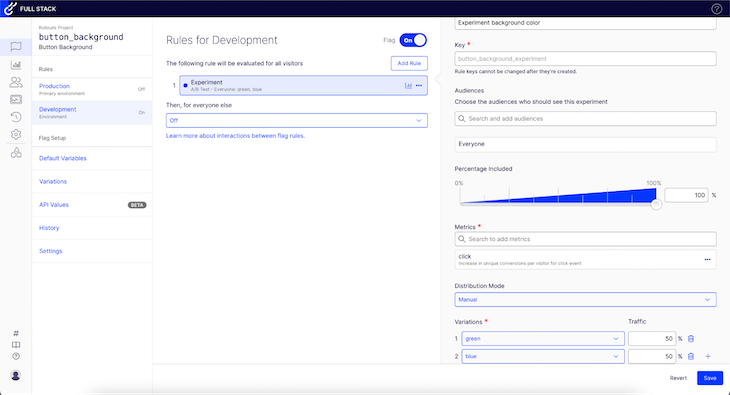
As you can see, we are splitting the traffic equally between the two variants.
Now let’s create the application:
npx react-native init rnabtest
Next, install the Optimizely SDK and its dependencies:
yarn @optimizely/react-sdk
yarn add @react-native-async-storage/async-storage
yarn add @react-native-community/netinfo
Modify the App.js file:
import {
  createInstance,
  OptimizelyExperiment,
  OptimizelyProvider,
  OptimizelyVariation,
} from '@optimizely/react-sdk';
import React, {useId} from 'react';

import {Pressable, SafeAreaView, StyleSheet, Text, View} from 'react-native';

const App = () => {
  const userId = useId();

  const optimizely = createInstance({
    sdkKey: 'YOUR_SDK_KEY',
  });

  return (
    <OptimizelyProvider optimizely={optimizely} user={{id: userId}}>
      <SafeAreaView>
        <View style={styles.container}>
          <Text style={styles.title}>React Native A/B test Demo</Text>
          <OptimizelyExperiment experiment="button_background_experiment">
            <OptimizelyVariation variation="blue">
              <Pressable
                style={[styles.button, {backgroundColor: 'blue'}]}
                onPress={() => optimizely.track('click')}>
                <Text style={styles.text}>Register</Text>
              </Pressable>
            </OptimizelyVariation>
            <OptimizelyVariation variation="green">
              <Pressable
                style={[styles.button, {backgroundColor: 'green'}]}
                onPress={() => optimizely.track('click')}>
                <Text style={styles.text}>Register</Text>
              </Pressable>
            </OptimizelyVariation>
          </OptimizelyExperiment>
        </View>
      </SafeAreaView>
    </OptimizelyProvider>
  );
};

const styles = StyleSheet.create({
  container: {
    justifyContent: 'center',
    alignItems: 'center',
  },
  title: {
    fontSize: 40,
    textAlign: 'center',
  },
  button: {
    width: '50%',
    borderRadius: 5,
    padding: 10,
  },
  text: {
    color: '#fff',
  },
});
export default App;
The Optimizely SDK needs a unique user ID to correctly split the traffic and compute the metrics. We are using the useId() hook to simulate this.
Then, add the SDK key, which you can find in your account under Settings > Environments > Development. OptimizelyProvider needs to wrap up any experiment you create.
Next, initialize the experiment and add the blue and green variations. For the experiment and variations props, we must use the exact values from the Optimizely website.
If we check the logs, Optimizely SDK should log something like this:
INFO [OPTIMIZELY] - INFO 2022-11-08T12:08:57.115Z DECISION_SERVICE: User :r0: is in variation green of experiment button_background_experiment.
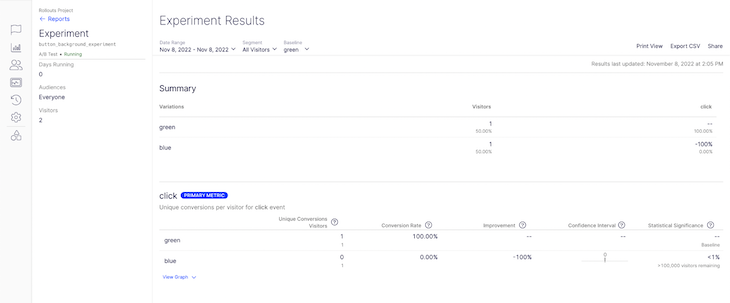
You can see the results in the Reports section on the Optimizely website.
There are numerous ways you can take advantage of A/B testing. A/B testing helps you make more informed, data-backed decisions around content and UI optimization, change management, product/feature roll-outs, and more.
Because it is so powerful and easy to implement, A/B testing is a must in today’s software development landscape.
Featured image source: IconScout
LogRocket identifies friction points in the user experience so you can make informed decisions about product and design changes that must happen to hit your goals.
With LogRocket, you can understand the scope of the issues affecting your product and prioritize the changes that need to be made. LogRocket simplifies workflows by allowing Engineering, Product, UX, and Design teams to work from the same data as you, eliminating any confusion about what needs to be done.
Get your teams on the same page — try LogRocket today.

The continuous improvement process (CIP) provides a structured approach to delivering incremental product enhancements.

As a PM, you’re responsible for functional requirements and it’s vital that you don’t confuse them with other requirements.

Melani Cummings, VP of Product and UX at Fabletics, talks about the nuances of omnichannel strategy in a membership-based company.

Monitoring customer experience KPIs helps companies understand customer satisfaction, loyalty, and the overall experience.