What is the customer willing to pay for the product? Which product features are important for selling the product? Which features should the product development team prioritize? Which features are more important, and which are less important?

Have you ever asked yourself some of these questions and wanted to know the answer in an objective way? If so, you should consider implementing conjoint analysis into your market research.
In this article, you will learn what conjoint analysis is, how to design and execute it, and read examples of its implementation within product teams.
Conjoint analysis is a statistical method often used by product managers to conduct market research and evaluate how customers value different product attributes.
For product managers, it’s important to know which attributes of the product increase the perceived value for the customers the most. This way you can focus on the most valuable features first and gain higher returns on investments in the development of the product.
Conjoint Analysis is one of the tools which can be used to gain these insights. The base assumption is that each product can be divided into different product attributes or product characteristics like product features, design elements, or price.
Consumers compare products with these attributes to find and buy a product that suits them the best. These attributes vary from product to product and are an important factor that customers use to determine the value of those products. So, these variations are used by product managers to create unique selling propositions (USPs) and find a product market fit.
With conjoint analysis a product managers can:
In conjoint analysis, a product is broken down into its attributes and characteristics. The product manager identifies the attributes that are of the greatest interest for the conjoint analysis and collects the characteristics of these attributes for his product and competing products.
The attributes can include product features, design elements, prices, and brand names.
As these attributes differ between products, these differences can be used in customer surveys to identify customer preferences and gain insights for product development.
The product manager defines these differences per attribute in a set of levels like:
Each product is listed in product profiles and presented to potential customers in surveys with specific questions.
The type and style of how these surveys are built differ depending on the type of conjoint analysis you choose.
There are:
Here is an example of a simple conjoint analysis comparing three different recruitment apps:
We will consider four attributes:
Each attribute has up to three levels:
Below is a table visualizing the three profiles of the apps:
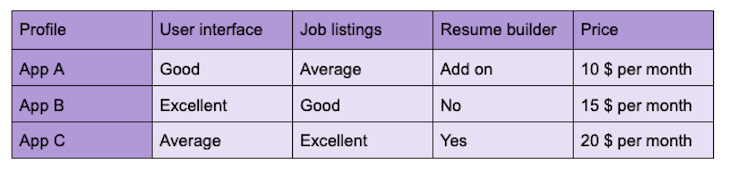
The respondents will be asked to rank these apps in order of their preference, from most preferred to least preferred. For example, their ranking might look like this:
Another respondent’s ranking might be:
After collecting rankings from multiple respondents, the data will be analyzed to determine the utility values for each attribute level and the overall preference for each app. The results will help identify which attributes are most influential in driving app preferences and which app is most preferred overall by respondents.
The analysis of the data is a mathematical process. Analyzing conjoint survey results is complicated and prone to measurement errors. Often participants don’t know exactly why they choose one thing over the other.
Survey results can induce substantial bias in any direction and by any amount; this bias must be corrected with mathematical processes. Econometric and statistical methods are used to estimate a utility function for each attribute and level of the attribute.
These utility functions indicate the perceived value of the attribute and show how consumer preferences are prone to change when the level of the attribute changes.
To design and execute a conjoint analysis study, you must be clear about the objective of the research. Depending on the objective and the complexity of the questions, the study needs to be designed in different ways and different conjoint analysis types can be chosen.
The desired outcome could offer insights such as:
After setting the objective the product manager must:
With the results of the conjoint analysis survey and the mathematical model in the background, you can even use the model to simulate how the preference will change for a certain product when attribute levels are changed.
Conjoint analysis is not bound to physical products. It can be used across all industries for physical products and services alike. You can also use it for different scenarios like identifying the right price or improving the product and service offering.
The following case studies illustrate how you could use conjoint analysis:
A company producing rowing machines was using conjoint analysis surveys to evaluate which features are most important for younger consumers who want to stock up on their home gyms. They asked different questions about the features of a new rowing machine model and found out that younger buyers would like to have rowing machines with the following attributes:
They found out that different groups prioritize different things first. One group preferred convenience and quiet use, another prioritized high-tech interactive features, and another mainly looked at the price.
To optimize their products and services, a big pest control company used conjoint analysis to gain insights into the demands of modern customers. They asked in a survey what an improved mousetrap should look like. They figured out that:
After developing some of these insights customer satisfaction increased.
A phone answering service improved its offering by using a conjoint analysis based on the following attributes:
They identified easy ways to improve their services with little effort but with great value increases for their customers.
Designing conjoint studies is complex. When too many product features and product profiles are chosen, respondents may often feel overwhelmed and tend to simplify the answers to questions.
The mathematical model that supports conjoint analysis is also very complex. The results and the way they’re calculated may not be easy to understand and interpret.
When conjoint analysis studies are poorly designed, they may overvalue product attributes which trigger emotional responses, and undervalue concrete features and important hard facts.
In the survey, the respondents are presented with all the attributes of a profile. In real life, the product positioning is harder and the consumers seldom have all the facts presented in this way. The conjoint analysis can therefore only be a reference and not directly put into practice.
On the other hand, conjoint analysis has numerous advantages. Above all, the fact that psychological mechanisms play a role in decision-making in conjoint analysis is an advantage. After all, emotions also play an important role in the real buying process.
In addition, conjoint analysis presents several attributes to the respondent in a combined manner, which corresponds better to reality than a survey in which individual attributes are queried.
In addition, conjoint analysis relates the various attributes to each other, which means that the most important factors for the user’s preferences can be identified.
There are plenty of tools out there that support product managers and market researchers with their conjoint analysis. The following are the most common:
With the right preparation and a good selection of attributes and levels, conjoint analysis can give a product manager helpful insights into consumer needs. It can be used for pricing and competitive product analysis. At the same time, conjoint analysis can provide helpful insights into consumer behavior during the initial market research for a new product.
Due to the simplicity of the survey, there is no obstacle for the survey participants to take part in the conjoint study. Participants are only called upon to compare different profiles, which closely simulates a real purchase process. As a result, psychological mechanisms that play a role during the buying process are also included and flow into the conjoint analysis results.
Featured image source: IconScout

LogRocket identifies friction points in the user experience so you can make informed decisions about product and design changes that must happen to hit your goals.
With LogRocket, you can understand the scope of the issues affecting your product and prioritize the changes that need to be made. LogRocket simplifies workflows by allowing Engineering, Product, UX, and Design teams to work from the same data as you, eliminating any confusion about what needs to be done.
Get your teams on the same page — try LogRocket today.

Red-teaming reveals how AI fails at scale. Learn to embed adversarial testing into your sprints before your product becomes a headline.

Cory Bishop talks about the role of human-centered design and empathy in Bubble’s no-code AI development product.

Learn how to reduce mobile friction, boost UX, and drive engagement with practical, data-driven strategies for product managers.

Jim Naylor shares he views documentation as a company’s IP and how his teams should use it as a source of truth.


