Product managers can measure and benchmark a number of KPIs to ensure that their business meets its objectives. One of the most popular KPIs they track is NPS (net promoter score).
NPS is all about customer loyalty and advocacy, two things that product managers should monitor if customer retention or growth is key to their product strategy.
In this article, you’ll learn what NPS is, the benefits and disadvantages of NPS compared to similar KPIs, how to calculate your net promoter score and what the different scores mean, when to send NPS surveys to customers, and what you can do to improve your net promoter score.
NPS is a KPI used to measure and benchmark customer enthusiasm, which ultimately translates to customer retention and growth.
Fred Reichheld, business strategist and creator of NPS, first mentioned NPS in 2003 in an article for the Harvard Business Review called “The One Number You Need to Grow.” Now, almost every business in the world uses or at least knows about it.
As I mentioned before, NPS enables product managers to gauge customer loyalty and advocacy. These factors translate to customer retention (keeping the customers you already have) and growth (acquiring new customers and boosting revenue).
So, if your business objectives include boosting customer retention or growth, NPS would reveal the likelihood of those objectives being met. In turn, this informs your product strategy, particularly your product roadmap and marketing.
In addition, a higher NPS tends to mean less pressure on customer support teams and that customers are typically nicer to them.
Moreover, a higher NPS will likely lower employee churn since people enjoy working for industry leaders.
The problem with NPS is that it doesn’t predict the number of retained customers or the amount of growth. This is where EGR (earned growth rate) steps in.
EGR is another KPI conceptualized by Fred Reichheld to address the shortcomings of NPS. It measures revenue growth driven by retained, returned, or referred customers and can be used to make projections. However, these projections don’t take current customer enthusiasm levels into account, which is what NPS does.
Therefore, the best way to monitor customer retention and growth is to monitor both NPS and EGR, as each KPI provides a different perspective. In fact, Fred describes EGR as an accounting-based counterpart to NPS.
To add to this, there’s another metric called earned growth ratio, which helps product managers understand how much specific types of growth (e.g., retains or referrals) contribute to total growth.
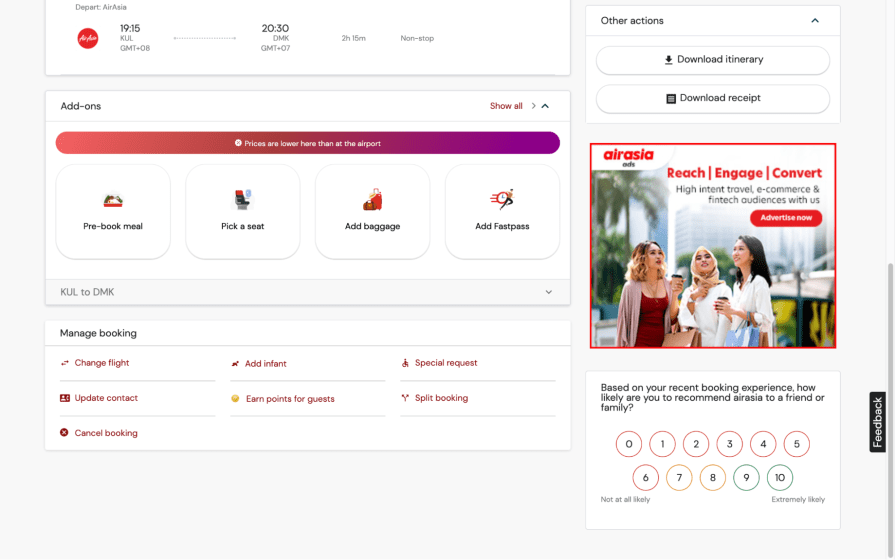
Net promoter scores are calculated using the results of NPS surveys, which contain just one question — “On a scale from 0–10, how likely are you to recommend [product/company] to friends, family, or colleagues?”

After that, label each respondent as a Detractor (0–6), Passive (7–8), or Promoter (9–10), depending on the answer that they give.

Finally, subtract the percentage of Detractors from the percentage of Promoters (the percentage of Passives is irrelevant).
((Promoters/Respondents) * 100) – ((Detractors/Respondents) * 100) = NPS

For example, if you were to end up with 150 respondents made up of 50 Promoters and 25 Detractors, your net promoter score would be 17 (rounded up from 16.666666667):
((50/150) * 100) – ((25/150) * 100) = 16.666666667
It’s a simple process, but what do the scores mean? Let’s have a look.
Net promoter scores range from -100 to +100. Therefore, 0 is neutral, anything lower than 0 is bad, and anything higher than 0 is good. However, the average net promoter score is 23, so if your net promoter score is below 23, your customer enthusiasm levels are below average.
That being said, average NPS differs by industry, so the average NPS for your industry could be lower or higher than 23. Using this information, you should be able to decide upon an NPS goal that feels right for your business.
How you prompt customers to take NPS surveys depends on your relationship with them.
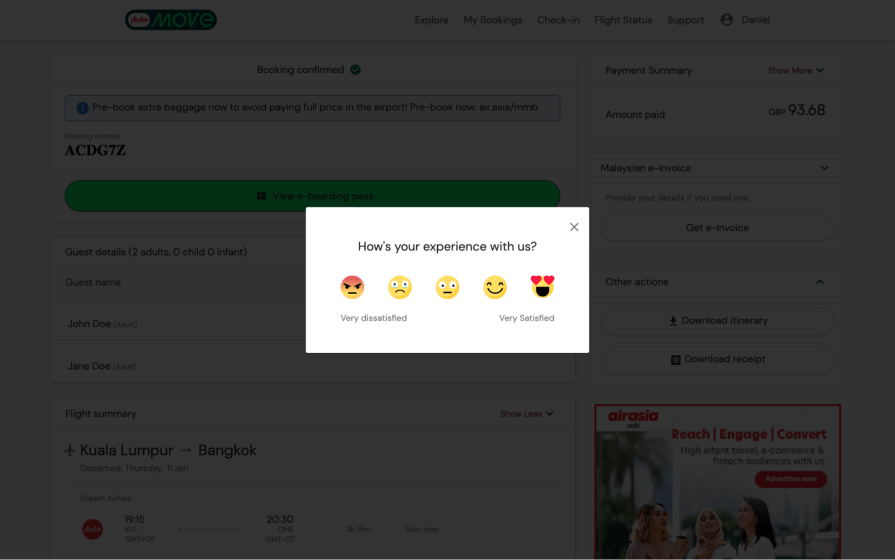
If your business provides an ongoing service, send them recurring email surveys. This is typically done quarterly to inform the next financial quarter. If the product is tied to an online account, you also have the option to present it with a pop-up of some kind:

If your business doesn’t provide an ongoing service, send them a one-off email survey sometime after they’ve converted (e.g., after they’ve made a purchase and enough time has passed for it to be delivered, used, reviewed, and refunded). This ensures that your net promoter score is reflective of the entire customer experience:

Tip — to prevent skewed results, never incentivize NPS surveys.
To improve your NPS score, you’d need to boost customer satisfaction to the point that customers would recommend your product/company to others. This means pushing your Passives (customers who are on the fence about being customers) to be Promoters and your Detractors (customers who aren’t likely to purchase again) to be Promoters or at least Passives.
To that end, there are three things in particular that you can do to improve your NPS score:
Ensure that your product roadmap is geared towards fixing the right problems.
To improve your net promoter score sooner rather than later, fix the problems that are high-priority according to the prioritization framework you’re using, such as those that have a high RICE score or fall into the high-impact/low-effort quadrant of your impact-effort matrix.
Conversely, if your business is in a good place (evidenced by a high net promoter score, perhaps), you’ll have the benefit of being able to tackle the more complex, more time-consuming problems.
This might seem like it’s the same thing as fixing the right problems, but it’s not. Fixing the problems refers to known problems and problems that aren’t directly related to the customer experience. Key interactions refer to common tasks carried out by customers throughout the customer journey.
Think of the checkout process for an eCommerce business as an example of a key interaction. For a bank, the process of making a payment or sending account details would be key. There’s also the process of seeking help, which applies to all businesses.
To learn which processes aren’t satisfying customers, consider using CSAT surveys (customer satisfaction score surveys) or CES surveys (customer effort score surveys). Unlike NPS surveys, these are transactional surveys where customers are prompted to take them immediately after carrying out the tasks in question. CSAT and CES surveys are often compared to NPS surveys, but they’re actually used in different scenarios.
However, CSAT and CES surveys don’t take into account people who weren’t able to finish or even start the task, so they’re certainly not the be-all and end-all of CX research. That being said, they do narrow down problems to specific customer interactions, making the lives of UX designers much easier.
All businesses hope customers won’t need to contact customer support, but it’s inevitable. Besides ensuring that customer support agents are polite and positive, we can do a few other things.
Firstly, customers should be able to solve problems by themselves whenever possible. If customers ask, “Why do I need to contact customer support for this?” or state, “I should just be able to do that,” something is wrong.
Secondly, while it’s totally acceptable to cut costs by using chatbots to solve customer problems, understand that customers have often tried everything already (including your help section) or are dealing with a unique problem they know requires a human customer support agent. Therefore, let customers skip straight to this step.
Thirdly, reduce wait times. Customer support agents should know who the customer is and what their issue is. They should also collect any other relevant information, pre-collecting it if possible and not collecting it if it isn’t needed. Nobody wants to type their full name, date of birth, address, and so on for no reason.
Finally, whenever possible, empower customer support agents to fix customer problems directly, ensuring that customers don’t get “passed on” to somebody “better equipped” to handle their problems. Simply put, be equipped. Similarly, don’t install customer support agents on social media that inherently refer customers to other customer support channels.
To add to this, don’t let solutions be impossible when they should be possible, and don’t ask customers to carry out steps to solve their problems if the customer support agent can do so instead. Ultimately, if you can get customer support agents to say, “We’ve taken care of that for you,” within five responses, you’re golden.
Product managers can use NPS surveys to gauge customer loyalty and advocacy. More specifically, NPS surveys are useful for monitoring customer retention and growth, so if either is key to your product strategy, you’ll want to use NPS surveys.
Product managers should also monitor EGR (earned growth rate) to obtain quantitative data on past customer retention and growth since NPS doesn’t provide this.
By monitoring NPS and EGR, product managers can combine current customer enthusiasm levels with past quantitative data on customer retention and growth to predict future growth.
If you have any questions, don’t hesitate to ask them in the comment section below. Thanks for reading!
gd2md-html: xyzzy Mon Aug 05 2024

LogRocket identifies friction points in the user experience so you can make informed decisions about product and design changes that must happen to hit your goals.
With LogRocket, you can understand the scope of the issues affecting your product and prioritize the changes that need to be made. LogRocket simplifies workflows by allowing Engineering, Product, UX, and Design teams to work from the same data as you, eliminating any confusion about what needs to be done.
Get your teams on the same page — try LogRocket today.

A product manager’s guide to deciding when automation is enough, when AI adds value, and how to make the tradeoffs intentionally.

How AI reshaped product management in 2025 and what PMs must rethink in 2026 to stay effective in a rapidly changing product landscape.

Deepika Manglani, VP of Product at the LA Times, talks about how she’s bringing the 140-year-old institution into the future.

Burnout often starts with good intentions. How product managers can stop being the bottleneck and lead with focus.