Creating an effective pricing strategy involves much more than just attaching a price tag to the features you offer. Interestingly, the price itself is not even the most critical element.

Max-diff surveys can assist you in crafting superior pricing strategies by addressing the most vital pricing question: what should you even charge for?
A max-diff survey, also known as maximum difference scaling, is a research method used to measure and analyze the relative importance or preference of a set of items by respondents. It involves presenting respondents with a series of choices and asking them to indicate the most and least preferred or important options.
This method is particularly useful in product management for identifying key features or aspects that drive customer value, informing pricing strategies, and prioritizing product development efforts.
What you charge for has a more significant impact on your revenue than the price itself. When what you charge for aligns with what is most valuable to your customers, you can convert more users into paying customers and extract more value from your heavy users.
While this isn’t a significant issue for smaller products — their value delivery is usually straightforward — when managing a larger, more complex product, deciding which part of the product should be your main value driver becomes increasingly challenging.
For instance, should Uber charge for distance or time traveled? Or, should Miro charge based on the number of boards, the number of editors, or usage of templates and plugins?
There are three prevalent tactics to determine what should be the main price driver for your product:
With value scoring, you first identify the most promising price drivers for your product (sources of value for users) and ask users to rate how important these features or outcomes are to them.
For example, Uber could ask users to rate factors like:
Value scoring is simple to set up and conduct. However, it’s often challenging to derive valuable insights from it.
Firstly, a score of 7/10 means different things to different people. For one person, seven might be the highest rating; for others, it might be the lowest.
And it’s difficult to distinguish what’s truly important if your users score everything close to seven or 10.
The most accurate and scientific method to identify the most crucial value driver would be to conduct a behavioral analysis.
This involves analyzing actual user behavior and identifying correlations and causations between their product usage and willingness to purchase and retain.
However, it’s very complex to conduct and analyze and requires large data samples of actual product usage. In fact, it might even be impossible for small and brand-new products.
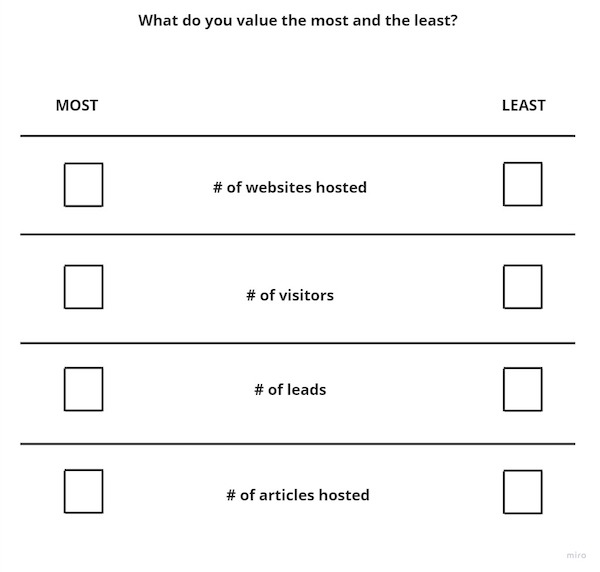
A max-diff survey is a research method that asks users two questions:
You can use these responses to analyze relative user preferences.
Although it still provides an incomplete picture — it doesn’t include “in-between” factors, which still play a crucial role — the balance of average effort and relatively high accuracy makes it one of the default tools for various types of pricing research.
For this reason, we will focus on using max-diff surveys as our first step in defining our pricing model.
Conducting a max-diff analysis involves five steps:

The first step is to determine what metrics you want to survey. Begin by answering the question: what creates value for customers?
For instance, for Webflow users, it might include:
These factors should be derived from prior qualitative user research, not your intuition or brainstorming session.
After identifying what creates value for your users, answer the second question: how can you measure that value?
Returning to our example:
These metrics form the core of our max-diff survey:

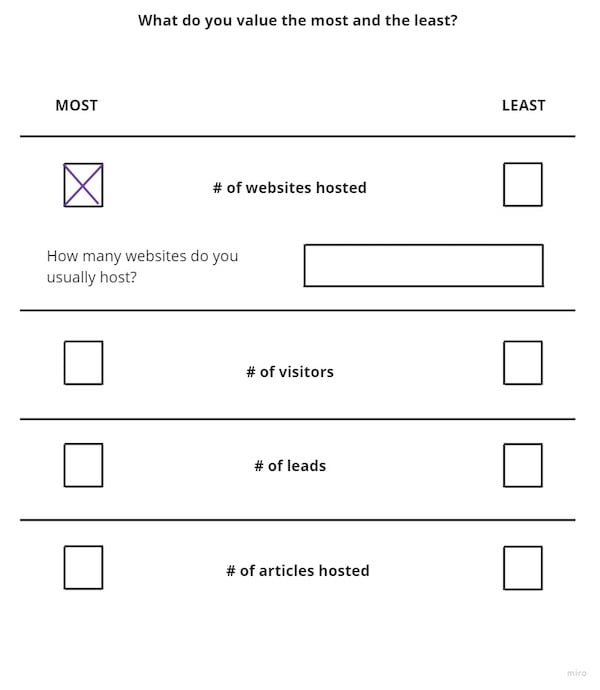
To gain even more insights, add calibration questions to the chosen metrics.
This will give you a clearer picture of how relevant a given metric is. For example, if the number of websites hosted is critical for your users, but they only host one or two websites, then it’ll be challenging to scale the price:

After defining the metrics you want to survey and designing calibration questions, conduct the survey with users.
You should aim for at least 100 responses to get solid insights. A thousand would be ideal.
Once you have received your survey results, calculate the max-diff score.
Whenever a respondent market a factor as most valuable, add one point to the given factor. If they market the factor as least valuable, subtract one. Then, divide the total score by the number of users surveyed.
The formula to calculate a max-diff score is as follows:
Max-diff score = # of users who found the factor most valuable – # of users who found the factor least valuable / Total # of users surveyed

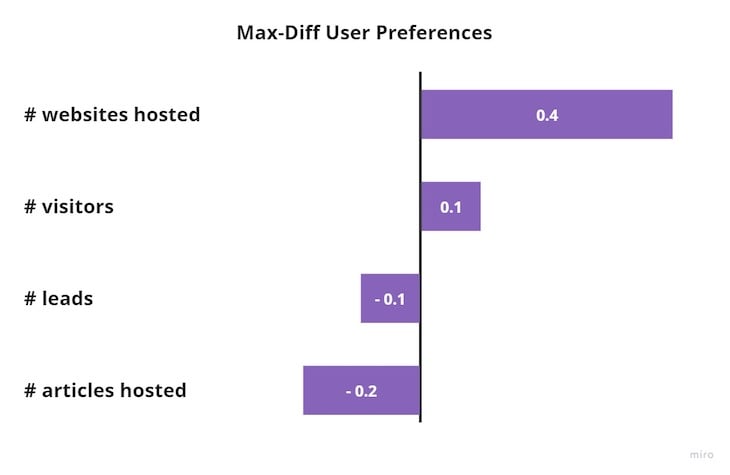
So, if, out of our 10-person sample, three people find the number of visitors most valuable, and two found it to be the least valuable, then:
Max-diff score = 3–2/10 = 0.1
We could visualize the results of this max-diff survey in a chart:

The analysis suggests that:
The final step involves segmenting results. This is particularly crucial if you have different types of users, such as enterprise and individual clients. These clients have different use cases and likely value your product differently.
It might emerge that, although articles hosted was rated as least desirable in overall sample size, it’s actually vital for specific user segments that were underrepresented in this survey. If this turns out true, you could consider scaling prices with different metrics for different use cases.
The most crucial aspect of your pricing strategy is what you actually charge for. While simpler models like subscriptions and flat fees may still be effective, identifying the right value metric and constructing your pricing strategy around it can help you maximize your revenue.
There are various methods to identify a value metric, but the max-diff survey stands out due to its balance between effort and outcome, so it should always be considered in your efforts.
Begin by identifying what brings value to customers and creating metrics that reflect that. Then, ask users to choose which one is the most and least valuable to them. This will enable you to calculate the max-diff score. The higher the score, the more suitable the metric is to become your pricing lever (the higher the metric, the higher the price).
Use segmentation to identify differences in user preferences. Different groups of users might value different outcomes.
Featured image source: IconScout
LogRocket identifies friction points in the user experience so you can make informed decisions about product and design changes that must happen to hit your goals.
With LogRocket, you can understand the scope of the issues affecting your product and prioritize the changes that need to be made. LogRocket simplifies workflows by allowing Engineering, Product, UX, and Design teams to work from the same data as you, eliminating any confusion about what needs to be done.
Get your teams on the same page — try LogRocket today.

A fractional product manager (FPM) is a part-time, contract-based product manager who works with organizations on a flexible basis.

As a product manager, you express customer needs to your development teams so that you can work together to build the best possible solution.

Karen Letendre talks about how she helps her team advance in their careers via mentorship, upskilling programs, and more.

An IPT isn’t just another team; it’s a strategic approach that breaks down unnecessary communication blockades for open communication.