Editor’s note: This article was updated by Chizaram Ken in June 2026 to reflect current React chart library adoption, React 19 and Next.js App Router considerations, SSR and React Server Components tradeoffs, newer bundle-size guidance, and updated use cases for Recharts, react-chartjs-2, Victory, Nivo, React ApexCharts, Ant Design Charts, Apache ECharts, visx, and MUI X Charts.

Here is a quick summary of the adoption, rendering model, and best-fit use case for the React chart libraries we’ll discuss below. Download counts and GitHub stars change frequently, so treat these as directional popularity signals rather than permanent rankings.
| Library | Stars | Weekly downloads | Rendering | Best for | Backed by |
|---|---|---|---|---|---|
| Recharts | 27k+ | 48m+ | SVG | General React dashboards, shadcn/ui projects, SSR-friendly SVG charts | Open source community |
| react-chartjs-2 | 6.8k+ | 3.7m+ | Canvas | Canvas-based dashboards, Chart.js teams, authenticated SPAs | Open source community |
| Victory | 11.1k+ | 371k+ | SVG | Teams that need similar chart APIs across web and React Native | Nearform, formerly Formidable Labs |
| Nivo | 14k+ | 760k+ | SVG, Canvas, HTML | Polished dashboards with many chart types and strong defaults | Open source community |
| React ApexCharts | 1.3k+ | 880k+ | SVG | Interactive dashboards with zooming, panning, and mixed charts | Open source community |
| Ant Design Charts | 2.1k+ | 121k+ | Canvas | Ant Design-based internal tools and enterprise dashboards | Ant Design team |
| Apache ECharts | 66k+ | 2.7m+ | SVG, Canvas | Large datasets, advanced interactions, and dense dashboards | Apache |
| visx | 20k+ | 2.2m+ | SVG | Custom visualization systems and bundle-sensitive apps | Airbnb |
| MUI X Charts | 5.7k+ | 845k+ | SVG | MUI apps that need theme integration and SSR-capable charts | MUI team |
React chart libraries help you build data visualizations without hand-coding every axis, scale, tooltip, legend, animation, and resize behavior from scratch. For small projects, a custom SVG or Canvas chart can be enough. But once your application needs multiple chart types, responsive layouts, tooltips, real-time updates, accessibility support, or consistent theming, a chart library usually saves more time than it costs.
The best React chart library depends on your constraints. Recharts is still the practical default for many React dashboards because its component API is simple and widely understood. react-chartjs-2 and Apache ECharts are better fits when Canvas performance matters. visx gives you the most control, but asks you to compose visualization primitives yourself. MUI X Charts makes the most sense when your app already uses Material UI. Victory remains relevant when React Native parity matters.
That last point is important: there is no single “best” React chart library. The right choice depends on whether you prioritize developer experience, SSR, bundle size, customization, mobile support, accessibility, real-time performance, or design-system integration.
Before comparing feature lists, start with the constraint that actually matters for your project:
| Use case | Best fit | Why |
|---|---|---|
| “We need beautiful charts fast with minimal configuration” | Recharts or Nivo | Both offer strong defaults and familiar React APIs |
| “We use shadcn/ui” | Recharts | shadcn/ui chart components are built around Recharts |
| “We use Material UI” | MUI X Charts | It integrates with MUI themes, typography, and styling conventions |
| “We need React Native parity” | Victory | Victory and Victory Native have similar APIs |
| “We need the smallest possible custom chart layer” | visx | It lets you import low-level D3-powered primitives instead of a full charting system |
| “We have real-time or high-frequency data” | Apache ECharts or react-chartjs-2 | Canvas rendering usually handles frequent updates better than SVG |
| “We need advanced dashboards with many chart types” | Apache ECharts, Nivo, or React ApexCharts | These libraries cover a broad range of visualization types |
| “We care about SSR in Next.js App Router” | Recharts, MUI X Charts, Victory, or static visx charts | SVG-based libraries generally have the strongest SSR story |
| “We need 10K+ data points” | Apache ECharts or react-chartjs-2 | Canvas mode is better suited to large datasets than SVG |
If you only need a bar chart, line chart, and tooltip, do not start with the most powerful option. Start with the smallest library that satisfies your rendering, accessibility, and maintenance requirements.
React charting decisions look different in 2026 than they did a few years ago. The biggest changes are not just new chart types; they are platform-level concerns around React 19, Next.js App Router, server rendering, and bundle cost.
The main changes developers should consider are:
'use client' because they depend on state, effects, browser APIs, or React contextFor a broader look at data visualization tooling and D3-based approaches, see LogRocket’s guide to D3.js adoption. If your charts live inside a larger React design system, LogRocket’s overview of building responsive themes and components with Mantine is also useful context.
If your team uses Next.js App Router, compatibility is not just a matter of whether the package installs. You also need to know whether the chart can render meaningful markup on the server, whether it requires a Client Component boundary, and whether it relies on browser-only APIs.
In practice, every interactive React chart library listed here requires client-side JavaScript. None of them is a fully RSC-native charting solution. The more useful question is whether the library can still produce useful server-rendered HTML before hydration.
| Library | Server-rendered HTML | RSC-native without 'use client' |
Notes |
|---|---|---|---|
| Recharts | Yes, for SVG charts | No for interactive charts | SVG output gives it a better SSR story than Canvas libraries. Recharts v3 also improves accessibility defaults |
| react-chartjs-2 | No | No | Canvas needs a browser environment. Use a Client Component or dynamic import with SSR disabled |
| Victory | Yes, for SVG charts | No for interactive charts | Good SSR story for SVG output; React Native parity remains its strongest differentiator |
| Nivo | Partial | No | SVG/HTML variants can pre-render, but Nivo components still need a Client Component boundary in App Router |
| React ApexCharts | No in most Next.js App Router setups | No | Relies on browser DOM APIs; usually requires next/dynamic with ssr: false |
| Ant Design Charts | No | No | Canvas-based rendering makes it a poor SSR fit |
| Apache ECharts | Partial with SVG mode | No | The core library expects DOM APIs; most teams wrap it in a Client Component |
| visx | Yes for static SVG charts | Closest for static charts | Static, non-interactive charts can stay very server-friendly; interactivity requires client hooks |
| MUI X Charts | Yes, with constraints | No for interactive charts | SSR requires explicit dimensions and disabled initial animation |
A useful rule of thumb: if the chart uses Canvas or browser-only APIs, assume it is client-only. If it uses SVG, it may be able to render server-side, but interactivity still requires hydration.
For React chart pages where SEO, first contentful paint, or no-JavaScript rendering matters, SVG-based libraries are usually safer. For dashboards behind authentication, where charts are mostly interactive and SEO is irrelevant, Canvas libraries may be the better choice.
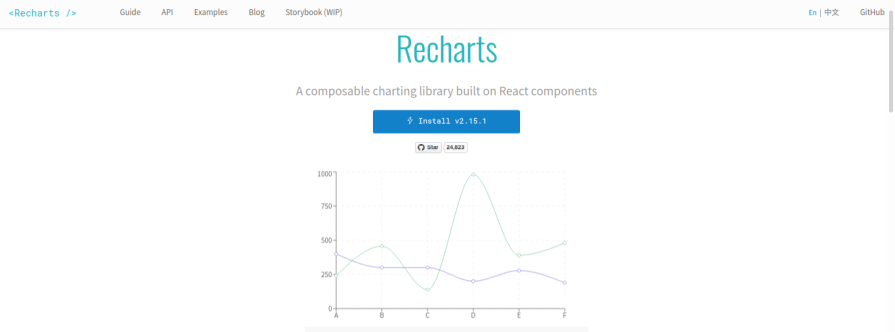
Recharts is a composable charting library built with React components and D3 submodules. It remains one of the easiest React-first charting libraries to recommend because its API maps cleanly to how React developers already think: compose components, pass props, and customize where needed.
Recharts is especially strong for product dashboards, internal tools, and marketing/product analytics pages where developers need common chart types without building axes, tooltips, legends, and responsive behavior manually. It uses SVG rendering, which makes charts easier to style, inspect, and server-render than Canvas-based alternatives.
Recharts v3 introduced several important changes. Its internal state was rewritten into smaller chunks, the react-smooth and recharts-scale dependencies were removed, and accessibilityLayer is now enabled by default. Recharts v3 also lets you render arbitrary React components inside a chart without the older Customized wrapper.
Install Recharts with npm or Yarn:
npm install recharts
# or
yarn add recharts
A basic Recharts chart looks like this:
import {
  Bar,
  BarChart,
  CartesianGrid,
  ResponsiveContainer,
  Tooltip,
  XAxis,
  YAxis,
} from 'recharts'

const data = [
  { month: 'Jan', revenue: 2400 },
  { month: 'Feb', revenue: 3200 },
  { month: 'Mar', revenue: 2800 },
]

export function RevenueChart() {
  return (
    <ResponsiveContainer width="100%" height={300}>
      <BarChart data={data}>
        <CartesianGrid strokeDasharray="3 3" />
        <XAxis dataKey="month" />
        <YAxis width="auto" />
        <Tooltip />
        <Bar dataKey="revenue" fill="#2563eb" />
      </BarChart>
    </ResponsiveContainer>
  )
}
The main tradeoff is bundle size. Recharts is convenient, but it is not the lightest option and is not as granular as visx. If you are building a highly custom visualization system or an embedded widget where every kilobyte matters, visx may be a better fit.
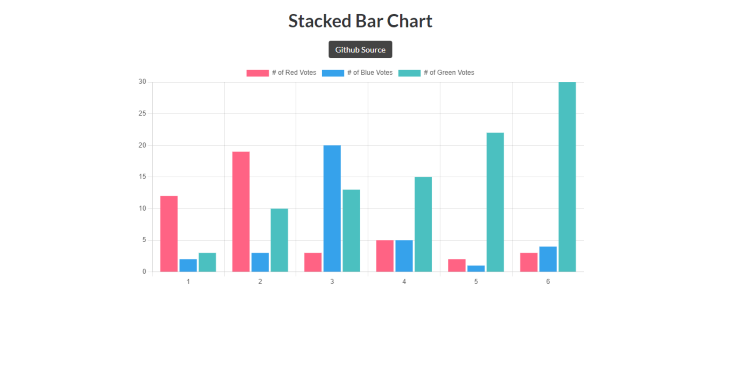
react-chartjs-2 is a React wrapper for Chart.js, one of the most widely used JavaScript charting libraries. If your team already knows Chart.js, react-chartjs-2 gives you a familiar path into React without switching charting concepts entirely.
The biggest architectural difference is rendering: react-chartjs-2 uses Canvas through Chart.js. Canvas is often a good fit for dashboards that need frequent updates, many data points, or better runtime performance than SVG can provide. The tradeoff is that Canvas does not produce meaningful chart markup on the server.
In a Next.js App Router project, treat react-chartjs-2 as a Client Component dependency:
'use client'

import {
  Chart as ChartJS,
  CategoryScale,
  LinearScale,
  BarElement,
  Tooltip,
} from 'chart.js'
import { Bar } from 'react-chartjs-2'

ChartJS.register(CategoryScale, LinearScale, BarElement, Tooltip)

export function RevenueBarChart({ data }) {
  return <Bar data={data} />
}
You can install it with Chart.js as a peer dependency:
npm install react-chartjs-2 chart.js
# or
yarn add react-chartjs-2 chart.js
Use react-chartjs-2 for SPAs, authenticated dashboards, and internal monitoring pages where SEO and server-rendered chart markup do not matter. Avoid it when charts need to appear meaningfully in server-rendered HTML.
For more implementation details, see LogRocket’s guide to using Chart.js in React.
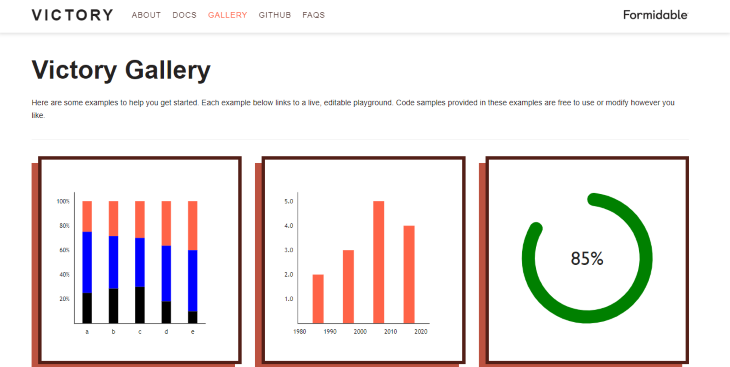
Victory is a collection of composable React components for building charts and data visualizations. It is opinionated enough to be productive, but customizable enough to support more complex chart layouts.
Victory’s biggest differentiator is React Native parity. If your team wants similar charting APIs across web and mobile, Victory and Victory Native are still compelling. That makes it more attractive for product teams that maintain web and React Native apps together.
Install Victory with npm or Yarn:
npm install victory
# or
yarn add victory
Victory is SVG-based on the web, which gives it a reasonable SSR story for static charts. It also has approachable documentation and a component model that is easier to understand than lower-level visualization primitives.
That said, Victory is better described as stable and production-proven than fast-moving. For new web-only projects, compare its release cadence and bundle size against Recharts, MUI X Charts, or visx before choosing it by default.
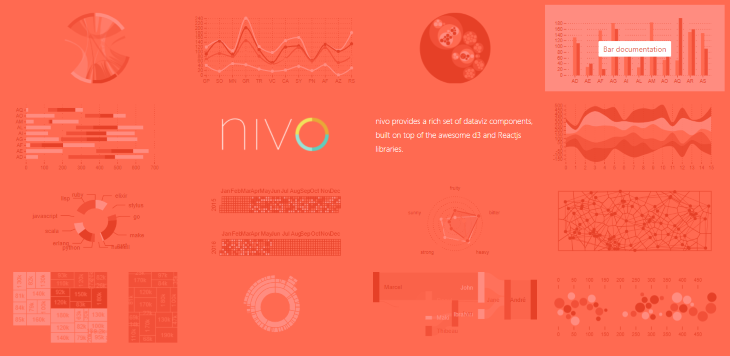
Nivo is a React charting library built around D3, with SVG, Canvas, and HTML rendering options depending on the chart type. It is popular because it gives developers polished visual defaults without requiring the low-level setup that D3 or visx would require.
Nivo is a good choice when you need attractive charts quickly and want access to chart types beyond the usual bar, line, and pie set. Its scoped package architecture, such as @nivo/bar, @nivo/line, and @nivo/pie, also lets teams install only the chart families they need.
Install Nivo’s core package and the chart package you plan to use:
npm install @nivo/core @nivo/bar
If your project is on React 19 and npm reports peer dependency conflicts, check the current package peer dependency range before forcing installation with --legacy-peer-deps. That flag can be useful during migration, but it should not be treated as the default installation path for every project.
The main Next.js gotcha is that Nivo is not RSC-native. Some Nivo chart variants can produce server-rendered output, but in App Router projects, you should expect to wrap Nivo charts in Client Components because they rely on client-side React behavior.
For a deeper walkthrough, see LogRocket’s guide to building charts in React with Nivo.
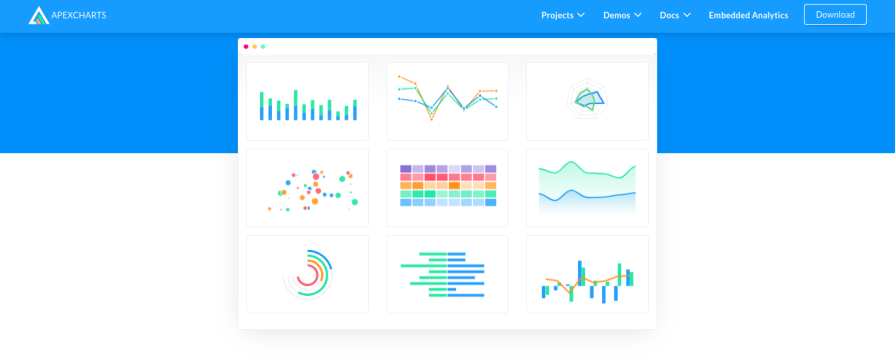
React ApexCharts is a React wrapper for ApexCharts, a JavaScript charting library focused on interactive charts. It supports common chart types like line, bar, area, pie, donut, scatter, bubble, heatmap, and radial bar charts, and it is particularly useful when dashboards need built-in zooming, panning, scrolling, and mixed chart types.
React ApexCharts renders charts using SVG, but it relies on browser DOM APIs. In Next.js App Router, this usually means using a Client Component or a dynamic import with SSR disabled:
import dynamic from 'next/dynamic'

const Chart = dynamic(() => import('react-apexcharts'), {
  ssr: false,
})

export function ApexDashboardChart(props) {
  return <Chart {...props} />
}
Install React ApexCharts with ApexCharts:
npm install react-apexcharts apexcharts
React ApexCharts is a strong fit for interactive dashboards where client-side chart behavior is more important than SSR. It is less compelling for SEO-sensitive pages or static reporting pages where server-rendered SVG is a priority.
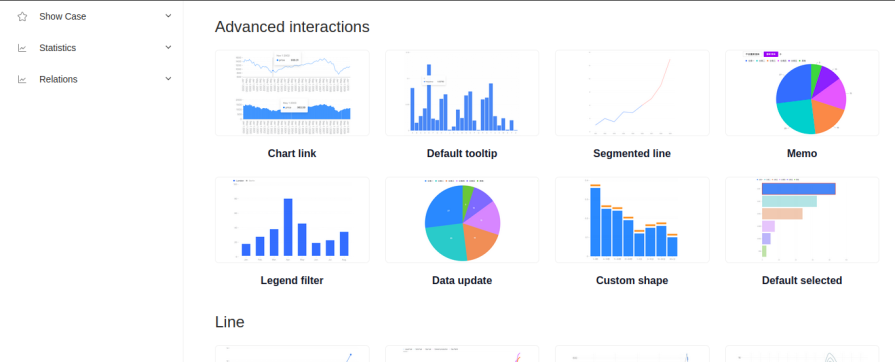
Ant Design Charts is a charting library from the Ant Design ecosystem. It is designed for teams already building enterprise dashboards and internal tools with Ant Design components.
The library supports common chart types like line, bar, pie, and area charts, as well as more specialized visualizations such as funnel charts, radar charts, gauges, box plots, and waterfall charts. Its biggest advantage is ecosystem fit: if your UI already uses Ant Design patterns, Ant Design Charts can help charts feel visually consistent with the rest of the application.
Install it with npm or Yarn:
npm install @ant-design/charts
# or
yarn add @ant-design/charts
The tradeoff is weight. Ant Design Charts is not the lightest option, and its Canvas-oriented rendering model is not ideal for server-rendered chart markup. It is a better fit for data-heavy internal dashboards than for public marketing pages, lightweight widgets, or performance-sensitive landing pages.
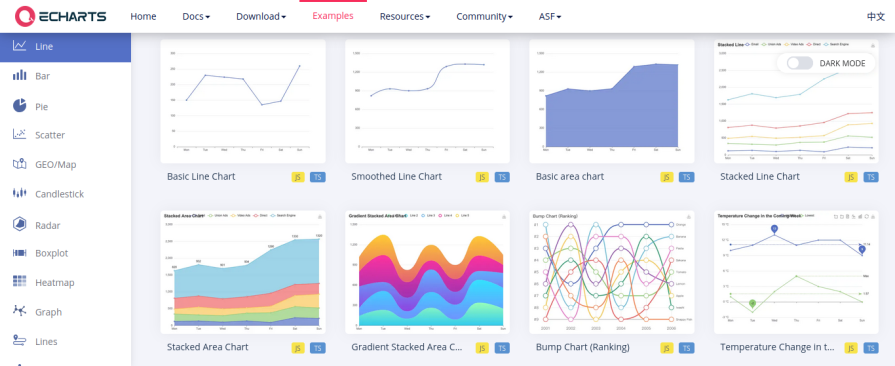
Apache ECharts is a powerful charting and data visualization library maintained by Apache. It supports many chart types, including line, bar, pie, scatter, heatmap, Sankey, graph, radar, tree, and map visualizations. It also supports both SVG and Canvas rendering.
ECharts is one of the strongest options for dense dashboards, large datasets, and advanced interactions. It includes features like zooming, panning, progressive rendering, theming, extensions, and mobile-friendly interactions.
Install ECharts with npm or Yarn:
npm install echarts
# or
yarn add echarts
One important implementation detail: do not import all of ECharts unless you actually need all of it. The naive import is convenient, but it can ship far more code than a selective import:
// Avoid this unless you really need the full package
import * as echarts from 'echarts'
For production apps, use the tree-shakeable API and register only the chart types, components, and renderer you need:
import * as echarts from 'echarts/core'
import { BarChart } from 'echarts/charts'
import {
  GridComponent,
  TitleComponent,
  TooltipComponent,
} from 'echarts/components'
import { CanvasRenderer } from 'echarts/renderers'

echarts.use([
  BarChart,
  GridComponent,
  TitleComponent,
  TooltipComponent,
  CanvasRenderer,
])
That added setup is the main tradeoff. ECharts does not ship a first-party React component API, so React teams often use a wrapper package or write a small Client Component around the core API. For complex dashboards, that extra boilerplate can be worth it.
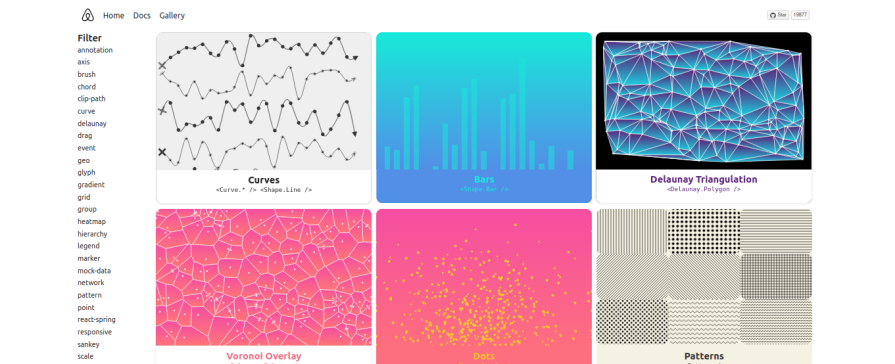
visx is not a conventional charting library. It is a collection of low-level visualization primitives built by Airbnb, combining D3’s math and shape utilities with React rendering.
That distinction matters. Recharts gives you a <BarChart />. visx gives you scales, axes, shapes, groups, and utilities for building your own chart components. That makes it more work upfront, but far more flexible when you need a custom visualization system.
Install only the packages you need:
npm install @visx/group @visx/shape @visx/scale
A minimal visx setup is much more explicit than a Recharts setup because you are composing the chart yourself:
import { Group } from '@visx/group'
import { Bar } from '@visx/shape'
import { scaleBand, scaleLinear } from '@visx/scale'

export function SimpleVisxBarChart({ data, width, height }) {
  const xScale = scaleBand({
    domain: data.map((d) => d.label),
    range: [0, width],
    padding: 0.2,
  })

  const yScale = scaleLinear({
    domain: [0, Math.max(...data.map((d) => d.value))],
    range: [height, 0],
  })

  return (
    <svg width={width} height={height}>
      <Group>
        {data.map((d) => (
          <Bar
            key={d.label}
            x={xScale(d.label)}
            y={yScale(d.value)}
            width={xScale.bandwidth()}
            height={height - yScale(d.value)}
          />
        ))}
      </Group>
    </svg>
  )
}
Use visx when your product needs custom visuals, strict bundle control, or a charting layer that your team owns. Avoid it when you need a quick dashboard and do not want to write chart primitives yourself.
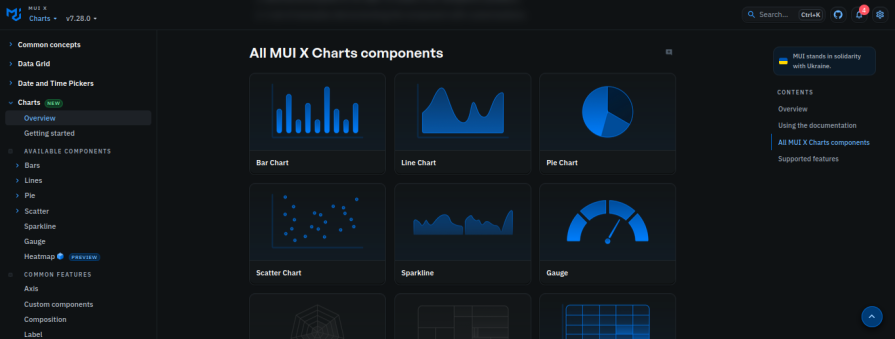
MUI X Charts is the charting package from the MUI X ecosystem. It is the obvious first option for teams already building with Material UI because it integrates with MUI theming, typography, spacing, and component conventions.
MUI X Charts supports common chart types like line, bar, scatter, and pie charts, with more advanced chart types available through MUI X Pro and Premium packages. The Community package is MIT-licensed and covers many standard dashboard needs, while more advanced features require a commercial license.
Install the package with npm or Yarn:
npm install @mui/x-charts
# or
yarn add @mui/x-charts
The package has peer dependencies on @mui/material, react, and react-dom. If your app does not already use Material UI, install the Material UI dependencies as well:
npm install @mui/material @emotion/react @emotion/styled
# or
yarn add @mui/material @emotion/react @emotion/styled
MUI X Charts has also improved its SSR story. Server-side rendering is supported when you provide explicit chart dimensions and disable animation for the initial render:
import { BarChart } from '@mui/x-charts/BarChart'

export function RevenueChart({ dataset }) {
  return (
    <BarChart
      width={600}
      height={320}
      dataset={dataset}
      xAxis={[{ dataKey: 'month', scaleType: 'band' }]}
      series={[{ dataKey: 'revenue' }]}
      skipAnimation
    />
  )
}
MUI X Charts is not the smallest option if your app does not already use MUI. But if the MUI ecosystem is already part of your bundle and design system, the integration benefits can outweigh the size cost.
For broader MUI layout context, see LogRocket’s guide to the MUI Grid system.
skipAnimationBundle size should not be the only factor in your charting decision, but it is too important to ignore. A chart library can quietly add more JavaScript than the rest of a lightweight dashboard.
The exact numbers vary by version, bundler, import pattern, and whether your app already includes shared dependencies. Use the table below as a directional guide, then verify with your own bundler before committing.
| Library | Bundle-size profile | Practical note |
|---|---|---|
| visx | Usually smallest for custom charts | You import primitives, but you write more chart code yourself |
| react-chartjs-2 + Chart.js | Moderate if tree-shaken well | Register only the Chart.js pieces you use |
| Victory | Middle of the pack | Convenient, but not the lightest SVG option |
| MUI X Charts | Moderate to heavy if MUI is not already installed | Much more reasonable when MUI is already in your app |
| Nivo | Depends on selected packages | Scoped packages help, but core dependencies still add weight |
| Recharts | Convenient but not especially small | Good DX, but limited tree-shaking upside |
| React ApexCharts | Relatively heavy | ApexCharts engine dominates the bundle |
| Apache ECharts | Very heavy if imported naively; better with selective imports | Use echarts/core and register only what you need |
| Ant Design Charts | Heavy | Best reserved for Ant Design dashboards where the ecosystem fit matters |
The main takeaway: visx wins on raw control and bundle discipline, but it costs more developer time. Recharts wins on ease of use. ECharts can be performant and powerful, but only if you import it carefully. Ant Design Charts should be used when Ant Design integration matters enough to justify the bundle impact.
For most React dashboards, Recharts is the safest default. It has strong ecosystem adoption, a straightforward component API, SVG rendering, and good compatibility with common React UI stacks like shadcn/ui. It is not the smallest or most customizable option, but it is often the fastest route to production-quality charts.
For large datasets, start with Apache ECharts or react-chartjs-2. Canvas rendering generally handles dense data and frequent updates better than SVG. Apache ECharts is especially strong for large interactive dashboards, while react-chartjs-2 is a good fit for teams already familiar with Chart.js.
Regardless of library choice, use aggregation, downsampling, throttling, debouncing, or windowing when data volume gets high. A chart library cannot compensate for rendering too much data too often.
For Next.js App Router projects where SSR matters, start with SVG-based libraries such as Recharts, Victory, MUI X Charts, or static visx charts. Canvas-based libraries such as react-chartjs-2 and Ant Design Charts are better suited to client-rendered dashboard pages.
Remember that 'use client' does not automatically mean “no server-rendered HTML.” Client Components can still be pre-rendered on the server and hydrated in the browser. The real question is whether the library can produce meaningful initial markup and whether it depends on browser-only APIs.
Victory is the strongest option if you want similar charting concepts across React web and React Native. Victory Native gives mobile teams a more direct path than most browser-focused charting libraries.
Use visx when you want to build your own visualization components from primitives. It gives you D3-powered scales and shapes while letting React own rendering. It is not the fastest option for a simple dashboard, but it is one of the best options for bespoke visualization systems.
Apache ECharts and react-chartjs-2 are the strongest starting points for real-time data. Both are better suited to frequent updates than SVG-only libraries in many high-volume cases. React ApexCharts can also work well for interactive dashboard updates, but evaluate performance with your actual data shape and update frequency.
Large datasets can cause slow rendering, memory pressure, and browser crashes. Canvas or WebGL rendering usually performs better than SVG for very dense charts, but the bigger fix is often reducing the number of points you render.
Use techniques like:
Charts are often expensive to re-render because data transformation, layout calculation, and animation can all happen during render cycles. Use useMemo to memoize transformed chart data and useCallback for stable event handlers when needed.
Avoid pushing complex chart-specific transformations into global stores unless multiple components need the same derived data. In many cases, selectors or local memoized computations are easier to reason about.
Chart responsiveness depends on more than setting width: 100%. You need to account for labels, tooltips, legends, tap targets, and whether users can read the data on a small screen.
For mobile dashboards:
Accessibility support varies widely across chart libraries. SVG can be easier to annotate with semantic labels, while Canvas often requires more work to provide accessible alternatives.
At minimum, provide:
Recharts v3’s accessibilityLayer improvements are a meaningful step, but no chart library removes the need to design accessible data experiences intentionally.
There are more React chart libraries than one article can cover, but the libraries above represent the main tradeoffs most teams face in 2026: ease of use, rendering model, bundle size, SSR behavior, customization, React Native support, and design-system integration.
For most teams, Recharts is still the most practical default. Use react-chartjs-2 or Apache ECharts when performance and Canvas rendering matter. Choose visx when you need a custom visualization layer and can afford the engineering time. Use MUI X Charts or Ant Design Charts when your design system already points you in that direction. Choose Victory when web and React Native parity is the priority.
The best chart library is not the one with the most chart types or GitHub stars. It is the one whose tradeoffs match your product: the amount of data you render, the level of customization you need, the platform you ship on, and the maintenance burden your team is willing to own.
Install LogRocket via npm or script tag. LogRocket.init() must be called client-side, not
server-side
$ npm i --save logrocket

// Code:

import LogRocket from 'logrocket';
LogRocket.init('app/id');
// Add to your HTML:

<script src="https://cdn.lr-ingest.com/LogRocket.min.js"></script>
<script>window.LogRocket && window.LogRocket.init('app/id');</script>

Learn how to set up Meilisearch, index documents, and build keyword, semantic, and hybrid search with AI-powered retrieval.
Compare pnpm and npm across security defaults, disk usage, dependency strictness, and workspace policy to decide which package manager fits your project.
I migrated 20 production-style components from Tailwind to StyleX. Here’s what the data showed about LOC, CSS bundle size, build time, and type safety.

A guide for using JWT authentication to prevent basic security issues while understanding the shortcomings of JWTs.
Would you be interested in joining LogRocket's developer community?
Join LogRocket’s Content Advisory Board. You’ll help inform the type of content we create and get access to exclusive meetups, social accreditation, and swag.
Sign up now

 Learn more →