In this post, we’ll evaluate 10 React Native charts libraries:

The cross-platform mobile app framework React Native has many open-source libraries that help to represent data in charts and graphs. When choosing a React Native chart or graph library, the following criteria must be considered:
We’ll explore these React Native chart and graph libraries and evaluate them based on the criteria mentioned above to determine which ones are most suitable for specific requirements.
Editor’s note: This article was last reviewed and updated by Emmanuel John to add information on additional React native charts libraries, including RNE-Pro, react-native-wagmi-charts, and D3.js . For a deeper dive into React Native libraries, check out our guide to the best component libraries and the top routing libraries.
The React Native community has reported several issues with data visualization libraries like CLCchart, react-native-svg-chart and react-native-echarts-wrapper. Developers have encountered errors during installation, particularly when using Yarn. One such issue involved a failed postinstall script when running yarn add CLCchart.
While reviewing react-native-svg-chart library setup, I noticed some installation errors as a result of dependency conflicts when using react-native-svg versions beyond 7.0.3, as react-native-svg-charts specifies peer dependencies for versions ^6.2.1 || ^7.0.3.
Given the lack of recent activity and the fact that these libraries have not been maintained for 6+ years now, this article’s current update excludes them.
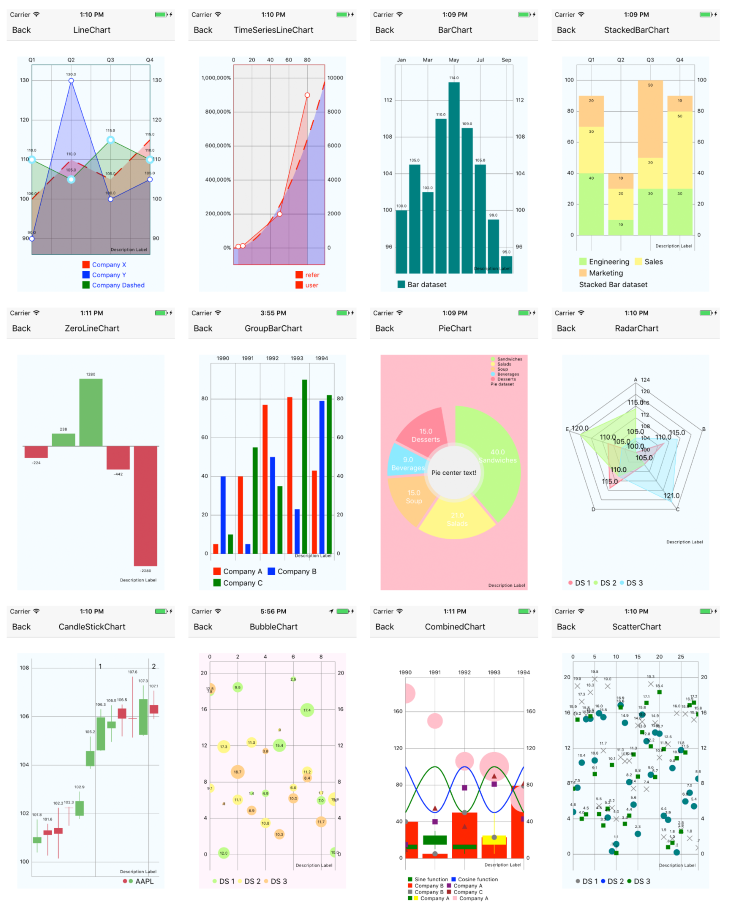
react-native-charts-wrapper is an open source library that supports both iOS and Android devices. It is based on native charting libraries such as MPAndroidChart and iOS charts. It also offers a large number of supported chart types, including line, scatter, bubble, pie, radar, bar, combined, and candlestick.
Its V0.6.0 introduces substantial improvements with an upgrade to DGCharts. Its previous iOS charting library was updated to DGCharts to prevent conflicts with Apple’s SwiftUI Charts.
As a library, react-native-charts-wrapper is well documented and explains how to get integrated into a new React Native app with a step-by-step tutorial.
It also highlights the major conventional differences between iOS and Android. For example, the color’s alpha on Android is between the range of zero to 255, and on iOS, it is zero to one. This information is helpful for someone getting started with a chart library in their mobile app for the first time.
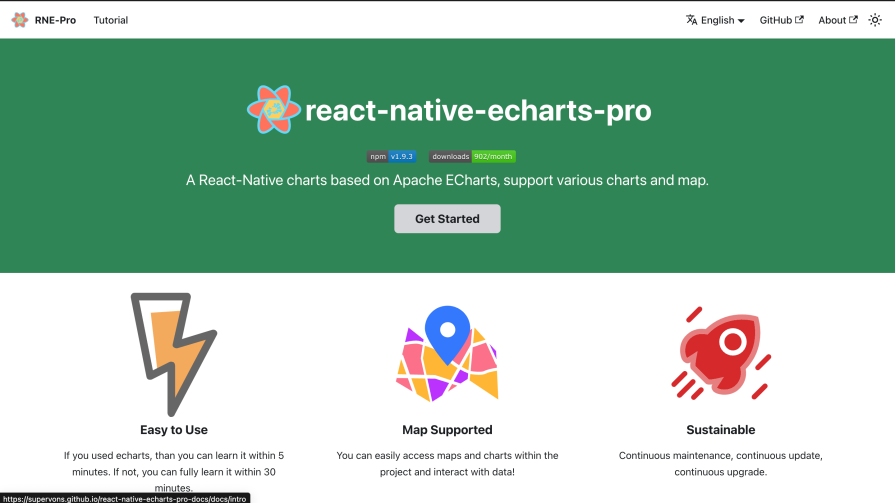
RNE-Pro is another great React Native charts library based on Apache ECharts. Its support for both charts and maps makes it very unique. It’s very easy to learn if you use Echarts for data visualization.
With its continuous updates, maintenance, and upgrades, RNE-PRO is one of the most actively maintained React Native data visualization libraries. It also has great documentation.
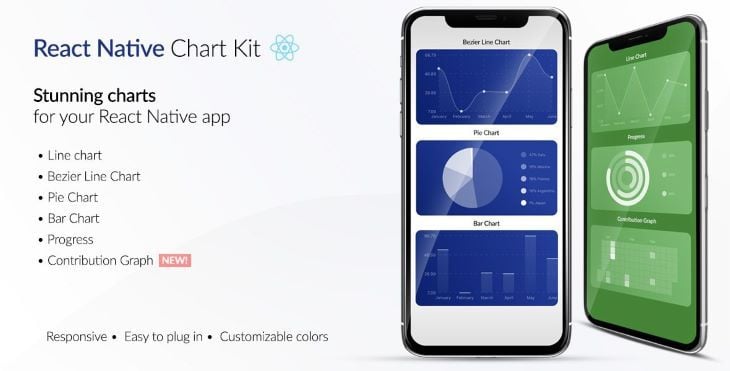
A charting library that supports both Expo apps and React Native vanilla apps is worth serious consideration.
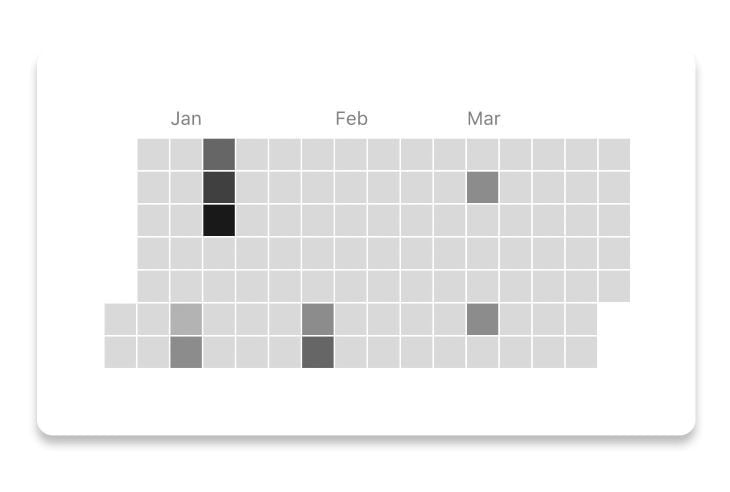
react-native-chart-kit is built on top of famous open source projects such as react-native-svg, paths-js, and react-native-calendar-heatmap. It supports patterns such as line, bezier line, pie, progress ring, stacked bar, and contribution graph (also known as a heat map).
Some of the patterns that react-native-chart-kit supports are unique when compared to other libraries mentioned in this article. Each of the patterns has its own set of props, which makes it easier to customize data on a mobile app screen:
Apart from some unique patterns, react-native-chart-kit also allows you to render a responsive chart by using the Dimensions API from React Native and calculating the width of the device’s screen. Each chart component also accepts a style prop that can be applied to the parent SVG or View component to customize the default styles of that chart pattern.
It has noticeable issues with large datasets. One such issue is the axis labels being cut off or not rendering correctly.
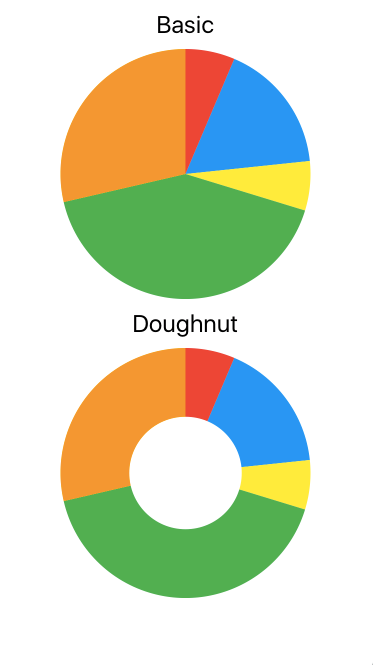
react-native-pie-chart is an open source library that is simple to use and offers two different variants to display data in the form of a pie chart. It is useful for scenarios where you are required to represent data in a pie chart but want to keep the bundle size of your app small. Most libraries, as discussed in this article, offer a variety of components and patterns that are usually going to increase the overall bundle size of the app.
react-native-pie-chart offers a set of props to apply custom styles or switches between the two shapes it offers. This makes it easy to configure and understand.
Its version 4.0.0 release now supports labels to pie chart slices, and the ability to set a gap between pie slices. These features were highly requested by the community.
Like react-native-pie-chart, react-native-responsive-linechart is dedicated to representing data in the form of lines on a mobile screen. Written completely in TypeScript, react-native-responsive-linechart has a composable API for different types of representations of a line chart. It supports adding tooltips and a large number of data points.
react-native-responsive-linechart depends on only two external libraries: react-native-svg and react-native-gesture-handler. By enabling the latter dependency, this library can support scrollable charts by setting a viewport prop.
Lastly, because it doesn’t depend heavily on other libraries and supports only one type of charting pattern, react-native-responsive-linechart has a total package size of only 62 kilobytes (unzipped).
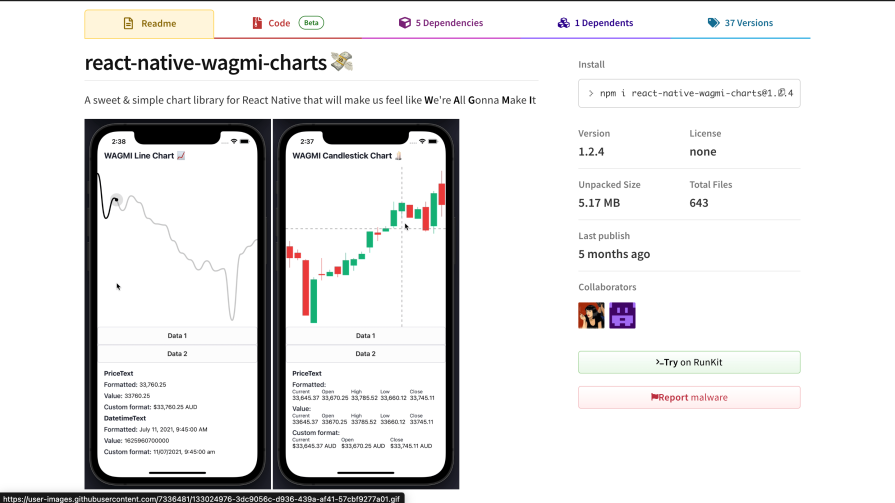 CLCchart used to be a go-to React Native chart library for stock market data, though it has since been abandoned. react-native-wagmi-charts is a better replacement with line charts, candlestick charts, smooth data transition animations, and highly customizable APIs. This makes it a great choice for financial and stock market applications.
The library currently supports only line and candlestick charts, but the following features make it an even better alternative than other React Native financial and stock market data visualization libraries:
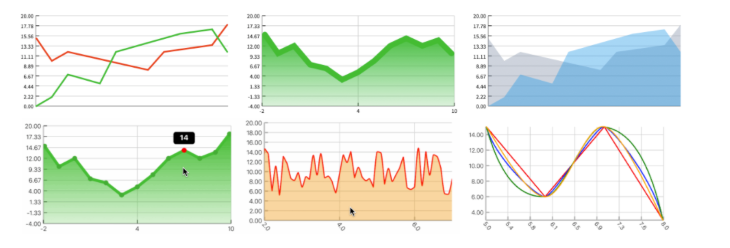
Built and maintained by a team of developers at Formidable Labs, Victory is a charting library that supports different patterns in modular forms and ready-to-use components for both React and React Native applications. The React Native variant is known as Victory Native.
All of the components provided by Victory can be used to visualize data in various formats and support complete customization in terms of styles and behavior. It is easy to install and integrate this charting library in a React Native app.
victory-native has migrated from using react-native-svg as its only peer dependency to using three peer dependencies (React Native Reanimated, Gesture Handler, and Skia) which also require explicit installation. This is because react-native-svg wasn’t designed to support dynamic updates of large number of nodes over the bridge.
Its current version was re-written from the ground up using Typescript, with improved performance. It’s now actively maintained by Nearform.
Apart from a different set of chart components that Victory supports, the library comes with many perks. One is the support of animations and transitions. With the help of an animate prop, the animation changes can be applied to a VictoryChart component. The animation is possible using d3-interpolate, which is a collection of interpolation methods.
The default transitions on a VictoryChart component are customized using props such as onEnter and onExit:
The next advantage that Victory has over other libraries mentioned in this article is the support for material and grayscale design themes. A set of colors can be defined in the form of an array, and the typography to represent the data such as the font family, font size, and letter spacing. To label a specific data set or a representation of data in a chart, VictoryTooltip is also available to add tooltips to charts.
Victory offers many configuration options and information on how to create your own custom chart components.
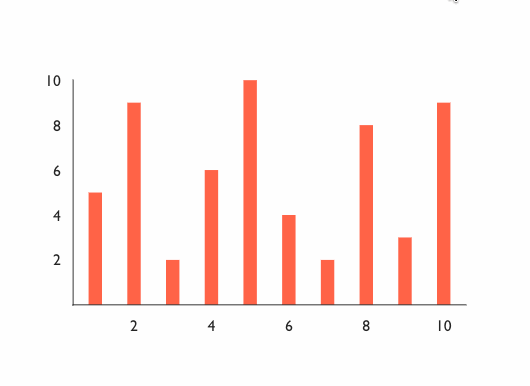
react-native-gifted-charts is a powerful library used for creating visually appealing and interactive charts in React Native applications.
react-native-gifted-charts comes with everything you need to create beautiful and animated bar, line, area, pie, donut, and stacked bar charts in React Native.
react-native-gifted-charts is clickable and scrollable, includes 3D and gradient effects, and also provides smooth animations that can be implemented using the LayoutAnimation prop. react-native-gifted-charts enables you to add animations to your charts that occur both when the chart is initially loaded and when its values are changed. This means that when a chart’s value is updated, users will experience a smooth layout transition rather than a sudden change.
Its latest released version 1.4.57 now supports new chart types such as population pyramid and radar charts. It also has smoother animations and efficient rendering with a large dataset.
One of the key benefits of using react-native-gifted-charts is its simplicity. Developers can easily integrate it into their projects and start creating charts in a matter of minutes. The library is also highly flexible, allowing developers to easily modify and extend its functionality to suit their needs.
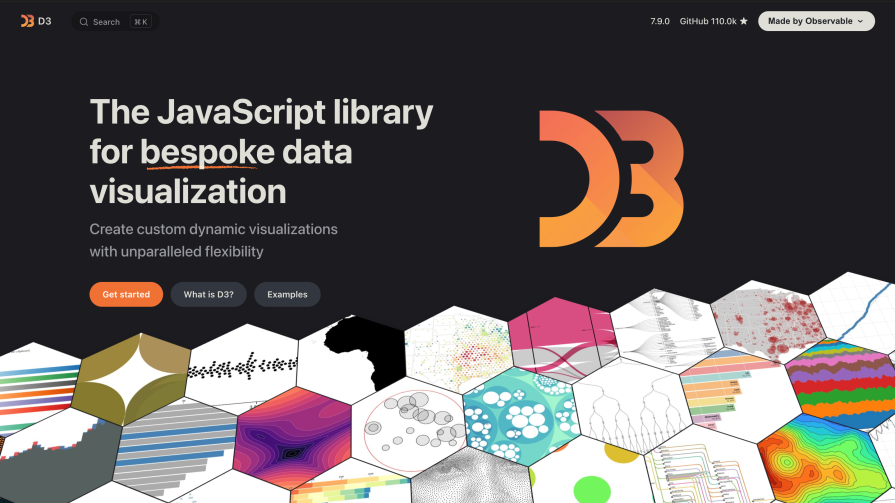 D3.js is the most powerful data visualization library in React Native, widely used in both web and mobile applications. It’s a free, open-source JavaScript library and most of the data visualization libraries discussed in this article use D3.js under the hood to create data visualization elements.
D3.js has a steep learning curve and can be very complex. You’ll need to understand concepts such as CSV parser to load data, time scale, categorical scheme, linear curve, selections, linear scale, and much more to create a single chart component.
D3.js allows you to build each chart element from scratch using react-native-svg, meaning you can build customized charts to meet your specific needs. It has one of the best documentation and learning resources.
I’d recommend D3.js for developers who want to build high-level chart libraries and are ready to build every chart component from scratch.
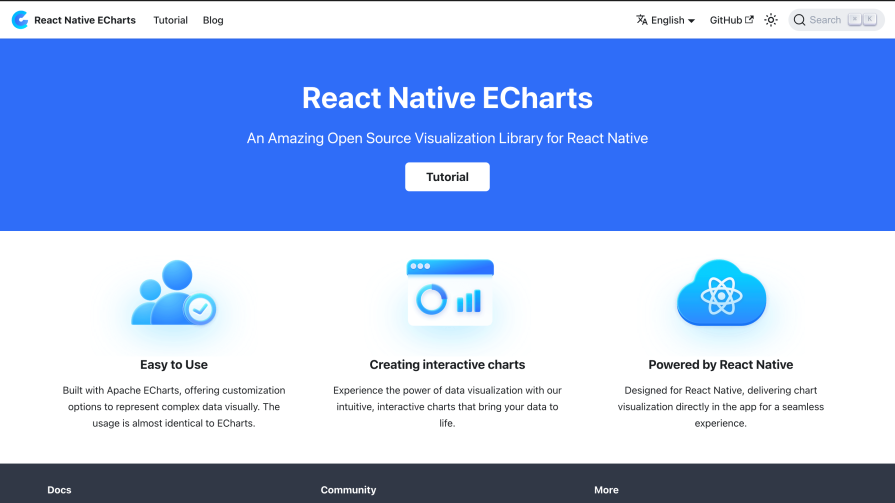
React Native ECharts is an open-source library built on Apache Echarts and designed to create interactive and customizable charts for React Native applications.
Its usage is similar to Echart and code can also be reused for web applications, making it cost-efficient and flexible. It supports Skia and SVG as the rendering libraries, allowing you to choose the option for specific use cases. It supports panning, zooming, and touch gestures for creating more interactive charts on mobile devices.
When selecting a charting library, you should choose one that meets your application’s requirements.
For instance, if you need a highly customizable charting solution, libraries like react-native-charts-wrapper and react-native-gifted-charts are excellent options.
For a project that requires a lightweight chart library with basic customization, react-native-pie-chart and react-native-responsive-linechart would be better choices.
Ultimately, selecting the most suitable charting library depends on your specific project needs, and the decision should be based on a thorough evaluation of the available options.
The open-source charting libraries included in the list are either based on personal experience or are actively maintained and have substantial popularity in the community. All the libraries covered in this article have been tested with the current React Native version (even with the New Architecture flag enabled) and they all worked perfectly.
If you are familiar with any other charting library in the React Native ecosystem that is not mentioned in this post, leave it in the comment section below and tell us why you like it.
LogRocket is a React Native monitoring solution that helps you reproduce issues instantly, prioritize bugs, and understand performance in your React Native apps.
LogRocket also helps you increase conversion rates and product usage by showing you exactly how users are interacting with your app. LogRocket's product analytics features surface the reasons why users don't complete a particular flow or don't adopt a new feature.
Start proactively monitoring your React Native apps — try LogRocket for free.
Hey there, want to help make our blog better?
Join LogRocket’s Content Advisory Board. You’ll help inform the type of content we create and get access to exclusive meetups, social accreditation, and swag.
Sign up now
Compare the Bash vs. Zsh shell command languages, explore their differences, and see how to use both successfully.

Learn how to use Swiper, a powerful JavaScript slider library, to create responsive, interactive, and smooth UI experiences for websites.
Learn how to use the Fetch API, an easy method for fetching resources from a remote or local server through a JavaScript interface.
Learn how TypeScript enums work, the difference between numeric and string enums, and when to use enums vs. other alternatives.