In your role as product manager, you have to continuously evaluate the health and direction of your product to ensure market fit and customer satisfaction. To this end, you can utilize an assessment framework to help you make data driven decisions about your product. There are a number of different ways to approach this, but the HEART framework takes a unique perspective.

HEART differentiates itself in that it focuses on the user experience and encourages you to gauge whether your product responds to user demands. By unpacking how individuals interact with your product, you can gain a better understanding of how the product performs in the real world.
In this article, you will learn what the HEART framework is, the five components that go into it, and how to set up a HEART assessment within your product team.
The HEART framework is an approach for assessing features and products from the user perspective. You can do this by assessing five key areas:
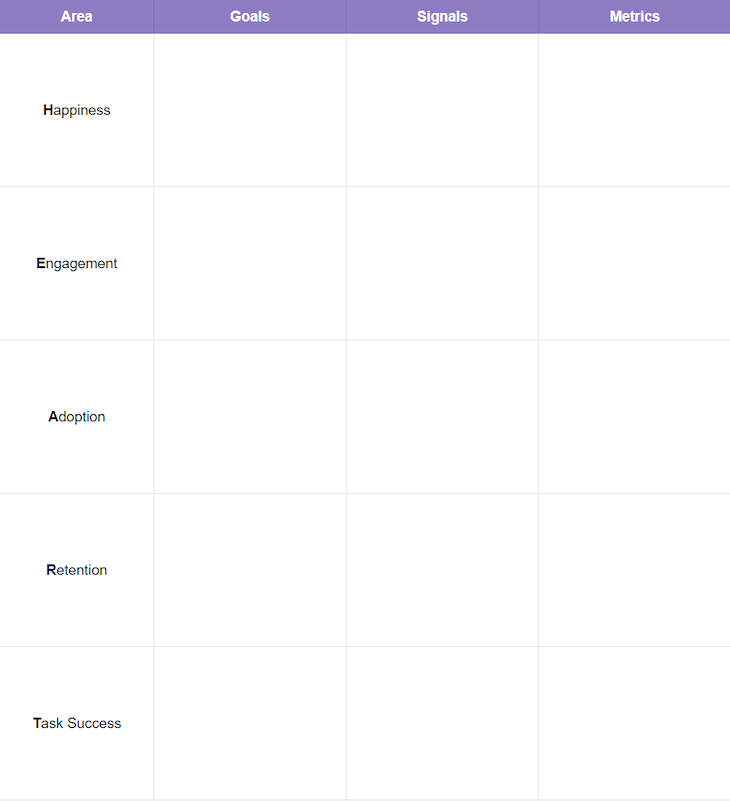
For each of those areas, you should identify goals you want the user to achieve, signals that tell you if they achieve the goals, and metrics that can help you measure completion. To help you brainstorm, you can use the following template:

It’s worth mentioning that the order of these areas is to accommodate for the acronym (HEART), and it doesn’t reflect any sort of a funnel or priority order.
You’ve probably also heard about the AARRR pirate metrics framework, and you might be asking yourself which one is better.
Let’s quickly understand the main difference between the two.
AARRR focuses on the funnel view by showing how users flow through the product from the acquisition to the revenue stages. The framework considers metrics from the business perspective and pays close attention to conversion.
HEART, on the other hand, focuses more on the user experience. Because of this, it lacks key business areas, such as acquisition or revenue. Instead, it focuses on elements such as engagement, task success, or happiness.
Ultimately, both serve different purposes, and you’d use them for different reasons.
Want to better understand user drop-offs and why your acquisition efforts don’t yield results? Map your AARRR funnel.
Are you trying to better understand and optimize the user experience? Use the HEART framework.
Now let’s take a closer look at the five primary areas covered by the HEART framework:
As intangible as it is, making your users happy and satisfied is always a good thing. It’s also an area often neglected by other frameworks and approaches. Ultimately, the happier the users are, the better they retain, and the higher the chance they’ll pay.
The more users engage with your product, the higher the chances are that they’ll eventually get hooked and build strong habits around it.
Keeping users engaged for the long run is one of the most important objectives of most products.
In this case, adoption is a mix of acquisition and activation. You try to answer the question of whether users discover the product/feature and if they understand the value it can provide to them.
Not separating acquisition and activation is also one of the most controversial parts of the framework, and PMs both support and oppose this approach.
Retention is the most potent indicator of your product offering’s success. If users stick with you, you’re doing something right.
To be successful, your product must be easy to use and help users achieve their tasks smoothly.
A great user experience ensures that users can achieve whatever they want quickly and without any needless friction.
Each of the five areas of the HEART framework can then be broken down into three more elements:
Start by defining a high-level objective for each of the five areas identified, focusing on the user behavior you want to see.
For example, if you are building a product or feature that’s supposed to be fun and joyful, you could define a goal for happiness as “users get a lot of joy and laughter using the feature”.
On the other hand, if your solution focuses on a quick and distraction-less experience for busy professionals, the definition of a happy user would probably be closer to “the experience is smooth and distraction-less”.
Invest some time in deciding the main goal for the phase and what type of happiness, engagement, etc., you’d like to see in your users’ actions. These goals will help you define your product development direction and focus your design process.
Signals refer to user actions indicating that they achieved the goals you want them to achieve.
For example, a signal that users find the app joyful and amusing could be:
If you are PM for Duolingo and your goal for engagement is that “users practice their language skills regularly”, signals could include:
Signals are only as helpful as your ability to measure and analyze them, so the next step is to develop meaningful and trackable metrics.
Since not everything is measurable, you often have to develop some proxies.
Measuring Duolingo engagement signals with corresponding metrics is relatively obvious. However, measuring signals for “users creating fun social media (TikTok, Instagram) content related to the product” is a bit tricky.
An example of a proxy would be to have a brand-name hashtag and track how often it appears on social media channels.
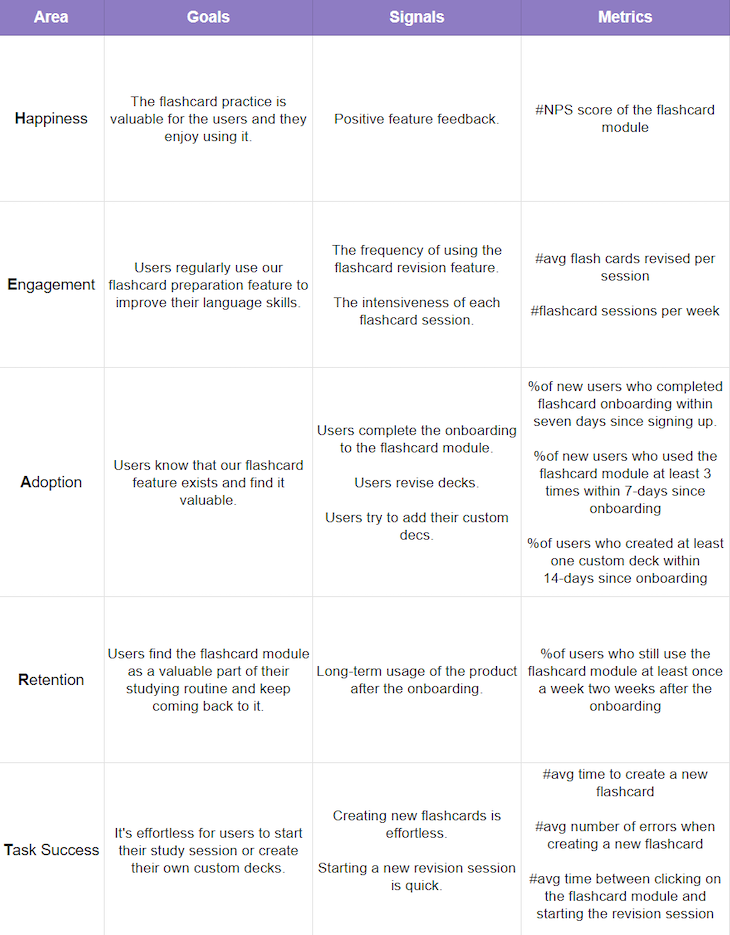
Let’s say you’re a PM for an EdTech product, and you just created a new feature — a flashcard revision module.
Using the template from before, you might come up with something like this:

Mapping out your new feature with the HEART framework gives you valuable inputs for further decision-making, such as:
By naming and understanding the goals for our feature, we can set meaningful outcomes and OKRs to pursue in the long run.
By clearly identifying signals that you care about, you can narrow down your roadmap and focus on improvements that target these signals. This is more effective than using generic prioritization frameworks that don’t include the most crucial factor — the context.
By understanding exactly how exactly you want to measure the signals that indicate the success of your objectives, you can plan proper instrumentation to gather and analyze the data you need.
And this is just the first draft. As you keep developing the feature and understanding your users better, you’ll be able to give even more specificity to the HEART template, adjust your goals, and remove less relevant signals and metrics.
HEART helps you identify the most important things to focus on when developing new products and features.
It focuses on the user experience and evaluates it through the lenses of:
For each of these areas, you define what goals you want to help your users achieve, which signals will indicate that you’re successful, and what metrics can help you measure the success.
It helps you narrow the focus, plan the next steps on your roadmap and clearly define which metrics and data points are most important for you.
Whether you are at a solution-definition phase or evaluating an existing solution, assessing the feature through the lenses of the HEART framework will help you uncover extra insights and force you to answer difficult, but important questions.
Featured image source: IconScout
LogRocket identifies friction points in the user experience so you can make informed decisions about product and design changes that must happen to hit your goals.
With LogRocket, you can understand the scope of the issues affecting your product and prioritize the changes that need to be made. LogRocket simplifies workflows by allowing Engineering, Product, UX, and Design teams to work from the same data as you, eliminating any confusion about what needs to be done.
Get your teams on the same page — try LogRocket today.

Christina Valls shares how her teams have transformed digital experiences at Cedars-Sinai, including building a digital scheduling platform.

Red-teaming reveals how AI fails at scale. Learn to embed adversarial testing into your sprints before your product becomes a headline.

Cory Bishop talks about the role of human-centered design and empathy in Bubble’s no-code AI development product.

Learn how to reduce mobile friction, boost UX, and drive engagement with practical, data-driven strategies for product managers.