In agile, one metric stands out as a powerful gauge of a team’s productivity and effectiveness: team velocity. Team velocity is more than just a number; it’s a reflection of a team’s collective capabilities, their ability to collaborate, and their capacity to deliver outcomes consistently.

If you’re a product manager, understanding team velocity is essential for achieving success and satisfying your stakeholders. So, let’s dive in and uncover the secrets behind this vital agile metric that can propel your team to new heights of efficiency and collaboration.
Team velocity is a way of measuring a team’s effective productivity during an iteration. It indicates the amount of work a team can accomplish. Furthermore, it also shows the team’s dedication to finishing tasks within a specific time frame.
With team velocity in mind, teams can streamline the planning of forthcoming sprints, making it simpler to anticipate and oversee advancement.
Typically, team velocity is the average story point completed per sprint. You can calculate with the following:
Team velocity = total story points completed / number of sprints
To start tracking team velocity, you can use the data from the past three sprints to calculate the team’s initial velocity as a baseline. This baseline provides a great starting point for improvement efforts in the future.
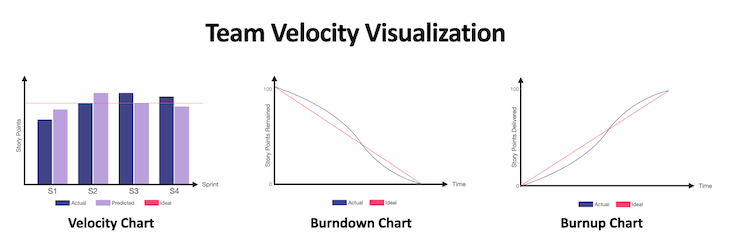
Visualization helps agile teams to track progress, make data-driven decisions, and communicate effectively with stakeholders. There are a few ways to visualize team velocity:

In a velocity chart, the actual delivered story points and the predicted story points are shown. You can easily see the difference between the two and have a high-level idea of the variance between sprints.
A burndown chart plots the remaining work on the vertical axis against the sprint’s time frame on the horizontal axis. A burnup chart complements the burndown chart by showing both completed work and the total work scope over time.
Choose the visualization methods that best suit your team’s needs and preferences. Often, a combination of these visualizations is used to provide a comprehensive view of sprint velocity and progress throughout the Agile development process.
Measuring team velocity in agile development is a valuable practice that helps teams plan, improve, and manage their work effectively. It will help you with the following:
Product managers can predict how much work a team can complete in future sprints by analyzing historical velocity data. This helps with release planning and managing stakeholder expectations. Moreover, it allows teams to allocate the appropriate amount of work for each sprint.
Team velocity is a valuable communication tool with stakeholders. It allows product managers and product owners to explain why certain features or user stories are prioritized based on the team’s capacity. It also helps in setting “realistic expectations” with stakeholders regarding project timelines.
However, be cautious that team velocity can only provide “realistic expectations. The velocity is based on story points which result from a certain level of “guesswork.” Be sure to consider other factors in making commitments.
Team velocity indicates the health of productivity. By looking at team velocity, product managers can assess the impact of process improvements or changes in team composition. If velocity increases after implementing a new practice or tool, it provides evidence that the change has been beneficial. On the opposite side, if velocity decreases, it signals that adjustments may be needed.
When a team consistently measures and analyzes the team velocity, they can identify trends and potential issues early on. If velocity starts to decline, it may indicate bottlenecks, scope changes, or other issues that need to be addressed. This early warning system can help teams take corrective actions to mitigate risks and stay on track.
By “improving” team velocity, we’re talking about two things — stabilization and increase. It’s intuitive to want to have a high team velocity. However, having a “stable” team velocity is equally important. It helps better capacity planning and morale.
Velocity fluctuations can even lead to frustration among stakeholders who rely on reliable delivery timelines. To avoid these, practice the following strategies:
First of all, as a product leader, you want to ensure that the team has a consistent and well-understood definition of what constitutes a “done” user story or task. The specific elements of the definition of done may vary from team to team, but some common components are here:
Standardizing work units, such as story points, can help in estimating and tracking progress accurately. Though story points can be abstract, they do serve as a reasonable quantifier tailored just for your team. Story estimation can improve as time goes on and as teams are able to provide feedback on the difficulty of what they work on.
Moreover, keep the user stories small and manageable. Break down larger features into smaller, more manageable user stories. Smaller work items are easier to estimate and complete within a sprint.
After each sprint, conduct a retrospective to identify what went well and what needs improvement. Implement changes based on these insights to enhance team efficiency. You want to encourage a culture of continuous improvement. Celebration is also crucial. Make sure the team celebrates the successes and achievements, big or small. Recognize and reward team members for their hard work and contributions.
Do not compare two different teams’ numbers of velocity because, remember, team velocity is an arbitrary number and the story points are all just relative. Team A having 50 story points a sprint is not necessarily “better” or “faster” than team B having 30 story points a sprint. Other factors, such as code quality, customer satisfaction, and adaptability to change, should also be considered when assessing a team’s overall effectiveness.
It’s important to be mindful that team velocity should not be the sole measure of a team’s performance. Team velocity is merely an arbitrary number that only applies to one team. Product managers should maintain a broader focus on delivering value, maintaining quality, and continually improving their processes to achieve successful outcomes for their customers, users, and stakeholders.
Team velocity provides a data-driven basis for planning, communication, and risk management. It also helps in identifying trends and improvements in the team’s productivity over time. However, it’s important to note that team velocity can vary over time as the team’s composition changes or as they improve their processes, so it should be used as a guide rather than a rigid target.
Featured image source: IconScout

LogRocket identifies friction points in the user experience so you can make informed decisions about product and design changes that must happen to hit your goals.
With LogRocket, you can understand the scope of the issues affecting your product and prioritize the changes that need to be made. LogRocket simplifies workflows by allowing Engineering, Product, UX, and Design teams to work from the same data as you, eliminating any confusion about what needs to be done.
Get your teams on the same page — try LogRocket today.

A product manager’s guide to deciding when automation is enough, when AI adds value, and how to make the tradeoffs intentionally.

How AI reshaped product management in 2025 and what PMs must rethink in 2026 to stay effective in a rapidly changing product landscape.

Deepika Manglani, VP of Product at the LA Times, talks about how she’s bringing the 140-year-old institution into the future.

Burnout often starts with good intentions. How product managers can stop being the bottleneck and lead with focus.