When you think about digital product metrics, your mind probably goes to things like engagement rates, conversion metrics, and churn statistics. These numbers are easy to quantify, chart, and report on — but they’re not the full story. Beneath the surface lie invisible metrics like trust, user satisfaction, brand perception, emotional engagement, and product stickiness. These metrics are harder to measure, but they’re essential for building products that stand the test of time.

Invisible metrics help you understand the “why” behind user behavior. By focusing on these deeper, qualitative insights, you can create meaningful, data-driven strategies that foster long-term loyalty and retention.
This article explores the importance of these invisible metrics, tools for measuring them, and actionable strategies for product managers to drive trust, satisfaction, and more.
Metrics like daily active users (DAUs) and monthly active users (MAUs) are great for measuring activity, but they don’t capture the quality of your user experience. Invisible metrics, however, reflect the emotional and psychological aspects of a user’s journey — aspects that are critical to a product’s success but often overlooked because they are harder to quantify.
A secure payment system, transparent policies, and timely support are trust signals that influence whether users stick with a product. Meanwhile, satisfaction metrics like your net promoter score (NPS) and customer satisfaction score (CSAT) can reveal how users feel about the product, not just how they use it. Together, trust and satisfaction serve as the foundation for long-term user relationships.
Brand perception determines whether users see your product as credible, innovative, or reliable. A strong brand perception can turn casual users into advocates.
Emotional engagement taps into how a product makes users feel. Positive emotions create memorable experiences that users want to relive.
Product stickiness ensures users form habits around your product. Sticky products integrate seamlessly into users’ lives, becoming indispensable over time.
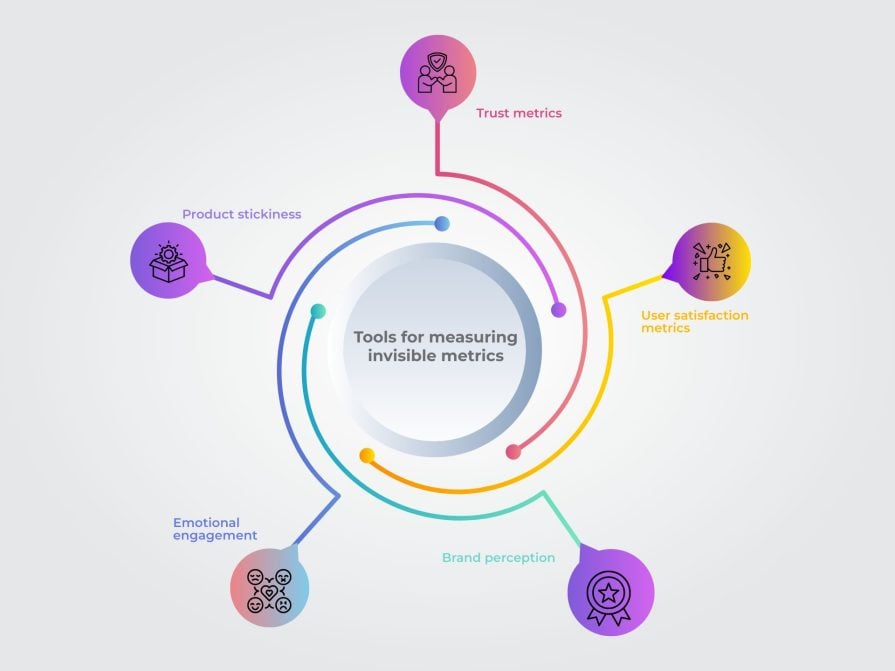
Measuring invisible metrics requires a mix of quantitative tools and qualitative insights. Here’s how to get started:
Once you’ve measured these metrics, the next step is to use the insights to improve your product.
To help you understand invisible product metrics better, this section provides you with examples of how real-world companies use them to build successful products.
Airbnb’s success in the highly competitive short-term rental market is deeply rooted in its focus on trust as an invisible metric. Initially, users were hesitant to trust the idea of staying in strangers’ homes or hosting strangers. Airbnb tackled this head-on by introducing several trust-building features:
By prioritizing trust metrics, Airbnb saw a significant rise in user adoption, growing from 21,000 guests in 2009 to over 150 million users worldwide as of 2023. Trust metrics also played a pivotal role in ensuring a 4.7-star average review rating, which has become a benchmark for customer satisfaction.
Duolingo, the language-learning app, excels in creating emotional engagement — a critical invisible metric for retention. Learning a language is a long, often frustrating process, but Duolingo keeps users hooked by transforming learning into a gamified experience:
By focusing on emotional engagement, Duolingo achieved a retention rate of over 55 percent for users completing their first week on the app, compared to an industry average of 20 percent. It has also become the world’s most downloaded education app, with over 800 million users as of December 2024.
Tesla’s dominance in the electric vehicle (EV) market stems not just from its technological innovation but also from its strategic management of brand perception. Tesla’s invisible metrics focus on credibility, innovation, and user trust:
Tesla’s strategic focus on brand perception has solidified it as the leader in the EV market, holding over 65 percent market share in the U.S. as of 2022. Its NPS of 96 (compared to the automotive industry average of 59) highlights the effectiveness of these efforts in fostering trust and loyalty.
The success of Airbnb, Duolingo, and Tesla demonstrates that measuring and improving invisible metrics like trust, emotional engagement, and brand perception is essential for product success. By leveraging these strategies, you can create products that resonate deeply with users, ensuring long-term loyalty and a competitive edge in the market.
Invisible metrics like trust, satisfaction, perception, emotional engagement, and stickiness are not just nice-to-have — they’re essential for creating successful, enduring products. By measuring and improving these metrics, you can go beyond surface-level analytics to deliver meaningful, human-centered experiences.
Invest in the invisible. The better you understand what drives user loyalty and trust, the better positioned your product will be to thrive in a competitive landscape. Good luck!
Featured image source: IconScout

LogRocket identifies friction points in the user experience so you can make informed decisions about product and design changes that must happen to hit your goals.
With LogRocket, you can understand the scope of the issues affecting your product and prioritize the changes that need to be made. LogRocket simplifies workflows by allowing Engineering, Product, UX, and Design teams to work from the same data as you, eliminating any confusion about what needs to be done.
Get your teams on the same page — try LogRocket today.

Learn how to choose and adapt product management frameworks based on your product stage, constraints, problem type, and business context.

Learn when streaks improve retention, when they create fragile engagement, and how PMs can design healthier systems around user progress.

A technical debt register brings transparency and clarity as to what type and how much debt you have and can be used to monitor and review your debt ratio.

Memos don’t have to be complicated. Just keep them clear, concise, and focused on actionable items. More on that in this blog.


