Data visualization interfacing, also known as dashboarding, is an integral part of data analysts’ skillset. Dashboards and data apps are used everywhere now, from reporting your analysis through a series of visuals to showcasing your machine learning apps.
When there is data involved, so is Python. Specifically, we are talking about its Dash library, which is built on top of one of the hottest graphing libraries, Plotly.
Dash makes it a breeze to create and share your data analysis through interactive dashboards using only Python code. There is no need to learn HTML, CSS, or complex JavaScript frameworks like React.js.
In this tutorial, you’ll get a glimpse of what Dash can do and how to integrate it into your workflow.
You can install dash with pip. You should also install pandas library to work with datasets:
pip install dash pandas
The above command also installs plotly. Plotly is known for its interactive charts, and both Plotly and Dash are created by Plotly Software Foundation, so the libraries work pretty well together.
A powerful framework like Dash has a few requirements. First, you must know Plotly Python as Dash can only display Plotly’s interactive charts.
Next, you need a basic understanding of HTML and CSS. Dash is like React but in Python. It is a template framework where you can build a data website without JavaScript.
A dashboard contains multiple visuals, and it is up to the user how all these visuals are displayed on a single page. Plotly handles the visuals, but the layout aspect is all up to Dash and its HTML components.
Let’s create our Dash app. After the installation, we import the following libraries:
import dash
import dash_core_components as dcc
import dash_html_components as html
import plotly.express as px
import pandas as pd
dash is the global library containing all the core features. The dash_core_components and dash_html_components are libraries that are installed with dash by default. They include Dash-specific features and Python representation of HTML components (tags). More on them later.
Any Dash app starts with the following command:
app = dash.Dash(name="my_first_dash_app")

>>> app
<dash.dash.Dash at 0x1ee6af51af0>
The above code creates all the boilerplate code for a blank website. We don’t want a blank page, so let’s populate it.
First, we load a built-in dataset from Plotly and create a simple scatterplot:
# Load dataset using Plotly
tips = px.data.tips()

fig = px.scatter(tips, x="total_bill", y="tip") # Create a scatterplot
Then, we add this figure to our app’s layout attribute inside a div tag with a few texts:
app.layout = html.Div(children=[
   html.H1(children='Hello Dash'),  # Create a title with H1 tag

   html.Div(children='''
       Dash: A web application framework for your data.
   '''),  # Display some text

   dcc.Graph(
       id='example-graph',
       figure=fig
   )  # Display the Plotly figure
])

if __name__ == '__main__':
   app.run_server(debug=True) # Run the Dash app
Here, we create the HTML tags using the dash_html_components (html) library and the figure using the core components (dcc) library.
The H1 title tag is followed by a div that contains a simple text, then the graph itself using the Graph function of dcc. All of these are inside a single DIV tag’s children attribute.
In the end, we also add the command that runs our app in debug mode, meaning the changes take effect as the script changes. Here is the complete code so far:
import dash
import dash_core_components as dcc
import dash_html_components as html
import plotly.express as px
import pandas as pd

# Create the app
app = dash.Dash(__name__)

# Load dataset using Plotly
tips = px.data.tips()

fig = px.scatter(tips, x="total_bill", y="tip") # Create a scatterplot

app.layout = html.Div(children=[
   html.H1(children='Hello Dash'),  # Create a title with H1 tag

   html.Div(children='''
       Dash: A web application framework for your data.
   '''),  # Display some text

   dcc.Graph(
       id='example-graph',
       figure=fig
   )  # Display the Plotly figure
])

if __name__ == '__main__':
   app.run_server(debug=True) # Run the Dash app
Put it inside a Python script and run it. You will get a message in the terminal telling you to go to this link: http://127.0.0.1:8050/
So, let’s go:
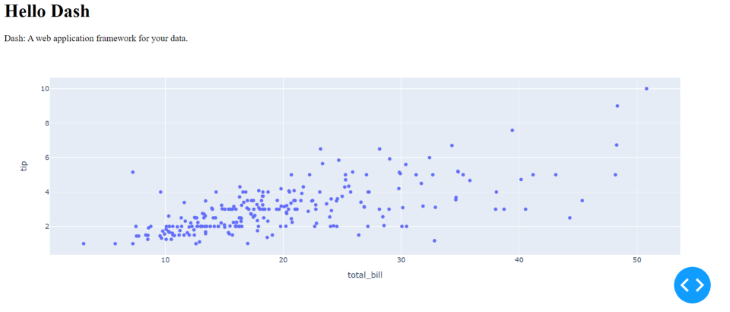
In the next sections, we will dig into the details of what we did here.
Let’s start with the layout attribute. It is the single attribute that contains all your HTML components and figures. You should pass all your visuals and HTML tags to it in a final DIV tag.
Depending on the size of your project, this attribute can get pretty large, so I recommend creating all your HTML tags and figures in separate variables, then pass them to the layout.
For example, here is what the above app would look like:
app = dash.Dash(name="app")

# Load dataset using Plotly
tips = px.data.tips()

fig = px.scatter(tips, x="total_bill", y="tip")  # Create a scatterplot

title = html.H1("Hello Dash!")
text_div = html.Div("Dash: A web application framework for your data.")
graph_to_display = dcc.Graph(id="scatter", figure=fig)

app.layout = html.Div(children=[title, text_div, graph_to_display])
This is much neater and more compact, and this is one of the things that you won’t learn from the Dash docs. It is full of nested code instead of doing the above.
Let’s discuss how HTML and CSS work in Dash. The dash_html_components sub-library contains the most common HTML tags such as divs, buttons, text boxes, captions, title tags (H1-6), etc.
These are implemented in Python code under relevant names as a representation of their HTML counterparts. So, a code like below:
import dash_html_components as html

html.Div([
   html.H1('Hello Dash'),
   html.Div([
       html.P('Dash converts Python classes into HTML'),
       html.P("This conversion happens behind the scenes by Dash's JavaScript frontend")
   ])
])
Will be interpreted by your browser like this:
<div>
   <h1>Hello Dash</h1>
   <div>
       <p>Dash converts Python classes into HTML</p>
       <p>This conversion happens behind the scenes by Dash's JavaScript front-end</p>
   </div>
</div>
All HTML tags under this sub-library contain these general arguments:
id: the same as the the id attribute of HTML tagsclassName: the same as the class attribute HEYYYof HTML tagsstyle: the same as the style attribute of HTML tags but only accepts a dictionary of CSS styleschildren: the first argument of most HTML componentsHere is an example div, with a few customizations:
app = dash.Dash(name="app")

app.layout = html.Div(
   children=html.H3("Simple Div"),
   id="sample_div",
   className="red_div",
   style={"backgroundColor": "red"},
)

if __name__ == "__main__":
   app.run_server(debug=True)
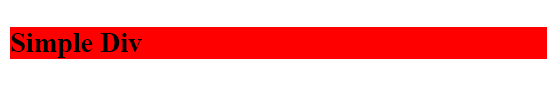
The children argument is unique — it can accept numbers and strings, but, most of the time, you pass other HTML components inside a list if it is a container tag like a div.
A note on CSS styles: most CSS style attributes use hyphens to break words. When you pass them to Dash’s style argument, they should follow camelCase like backgroundColorinstead of background-color.
I highly recommend you learn about these HTML tags, as these are the only things that keep together the layout of your app. Here is a complete list of HTML tags Dash supports.
Another essential part of Dash is its core components. The dash_core_components library contains a few other HTML tags but is already built-in with a few CSS and JavaScript flairs.
Some examples include dropdowns, sliders, download and upload functionalities, and a component to display Plotly Graphs.
Here are a few examples of these components, starting with a dropdown:
import dash
import dash_core_components as dcc
import dash_html_components as html

app = dash.Dash(__name__)

app.layout = html.Div([
   dcc.Dropdown(
       options=[
           {'label': 'FC Barcelona', 'value': 'FCB'},
           {'label': 'Real Madrid', 'value': 'RM'},
           {'label': 'Manchester United', 'value': 'MU'}
       ],
       value='FCB' # The default value to display
   )
])

if __name__ == '__main__':
   app.run_server(debug=True)
A multi-dropdown:
app = dash.Dash(__name__)

app.layout = html.Div([
   dcc.Dropdown(
       options=[
           {'label': 'FC Barcelona', 'value': 'FCB'},
           {'label': 'Real Madrid', 'value': 'RM'},
           {'label': 'Manchester United', 'value': 'MU'}
       ],
       multi=True,
       value="FCB"
   )
], style={"width": 200})

if __name__ == '__main__':
   app.run_server(debug=True)
A slider with labeled breakpoints:
import dash
import dash_core_components as dcc
import dash_html_components as html

app = dash.Dash(__name__)

app.layout = html.Div([
   dcc.Slider(
       min=0,
       max=9,
       marks={i: 'Label{}'.format(i) for i in range(10)},
       value=5,
   )
])

if __name__ == '__main__':
   app.run_server(debug=True)
There’s a universal value attribute that represents the default value when a component is rendered for the first time.
You can see the complete list of core components here.
As a final example, take a look at the below app:
import seaborn as sns

app = dash.Dash(__name__)

diamonds = sns.load_dataset("diamonds")

scatter = px.scatter(
   data_frame=diamonds,
   x="price",
   y="carat",
   color="cut",
   title="Carat vs. Price of Diamonds",
   width=600,
   height=400,
)
histogram = px.histogram(
   data_frame=diamonds,
   x="price",
   title="Histogram of Diamond prices",
   width=600,
   height=400,
)
violin = px.violin(
   data_frame=diamonds,
   x="cut",
   y="price",
   title="Violin Plot of Cut vs. Price",
   width=600,
   height=400,
)

left_fig = html.Div(children=dcc.Graph(figure=scatter))
right_fig = html.Div(children=dcc.Graph(figure=histogram))

upper_div = html.Div([left_fig, right_fig], style={"display": "flex"})
central_div = html.Div(
   children=dcc.Graph(figure=violin),
   style={"display": "flex", "justify-content": "center"},
)
app.layout = html.Div([upper_div, central_div])

if __name__ == "__main__":
   app.run_server(debug=True)
We import the Diamonds dataset from Seaborn and create three charts: a scatterplot, a histogram, and a violin plot. We want to display the scatterplot and violin plot next to each other and put the violin plot right below in the center.
For this, we create two divs to contain the scatter plot and violin plot, left_figure and right_figure. Then, these two divs are put into another div – upper_div for simplicity.
We set a CSS style of flex-box to this div, which puts the figures side-by-side.
Then, we create the central div that contains the violin plot, and we center it using flex-box and its justify-content attribute.
Finally, we put everything into the layout inside a final DIV and run the script. Here is the final output:
Here is a summary of the steps to create a basic Dash app:
dash.Dash and give it any nameEven though we have covered many basics like HTML, core components, and app layout, we have barely scratched the surface of what Dash can do.
I showed you many examples of interactive HTML components, but not how to integrate them into your app. How can you update your graphs based on user input like sliders, text inputs, or something similar?
That’s where callbacks come in. It’s a powerful and central feature of Dash. To use callbacks, you define functions in Dash that fire off when a component is changed by the user, and the function modifies another component based on this event.
Dash devotes a large section in the docs just to explain callbacks, as they are hard to wrap your head around at first. I suggest you go there as the next step.
Check out the example gallery where you can see and enjoy some very cool projects built with Dash. The best part is that many of them are open-source, meaning you can learn much from their source codes and get inspired. Thanks for reading!
Install LogRocket via npm or script tag. LogRocket.init() must be called client-side, not
server-side
$ npm i --save logrocket

// Code:

import LogRocket from 'logrocket';
LogRocket.init('app/id');
// Add to your HTML:

<script src="https://cdn.lr-ingest.com/LogRocket.min.js"></script>
<script>window.LogRocket && window.LogRocket.init('app/id');</script>

Discover how React Fiber works under the hood. Learn how React builds the DOM, handles concurrent rendering, and works alongside React 19 features and the new React Compiler.

Learn how to use Skybridge, an open-source React framework, to build and deploy cross-platform AI apps and interactive UI widgets for ChatGPT, Claude, and MCP clients from a single codebase.

Learn how to set up Meilisearch, index documents, and build keyword, semantic, and hybrid search with AI-powered retrieval.
Compare pnpm and npm across security defaults, disk usage, dependency strictness, and workspace policy to decide which package manager fits your project.
Would you be interested in joining LogRocket's developer community?
Join LogRocket’s Content Advisory Board. You’ll help inform the type of content we create and get access to exclusive meetups, social accreditation, and swag.
Sign up now