
D3.js is a JavaScript library that allows you to create tailored data visualizations. While most tutorial examples use charts to illustrate its usage, D3.js is a lot more powerful than a traditional charting library. It allows you to create highly custom, flexible data visualizations in many different formats.

In this guide, our goal is to give you all the information you need to convince your team to use D3.js or determine whether an alternative might better suit your needs. If you are considering D3.js for your project, let’s get into the details so you can make your final decision.
The Replay is a weekly newsletter for dev and engineering leaders.
Delivered once a week, it's your curated guide to the most important conversations around frontend dev, emerging AI tools, and the state of modern software.
D3.js originated from Protovis, a declarative JavaScript graphical data visualization library that was created by Mike Bostock and Jeff Heer of the Stanford Visualization Group, with significant help from Vadim Ogievetsky.
Protovis was first released in April 2009 and was discontinued after its final v3.3.1 on June 28, 2011. D3.js was invented by the same team and built on many of the concepts of Protovis, making a big leap forward from Protovis with improved support for animation, interactions, and flexibility.
There are several data visualization libraries in the JavaScript ecosystem. However, D3.js has been at the forefront for several years. Not only this, but D3.js is also the underlying library behind many other available data visualization libraries.
Some of the reasons why I typically prefer D3.js over other data visualization libraries include:
While I admire D3.js, I think it’s also fair to mention that it’s not a perfect library. It also has some cons, including:
Now that we’ve gone over the background, benefits, and drawbacks of D3.js, let’s explore how it works.
D3.js takes both the data to be visualized and the graphics you want to use for the visualization and binds them to the DOM in a flexible way, allowing you to manipulate, add, or update your data easily. This makes it possible for you to build very complex visualizations customized to your needs.
For example, the code below will render a simple bar chart in the browser. You can easily copy and paste it into your code editor to test it:
<!DOCTYPE html>
<div id="simple-chart"></div>
<script type="module">
import * as d3 from "https://cdn.jsdelivr.net/npm/d3@7/+esm";
// Set chart dimensions.
const width = 300;
const height = 150;
// Sample data.
const data = [10, 20, 30, 40, 50];
// Create SVG container.
const svg = d3.create("svg")
    .attr("width", width)
    .attr("height", height);
// Create bars for each data point.
svg.selectAll("rect")
    .data(data)
    .enter()
    .append("rect")
    .attr("x", (d, i) => i * 60)
    .attr("y", d => height - d)
    .attr("width", 50)
    .attr("height", d => d)
    .attr("fill", "steelblue");
let chartContainer = document.getElementById("simple-chart");
// Append SVG to the chart container.
chartContainer.append(svg.node());
</script>
The code above will render the following bar chart:
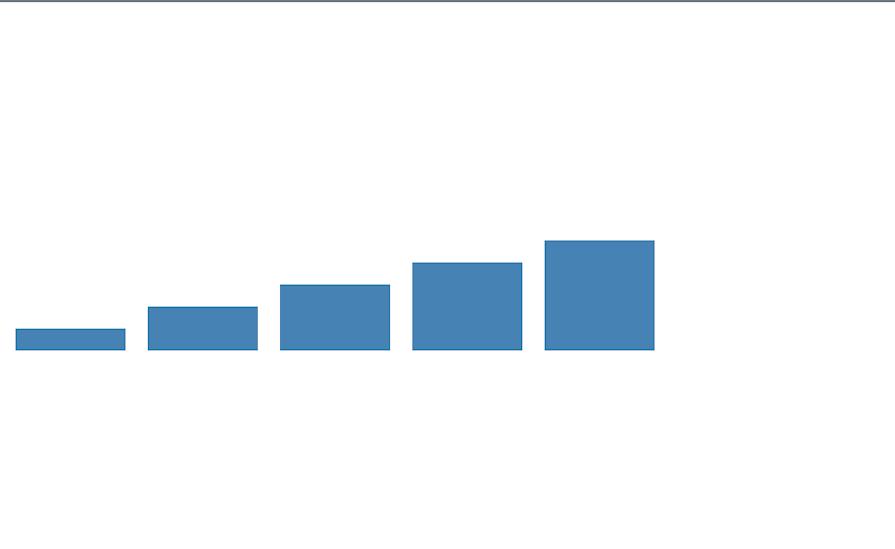
Let’s break down a few notable parts of the code block above. One thing you’ll notice is that every part of the bar chart is drawn on top of an svg container:
const svg = d3.create("svg")
    .attr("width", width)
    .attr("height", height);
This is because SVG makes it a lot easier to draw shapes. For example, a rect is a built-in SVG element that defines a rectangle shape.
We selected all existing rect elements — and made sure to create a new rect for each data element if it didn’t already exist — with the help of the enter() function:
svg.selectAll("rect")
    .data(data)
    .enter()
    .append("rect")
    .attr("x", (d, i) => i * 60)
    .attr("y", d => height - d)
    .attr("width", 50)
    .attr("height", d => d)
    .attr("fill", "steelblue");
Finally, we append the SVG we created to the D3 object, as shown in this part of the code:
<div id="simple-chart"></div>
let chartContainer = document.getElementById("simple-chart");
// Append SVG to the chart container.
chartContainer.append(svg.node());
This is just the tip of the iceberg for what you can do with D3.js. To get a better sense of this library’s capabilities, let’s look at some of its standout features.
Digging deep into the D3.js documentation is the recommended way to gain in-depth knowledge of the tool. However, if you’re looking to evaluate the functionalities and start practicing immediately, here are some key features to look out for.
D3.js gives you the tools to create any kind of data visualization you can imagine by leveraging your skills in D3.js, JavaScript, HTML, and CSS.
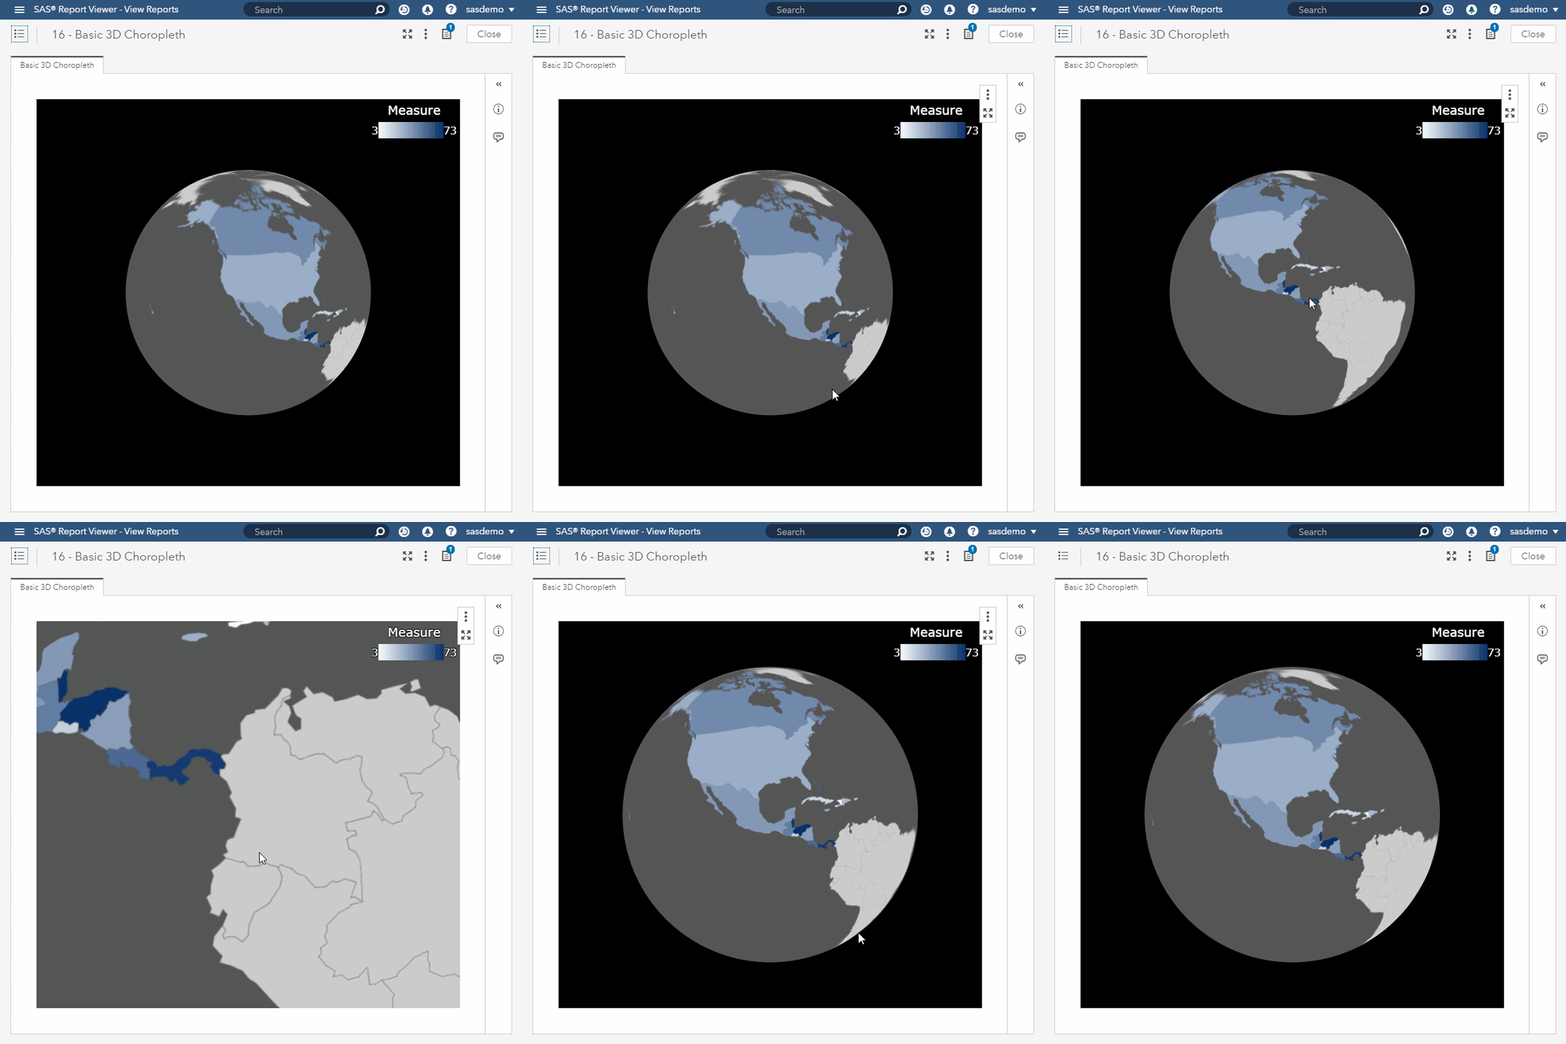
You can create graphs, charts, scatter plots, and several other types of visuals. It’s also possible to combine D3.js with other graphics libraries like Three.js to build even more amazing graphics. For example, here is an example of a 3D globe created with D3.js and Three.js:
D3.js allows you to select HTML elements with the select and selectAll methods as shown in our initial example. These methods can be used like so:
svg.selectAll("rect")

//or

svg.select("rect")
In the above snippet, d3.select allows you to select the first matching rect element. Meanwhile, d3.selectAll selects all matching rect elements.
D3.js allows you to leverage JavaScript and CSS to manipulate the DOM to achieve your desired visualization result. You can directly create, update, and delete elements based on data or your project requirements.
For example, you could use append to add new elements, remove to delete, and attr to set attributes, like so:
// Select the body element
var bodySelection = d3.select("body");

// Append a paragraph
bodySelection.append("p")
  .text("This is a new paragraph.");

// Wait for 2 seconds and then remove the paragraph
setTimeout(function() {
  bodySelection.select("p").remove();
}, 2000);

// Append a div with a class and style
bodySelection.append("div")
  .attr("class", "my-div")
  .style("width", "100px")
  .style("height", "100px")
  .style("background-color", "lightblue")
  .text("I'm a div with attributes!");

// Wait for 2 seconds and then change the text content
setTimeout(function() {
  bodySelection.select(".my-div").text("Text updated!");
}, 4000);
Data joining in D3.js is about connecting your data to the visual elements you’re creating.
In a previous example, we used selectAll() to select all the rect elements — even though they did not yet exist — and then loaded data to the rect. We then used enter and append to join the data to each rectangle. That’s exactly what data joining is.
In the below example, we’re joining data to selected rectangles directly:
svg.selectAll("rect")
    .data(data)
    .enter()
    .append("rect")
There are a lot of other methods like this that you can find in the D3.js documentation.
There are several use cases for D3.js, but let’s highlight three key use cases:
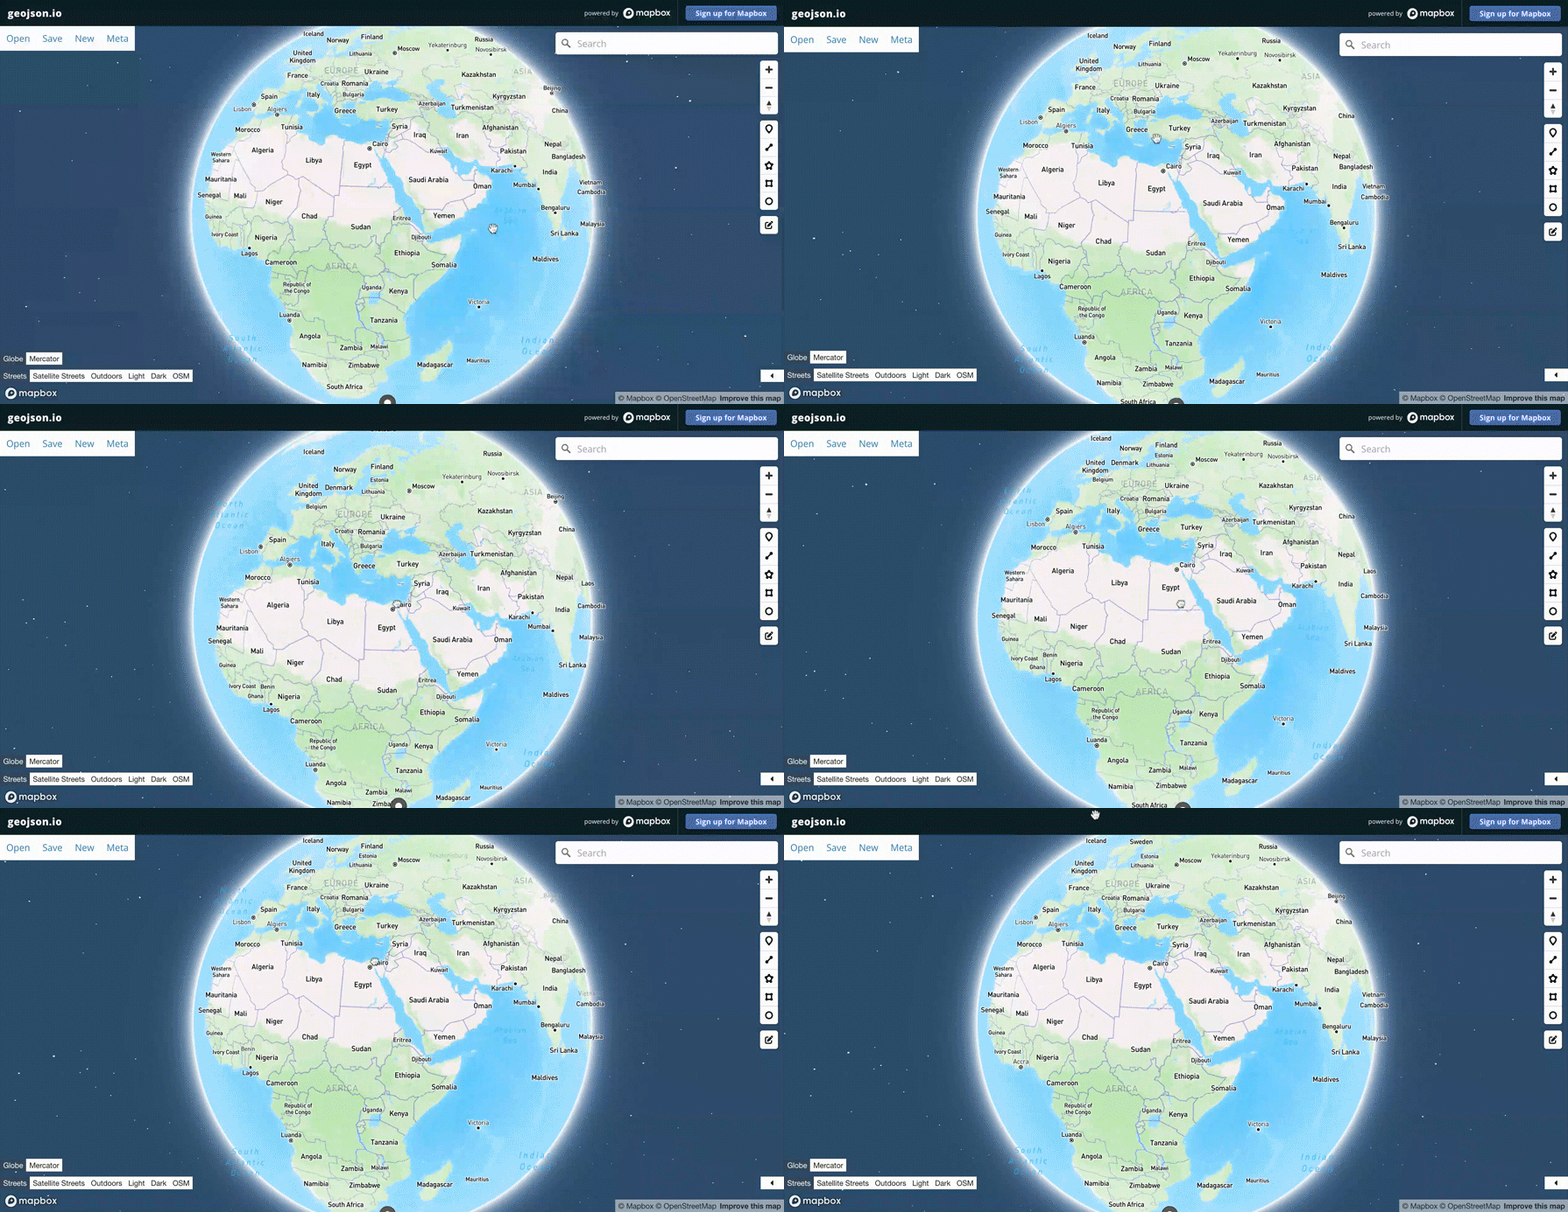
These are some of the most common use cases for D3.js, but since the library allows you to create completely custom data visualizations, the only limit is your imagination!
D3.js allows you to use native CSS to style your data visualizations. It provides a styling method that allows you to pass conventional CSS styles to your visualizations as shown below:
<!DOCTYPE html>
<html lang="en">
<head>
    <meta charset="UTF-8">
    <meta name="viewport" content="width=device-width, initial-scale=1.0">
</head>
<body>
    <div id="map"></div>
    <script type="module" src="https://cdn.jsdelivr.net/npm/d3@7"></script>
    <script type="module">
        const svg = d3.select("#map").append("svg").attr("width", 100).attr("height", 100);
        svg.selectAll("circle")
            .data([1, 2, 3])
            .enter().append("circle")
            .attr("cx", d => d * 20)
            .attr("cy", 50)
            .attr("r", 10)
            .style("fill", "blue")
            .style("stroke", "white")
            .style("stroke-width", 2);
    </script>
</body>
</html>
In the code above, we used the providing styling method to change the color of the SVG stroke to white, paint each circle’s background with a blue hue, and add a stroke-width of 2.
You can also choose to write your styles in the style tag or in a different CSS file. For example, here is the same code, but with the CSS file separated in the style tag:
<!DOCTYPE html>
<html lang="en">
<head>
  <meta charset="UTF-8">
  <meta name="viewport" content="width=device-width, initial-scale=1.0">
  <style>
    .svg-elements {
      fill: blue;
      stroke: white;
      stroke-width: 2;
    }
    #map {
      border: 1px solid #ccc;
      width: 100px; /* Adjust the width as needed */
      height: 100px; /* Adjust the height as needed */
    }
  </style>
</head>
<body>
  <div id="map"></div>
  <script type="module">
    import * as d3 from "https://cdn.jsdelivr.net/npm/d3@7/+esm";
    // Create an SVG element
    const svg = d3.select("#map").append("svg");
    // Add circles to the SVG
    svg.selectAll("circle")
      .data([1, 2, 3]) // example data, replace with your own
      .enter().append("circle")
      .attr("cx", d => d * 20)
      .attr("cy", 50)
      .attr("r", 10);
    // Apply the class to style the circles
    svg.selectAll("circle").classed("svg-elements", true);
  </script>
</body>
</html>
The output will look like so:
D3 project deployment is straightforward. Just run your normal library or framework bundler and it will be bundled together!
You don’t need to do anything special to make D3.js work, since D3.js code is just JavaScript, HTML, and CSS. So, you’ll deploy it together with your existing project without any additional requirements.
We’ve learned a lot about D3.js already, but there are a few additional considerations you should keep in mind while deciding whether or not to adopt this library into your project.
There are special methods that allow you to load your data into D3.js for different data sources. Let’s see some of the methods for popular data sources like CSV, JSON, arrays and objects, tabular HTML data, and GeoJSON.
CSV:
d3.csv("your_data.csv").then(function(data) {
    // Process csv data here
});
svg.selectAll("rect")
    .data(data)
    .enter()
...
JSON:
d3.json("your_data.json").then(function(data) {
    svg.selectAll("rect")
        .data(data)
        ...
});
Arrays/objects:
var data = [1, 2, 3, 4, 5];
// Or
var data = { key1: value1, key2: value2, ... };
svg.selectAll("rect")
    .data(data)
    ...
Tabular data in HTML:
var data = d3.selectAll("table tr").data();
GeoJSON:
d3.json("your_geojson_data.json").then(function(geoData) {
    svg.selectAll("rect")
    .data(geoData)
});
There are lots of libraries that allow you to create data visualizations, but none currently beats the flexibility and depth of D3.js. We’ve compared the top charting libraries— including D3 — in previous posts on the LogRocket blog, which you can peruse under “Further reading” below.
It’s important to acknowledge that D3.js has taken a huge market share in the data visualization space. A lot of other similar options actually use D3.js behind the scenes. Those that don’t use D3.js under the hood also don’t give you the type of flexibility that D3.js provides.
D3.js is an amazing JavaScript data visualization library designed for highly performant, tailored visualizations. It’s the type of visualization library you want to use when you want to visualize your data in very custom ways or to meet particular project requirements.
While D3.js is a great choice for many use cases, sometimes, you might just want to create simple charts and graphs. In such cases, you might want to use simpler data visualization options or tools that allow you to leverage D3.js without worrying about the low-level details.
Make sure you weigh all your project requirements to determine whether D3.js is appropriate for your needs. Feel free to comment below with questions or to share your D3.js projects. Happy visualizing!
Install LogRocket via npm or script tag. LogRocket.init() must be called client-side, not
server-side
$ npm i --save logrocket

// Code:

import LogRocket from 'logrocket';
LogRocket.init('app/id');
// Add to your HTML:

<script src="https://cdn.lr-ingest.com/LogRocket.min.js"></script>
<script>window.LogRocket && window.LogRocket.init('app/id');</script>

@container scroll-state: Replace JS scroll listeners nowCSS @container scroll-state lets you build sticky headers, snapping carousels, and scroll indicators without JavaScript. Here’s how to replace scroll listeners with clean, declarative state queries.

Explore 10 Web APIs that replace common JavaScript libraries and reduce npm dependencies, bundle size, and performance overhead.

Russ Miles, a software development expert and educator, joins the show to unpack why “developer productivity” platforms so often disappoint.

Discover what’s new in The Replay, LogRocket’s newsletter for dev and engineering leaders, in the February 18th issue.
Would you be interested in joining LogRocket's developer community?
Join LogRocket’s Content Advisory Board. You’ll help inform the type of content we create and get access to exclusive meetups, social accreditation, and swag.
Sign up now