Editor’s note: This Angular and D3.js tutorial was last updated on 22 November 2022 to fix errors in the code and include a section on how to load multiple components on a page. For more articles on data visualization with D3, check out these articles: “Creating visualizations with D3 and TypeScript” and “Data visualization with Vue.js and D3.”

As more organizations focus on collecting and analyzing data, one of the challenges that product teams face is presenting that data in a useful way. While many software developers default to list and table views, these presentation formats have a tendency to overwhelm users.
Data visualization helps you better communicate meaning in your data by portraying it in a graphical format. This often means bar charts, scatter plots, or pie charts. Because most data visualizations on the web are generated on the frontend, JavaScript is the language of choice for data visualization libraries.
Of the available libraries, D3.js is one of the most popular. It allows you to create data visualizations by manipulating the DOM based on dynamic data. D3 is reactive, meaning that instead of generating a static image on the server and serving it to the client, it uses JavaScript to “draw” HTML elements onto your webpage. This makes D3 powerful, but also a little harder to use than some other charting libraries.
Angular is maintained by Google and is one of the most popular open source frontend web frameworks. In this tutorial, you’ll see how you can add data visualizations to your Angular app using D3. You’ll set up up Angular and D3, adding three common types of charts, refactoring the chart component to make it more reusable, and importing data from a third-party API or local CSV file. By the end, you should have a starting point for creating your own data visualizations using D3 and Angular.
To jump ahead:
Angular uses a command-line interface to help you generate new applications and components. Angular CLI provides a rich feature set to make the developer’s life easier. You just need to have Node.js and npm installed to proceed. If you’re new to using Angular, you can read the local setup guide to learn more about the process, or if you’d like to skip the walkthrough and download the final application, you can get the code from GitHub. If you’d like to go through the entire process, read on!
First, install the Angular CLI. The command-line tool offers a quick way to start new Angular projects:
npm install -g @angular/cli
Next, create a new Angular app. You can call it whatever you want, but I’ll use the name angular-d3:
ng new angular-d3
Finally, navigate into the new project:
cd angular-d3/
Next, install D3 and the D3 type definitions from npm. Type definitions will allow TypeScript to apply type hints to the external D3 code:
npm install d3 && npm install @types/d3 --save-dev
Next, create three new components using the Angular CLI. In the following steps, you’ll use D3 to generate data visualizations within each one.
First, the bar component:
ng g component bar
Next, the pie component:
ng g component pie
And the scatter component:
ng g component scatter
These components are now available in the src/app/ directory and Angular added them to your app.module.ts file, but you still need to insert the components using their selectors. Open up your src/app/app.component.html file and replace its contents with the following:
<header>
  <h1>Angular + D3</h1>
</header>
<app-bar></app-bar>
<app-pie></app-pie>
<app-scatter></app-scatter>
Finally, you can make the site look a little prettier by adding new.css to your <head>. Open up the src/index.html file and add the following lines between the <head></head> tags:
<link rel="stylesheet" href="https://fonts.xz.style/serve/inter.css">
<link rel="stylesheet" href="https://cdn.jsdelivr.net/npm/@exampledev/[email protected]/new.min.css">
You’re ready to test it out. From your terminal, run ng serve --open. Your browser should open up http://localhost:4200, and you’ll see something like this:
Now that your Angular app is ready, let’s add three charts it: a bar chart, pie chart, and scatter plot.
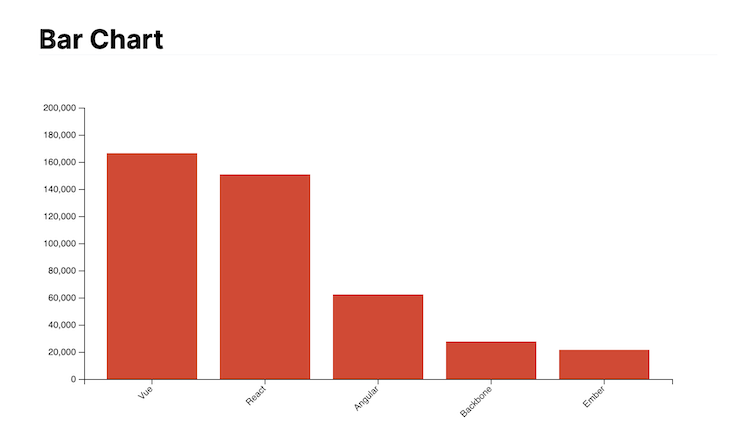
The first data visualization you’ll add is a bar chart. Bar charts are typically used to show relative values of different categories of data. The data we’ll use is the number of stars each popular frontend web development framework has:
[
    {"Framework": "Vue", "Stars": "166443", "Released": "2014"},
    {"Framework": "React", "Stars": "150793", "Released": "2013"},
    {"Framework": "Angular", "Stars": "62342", "Released": "2016"},
    {"Framework": "Backbone", "Stars": "27647", "Released": "2010"},
    {"Framework": "Ember", "Stars": "21471", "Released": "2011"}
]
Angular components usually consist of four files: an HTML template file, a CSS or SCSS stylesheet, a spec (test) file, and a TypeScript component file. Open up the template file (bar.component.html) and add the following header and figure:
<h2>Bar Chart</h2>
<figure id="bar"></figure>
You’ll use D3 to add the chart inside the figure using a CSS selector. Next, open up the TypeScript component file (bar.component.ts) and add the following properties:
import { Component, OnInit } from '@angular/core';
import * as d3 from 'd3';

export class BarComponent implements OnInit {
  private data = [
    {"Framework": "Vue", "Stars": "166443", "Released": "2014"},
    {"Framework": "React", "Stars": "150793", "Released": "2013"},
    {"Framework": "Angular", "Stars": "62342", "Released": "2016"},
    {"Framework": "Backbone", "Stars": "27647", "Released": "2010"},
    {"Framework": "Ember", "Stars": "21471", "Released": "2011"},
  ];
  private svg: any;
  private margin = 50;
  private width = 750 - (this.margin * 2);
  private height = 400 - (this.margin * 2);
...
First, we import the d3 package into this component, so it can be referenced later. The first private property, data, hardcodes the data needed to generate the chart. You’ll see later how to use data from a file or API, but this will let you get started.
The svg property will be used in the class to store the SVG image that D3 draws onto the DOM. The other properties set a height, width, and margin for the chart. While it’s possible to create responsive charts with D3, I won’t explore them in this tutorial.
Next, create a method in the BarComponent called createSvg(). This selects the element in the DOM and inserts a new SVG with a [<g>](http://tutorials.jenkov.com/svg/g-element.html) element:
private createSvg(): void {
    this.svg = d3.select("figure#bar")
    .append("svg")
    .attr("width", this.width + (this.margin * 2))
    .attr("height", this.height + (this.margin * 2))
    .append("g")
    .attr("transform", "translate(" + this.margin + "," + this.margin + ")");
}
Now create a method called drawBars() that will add the bars using the svg property:
private drawBars(data: any[]): void {
  // Create the X-axis band scale
  const x = d3.scaleBand()
  .range([0, this.width])
  .domain(data.map(d => d.Framework))
  .padding(0.2);

  // Draw the X-axis on the DOM
  this.svg.append("g")
  .attr("transform", "translate(0," + this.height + ")")
  .call(d3.axisBottom(x))
  .selectAll("text")
  .attr("transform", "translate(-10,0)rotate(-45)")
  .style("text-anchor", "end");

  // Create the Y-axis band scale
  const y = d3.scaleLinear()
  .domain([0, 200000])
  .range([this.height, 0]);

  // Draw the Y-axis on the DOM
  this.svg.append("g")
  .call(d3.axisLeft(y));

  // Create and fill the bars
  this.svg.selectAll("bars")
  .data(data)
  .enter()
  .append("rect")
  .attr("x", (d: any) => x(d.Framework))
  .attr("y", (d: any) => y(d.Stars))
  .attr("width", x.bandwidth())
  .attr("height", (d: any) => this.height - y(d.Stars))
  .attr("fill", "#d04a35");
}
Finally, call both of these methods in your BarComponent‘s ngOnInit() method:
ngOnInit(): void {
    this.createSvg();
    this.drawBars(this.data);
}
If you stopped the Angular server from the previous step, restart it (ng serve) and visit localhost:4200 in your browser. You should see your new bar chart:
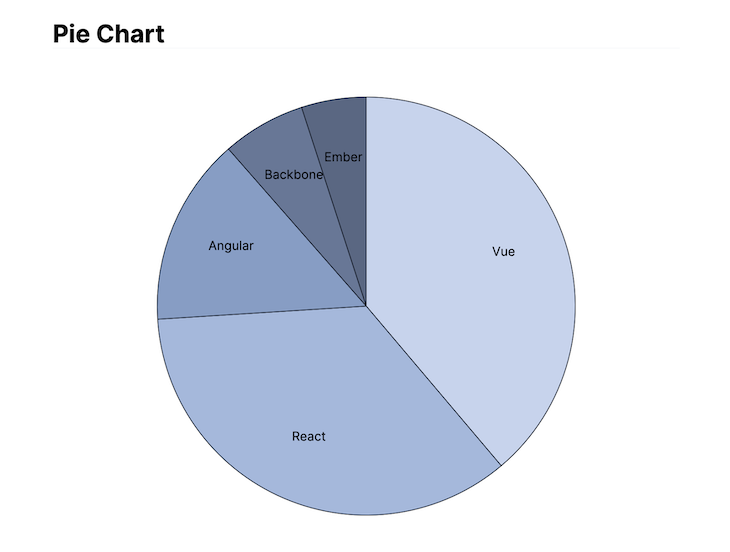
A pie chart is a good way to show the relative values of different data. In this case, you’ll use it to visualize the market share of different frontend frameworks based on GitHub stars.
The first step is to update the component’s HTML file (pie.component.html) with a new figure and title:
<h2>Pie Chart</h2>
<figure id="pie"></figure>
Because this chart uses the same set of data as the bar chart, the component’s class starts off looking similar. Update the pie.component.ts file with your data and the following private properties:
import { Component, OnInit } from '@angular/core';
import * as d3 from 'd3';
export class PieComponent implements OnInit {
  private data = [
    {"Framework": "Vue", "Stars": "166443", "Released": "2014"},
    {"Framework": "React", "Stars": "150793", "Released": "2013"},
    {"Framework": "Angular", "Stars": "62342", "Released": "2016"},
    {"Framework": "Backbone", "Stars": "27647", "Released": "2010"},
    {"Framework": "Ember", "Stars": "21471", "Released": "2011"},
  ];
  private svg: any;
  private margin = 50;
  private width = 750;
  private height = 600;
  // The radius of the pie chart is half the smallest side
  private radius = Math.min(this.width, this.height) / 2 - this.margin;
  private colors;
...
The big difference here is the addition of the radius and colors properties. Because pie charts use a circle instead of a rectangle to display data, that radius property ensures that the chart fits within the defined figure’s bounds. You’ll use colors property to define the colors for the pie chart in the coming step.
Next, create a private method called createSvg. This will select the figure element on the DOM and add the <g> element where D3 will draw your pie chart:
private createSvg(): void {
    this.svg = d3.select("figure#pie")
    .append("svg")
    .attr("width", this.width)
    .attr("height", this.height)
    .append("g")
    .attr(
      "transform",
      "translate(" + this.width / 2 + "," + this.height / 2 + ")"
    );
}
In this pie chart, you’ll use an ordinal scale to create a discrete color for each section of the chart. You could define each to be the dominant color of the framework, but I think a monochromatic scheme looks nicer:
private createColors(): void {
    this.colors = d3.scaleOrdinal()
    .domain(this.data.map(d => d.Stars.toString()))
    .range(["#c7d3ec", "#a5b8db", "#879cc4", "#677795", "#5a6782"]);
}
Create a method to draw the chart and add labels. This method uses <path> elements to create arcs for each framework and fill them with the colors defined in the createColors method above:
private drawChart(): void {
  // Compute the position of each group on the pie:
  const pie = d3.pie<any>().value((d: any) => Number(d.Stars));

  // Build the pie chart
  this.svg
  .selectAll('pieces')
  .data(pie(this.data))
  .enter()
  .append('path')
  .attr('d', d3.arc()
    .innerRadius(0)
    .outerRadius(this.radius)
  )
  .attr('fill', (d: any, i: any) => (this.colors(i)))
  .attr("stroke", "#121926")
  .style("stroke-width", "1px");

  // Add labels
  const labelLocation = d3.arc()
  .innerRadius(100)
  .outerRadius(this.radius);

  this.svg
  .selectAll('pieces')
  .data(pie(this.data))
  .enter()
  .append('text')
  .text((d: any)=> d.data.Framework)
  .attr("transform", (d: any) => "translate(" + labelLocation.centroid(d) + ")")
  .style("text-anchor", "middle")
  .style("font-size", 15);
}
D3’s centroid function allows you to put labels in the calculated centroid of each slice of the pie. In this case, by setting the innerRadius(100), the labels will be slightly outside the true centroid. You can adjust these numbers to reposition them wherever you think they look best.
Finally, call all three of these methods in the ngOnInit() method:
ngOnInit(): void {
    this.createSvg();
    this.createColors();
    this.drawChart();
}
Head back over to your browser to see the new pie chart in your Angular application:
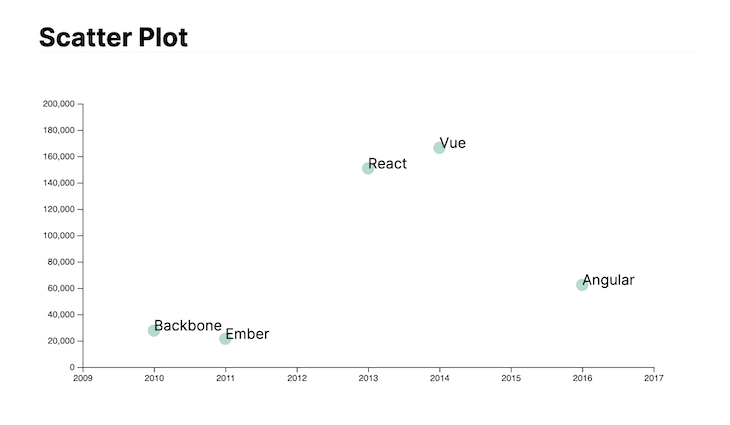
The last type of data visualization you’ll create for this tutorial is a scatter plot. Scatter plots give us the ability to show the relationship between two pieces of data for each point in the graph. In this case, you’ll look at the relationship between the year that each framework was released and the number of stars it currently has.
Start off by updating the HTML template file (scatter.component.html) in the same way as you did above:
<h2>Scatter Plot</h2>
<figure id="scatter"></figure>
Because this scatter plot uses the same data and figure size, it starts off with the same properties as the bar chart did:
import { Component, OnInit } from '@angular/core';
import * as d3 from 'd3';
export class ScatterComponent implements OnInit {
  private data = [
    {"Framework": "Vue", "Stars": "166443", "Released": "2014"},
    {"Framework": "React", "Stars": "150793", "Released": "2013"},
    {"Framework": "Angular", "Stars": "62342", "Released": "2016"},
    {"Framework": "Backbone", "Stars": "27647", "Released": "2010"},
    {"Framework": "Ember", "Stars": "21471", "Released": "2011"},
  ];
  private svg;
  private margin = 50;
  private width = 750 - (this.margin * 2);
  private height = 400 - (this.margin * 2);
...
In fact, the createSvg method is the same as the bar chart, too:
private createSvg(): void {
    this.svg = d3.select("figure#scatter")
    .append("svg")
    .attr("width", this.width + (this.margin * 2))
    .attr("height", this.height + (this.margin * 2))
    .append("g")
    .attr("transform", "translate(" + this.margin + "," + this.margin + ")");
}
If your application has many bar and scatter plots that use similar properties, you might want to try using inheritance to cut down on the amount of duplicate code.
Next, create a new drawPlot() method to create the x- and y-axes of your plot and add the dots to the canvas. This method makes the points semi-transparent and adds the name of each framework as a label:
private drawPlot(): void {
    // Add X axis
    const x = d3.scaleLinear()
    .domain([2009, 2017])
    .range([ 0, this.width ]);
    this.svg.append("g")
    .attr("transform", "translate(0," + this.height + ")")
    .call(d3.axisBottom(x).tickFormat(d3.format("d")));

    // Add Y axis
    const y = d3.scaleLinear()
    .domain([0, 200000])
    .range([ this.height, 0]);
    this.svg.append("g")
    .call(d3.axisLeft(y));

    // Add dots
    const dots = this.svg.append('g');
    dots.selectAll("dot")
    .data(this.data)
    .enter()
    .append("circle")
    .attr("cx", (d: any) => x(d.Released))
    .attr("cy",  (d: any) => y(d.Stars))
    .attr("r", 7)
    .style("opacity", .5)
    .style("fill", "#69b3a2");

    // Add labels
    dots.selectAll("text")
    .data(this.data)
    .enter()
    .append("text")
    .text( (d: any) => d.Framework)
    .attr("x", (d: any) => x(d.Released))
    .attr("y", (d: any)  => y(d.Stars))
}
Another important difference in the scatter plot is that your x-axis uses dates instead of strings (like you did in the bar chart), so you have to call .tickFormat(d3.format("d")) to format them properly.
Finally, call both methods from your ngOnInit() method:
ngOnInit(): void {
    this.createSvg();
    this.drawPlot();
}
Head back over to your browser to see the final plot rendered in your Angular application:
In the previous example, the Bar/Pie/Scatter component holds the source data and draws the charts based on the data. If we want to display multiple components with different data sources on the same page, then we have to duplicate those components. In Angular, the best practice is to build those components as a dumb component, so it only focuses on presenting the charts based on injected data.
Let’s refactor the BarChart component to make it more reusable.
Firstly, let’s create a new version of the BarComponent:
ng g component bar2
The above command will create the skeleton files for the new Bar2Component in the src/app/ directory. Before we build the component, we need to create the following interfaces for the chart data:
export interface LineData {
    label: string;
    value: number;
}
export interface ChartData {
    yrange: number,
    lineData: LineData[]
}
The ChartData interface defines the shape of the data to be consumed by the Bar2Component. Open the file App.component.ts, and add the chartData_2D_1 variable, so we can separate the data from the Bar2Component:
  chartData_2D_1: ChartData = {
    yrange: 200000,
    lineData: [
      { label: 'Vue', value: 166443 },
      { label: 'React', value: 150793 },
      { label: 'Angular', value: 62342 },
      { label: 'Backbone', value: 27647 },
      { label: 'Ember', value: 21471 },
    ],
  };
Now, we can add the following Input properties and other private properties into the Bar2Component:
import * as d3 from 'd3';
import { ChartData, LineData } from '../chartData';
...
export class Bar2Component implements AfterViewInit {
  @Input()
  chartName:string = 'bar';
  @Input()
  data: ChartData = {} as ChartData;

  private svg: any;
  private margin = 50;
  private width = 750 - this.margin * 2;
  private height = 400 - this.margin * 2;
Two Input properties are introduced:
chartName: define a unique name of the component. It is bound to the Id of the figure element, and d3 can use it to get a reference to the HTML elementdata: the source data of the component.Similar to the previous BarComponent, we create a createSvg method below. But we use a dynamic selector in the select method:
private createSvg(): void {
    this.svg = d3
      .select(`figure#${this.chartName}`)
      .append('svg')
      .attr('width', this.width + this.margin * 2)
      .attr('height', this.height + this.margin * 2)
      .append('g')
      .attr('transform', 'translate(' + this.margin + ',' + this.margin + ')');
  }
Then we can create the drawBars method. Again, it is similar to the drawBars method in the BarComponent. Compared to the previous method, we use label and value properties to replace the Framework and Stars properties. The newly created ChartData and LineData interfaces are also applied within the method, so we can get editor intelligence support and strong typing:
private drawBars(data: ChartData): void {
    // Create the X-axis band scale
    const x = d3
      .scaleBand()
      .range([0, this.width])
      .domain(data.lineData.map((d: LineData) => d.label))
      .padding(0.2);

    // Draw the X-axis on the DOM
    this.svg
      .append('g')
      .attr('transform', 'translate(0,' + this.height + ')')
      .call(d3.axisBottom(x))
      .selectAll('text')
      .attr('transform', 'translate(-10,0)rotate(-45)')
      .style('text-anchor', 'end');

    // Create the Y-axis band scale
    const y = d3.scaleLinear().domain([0, data.yrange]).range([this.height, 0]);

    // Draw the Y-axis on the DOM
    this.svg.append('g').call(d3.axisLeft(y));

    // Create and fill the bars
    this.svg
      .selectAll('bars')
      .data(data.lineData)
      .enter()
      .append('rect')
      .attr('x', (d: LineData) => x(d.label))
      .attr('y', (d: LineData) => y(d.value))
      .attr('width', x.bandwidth())
      .attr('height', (d: any) => this.height - y(d.value))
      .attr('fill', '#d04a35');
  }
Now, we can create the ngAfterViewInit method and call the above methods:
  ngAfterViewInit(): void {
    this.createSvg();
    this.drawBars(this.data);
  }
Please note that we use the AfterViewInit lifecycle hook instead of OnInit, because we want to make sure that the method is invoked after the view is rendered.
Finally, let me complete the Bar2Component by adding the following into the HTML template file (bar2.component.html):
<h2>Bar Chart</h2>
<figure id="{{chartName}}"></figure>
The Bar2Component is ready!
If you add the following to the App.Component.html and start the Angular dev server (ng serve or npm run start), the bar chart will be shown:
<app-bar2 chartName="barA" [data]="chartData_2D_1"></app-bar2>
With the new component, you can add multiple instances to the same page, and assign different names and source data. In the sample code provided in GitHub, I added two instances of the Bar2Component for your reference. In the sample project, you can also find a new version of pie chart component and scatter chart component.
So far, you’ve hardcoded data into your Angular components, but that’s probably not realistic. There are several ways you can load data from external sources, so let’s look at two of the most common patterns you might use in D3.
Most spreadsheets can be exported as CSV files. CSV is a text-based data storage format that uses commas and line breaks to separate values in the file. Because CSV is such a common data format, D3 provides native support for loading CSV files that are publicly available.
To demonstrate using a CSV file, create a new file in your Angular application’s src/assets/ directory called frameworks.csv. Add the following text to the file:
Framework,Stars,Released
Vue,166443,2014
React,150793,2013
Angular,62342,2016
Backbone,27647,2010
Ember,21471,2011
Next, open up the bar chart component (bar.component.ts) and update the ngOnInit() method to call D3’s csv() method:
ngOnInit(): void {
    this.createSvg();
    // Parse data from a CSV
    d3.csv("/assets/frameworks.csv").then(data => this.drawBars(data));
}
D3 can load CSVs from your Angular application or a third-party URL and makes the data available as an array of objects in the resulting promise. If you go back to the browser, you should see the same bar chart as before, but this time it’s using data from the frameworks.csv file instead of the Angular component.
Another common data format used in web APIs is JSON. JSON is a string representation of JavaScript objects and is commonly returned by REST and GraphQL APIs. D3 natively supports JSON data, so it makes it really easy to integrate with your Angular application.
First, you’ll need a JSON API endpoint or file. I uploaded the framework data used throughout this tutorial to JSONbin, a free JSON file hosting platform. You can access this data here.
To use this endpoint, open up the bar.component.ts file again and update the ngOnInit() method with the following:
ngOnInit(): void {
    this.createSvg();
    // Fetch JSON from an external endpoint
    type ChartDataType ={
      Framework: string,
      Stars: number,
      Released: number
    }
     d3.json('https://api.jsonbin.io/b/5eee6a5397cb753b4d149343').then(data=> {
      const chartData = data as ChartDataType[];
      this.drawBars(chartData);
  });
}
As in the CSV example, D3’s json method returns a promise with your data parsed as an array of objects. By passing this in, your bar chart can now use the JSON API endpoint as its data source.
Please note that we create a ChartDataType type to do a type assertion, as the data from API is defaulted to unknown type and will throw an error without the type assertion.
When you need to create rich data visualizations in your Angular app, D3 is a great choice. While it may take some time to master, D3 is very powerful and can be used to create almost any data visualization you can imagine. It also makes accessing datasets from CSVs or JSON APIs really easy. You can find the GitHub repository for this project here.
If you’d like to learn more ways to customize your bar charts, I’d recommend looking at the official documentation or the D3 Graph Gallery for more examples.
Debugging Angular applications can be difficult, especially when users experience issues that are difficult to reproduce. If you’re interested in monitoring and tracking Angular state and actions for all of your users in production, try LogRocket.
LogRocket lets you replay user sessions, eliminating guesswork by showing exactly what users experienced. It captures console logs, errors, network requests, and pixel-perfect DOM recordings—compatible with all frameworks.
With Galileo AI, you can instantly identify and explain user struggles with automated monitoring of your entire product experience.
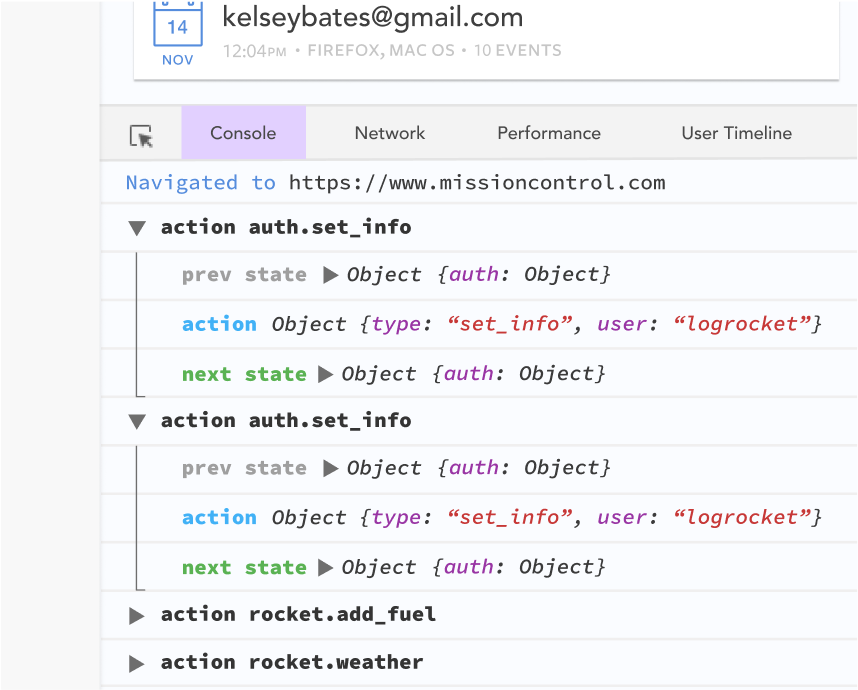
The LogRocket NgRx plugin logs Angular state and actions to the LogRocket console, giving you context around what led to an error, and what state the application was in when an issue occurred.
Modernize how you debug your Angular apps — start monitoring for free.

Debug RSC hydration mismatches in production with Next.js instrumentation, Suspense isolation, HTML diffing, and CI smoke tests.

Explore why npm dependencies are a major supply chain security risk and how to protect JavaScript apps from compromised packages and transitive threats.

Enabled React Compiler v1.0 on a production Next.js app. Here’s every warning, breakage, and silent opt-out I documented — and what actually worked.

We built the same app in TanStack Start RSC and Next.js RSC. TanStack shipped 40% less JS and built 4x faster — but Next.js is still the safer production bet.
Would you be interested in joining LogRocket's developer community?
Join LogRocket’s Content Advisory Board. You’ll help inform the type of content we create and get access to exclusive meetups, social accreditation, and swag.
Sign up now