
Chrome developer tools is a browser-based console that comes prepacked with Google Chrome. Not only does it come with a lot of tools and resources to enable developers to build and debug web applications, but it can also be leveraged to speed up your web development process.
In this tutorial, we will discuss how to improve your website’s load performance, effective debugging, and general tips and tricks when using Chrome developer tools.
Improving load performance
When trying to improve performance, the first thing you should do is to Audit your site. In this example, we’ll be Auditing wikipedia.org.
To Audit your website with Chrome Dev tools: first Right Click and inspect to open the tools panel or press ctrl + shift + I on Linux/Windows or cmd + opt + j on a mac. After that click on the arrow on the upper pane and click on Audit.
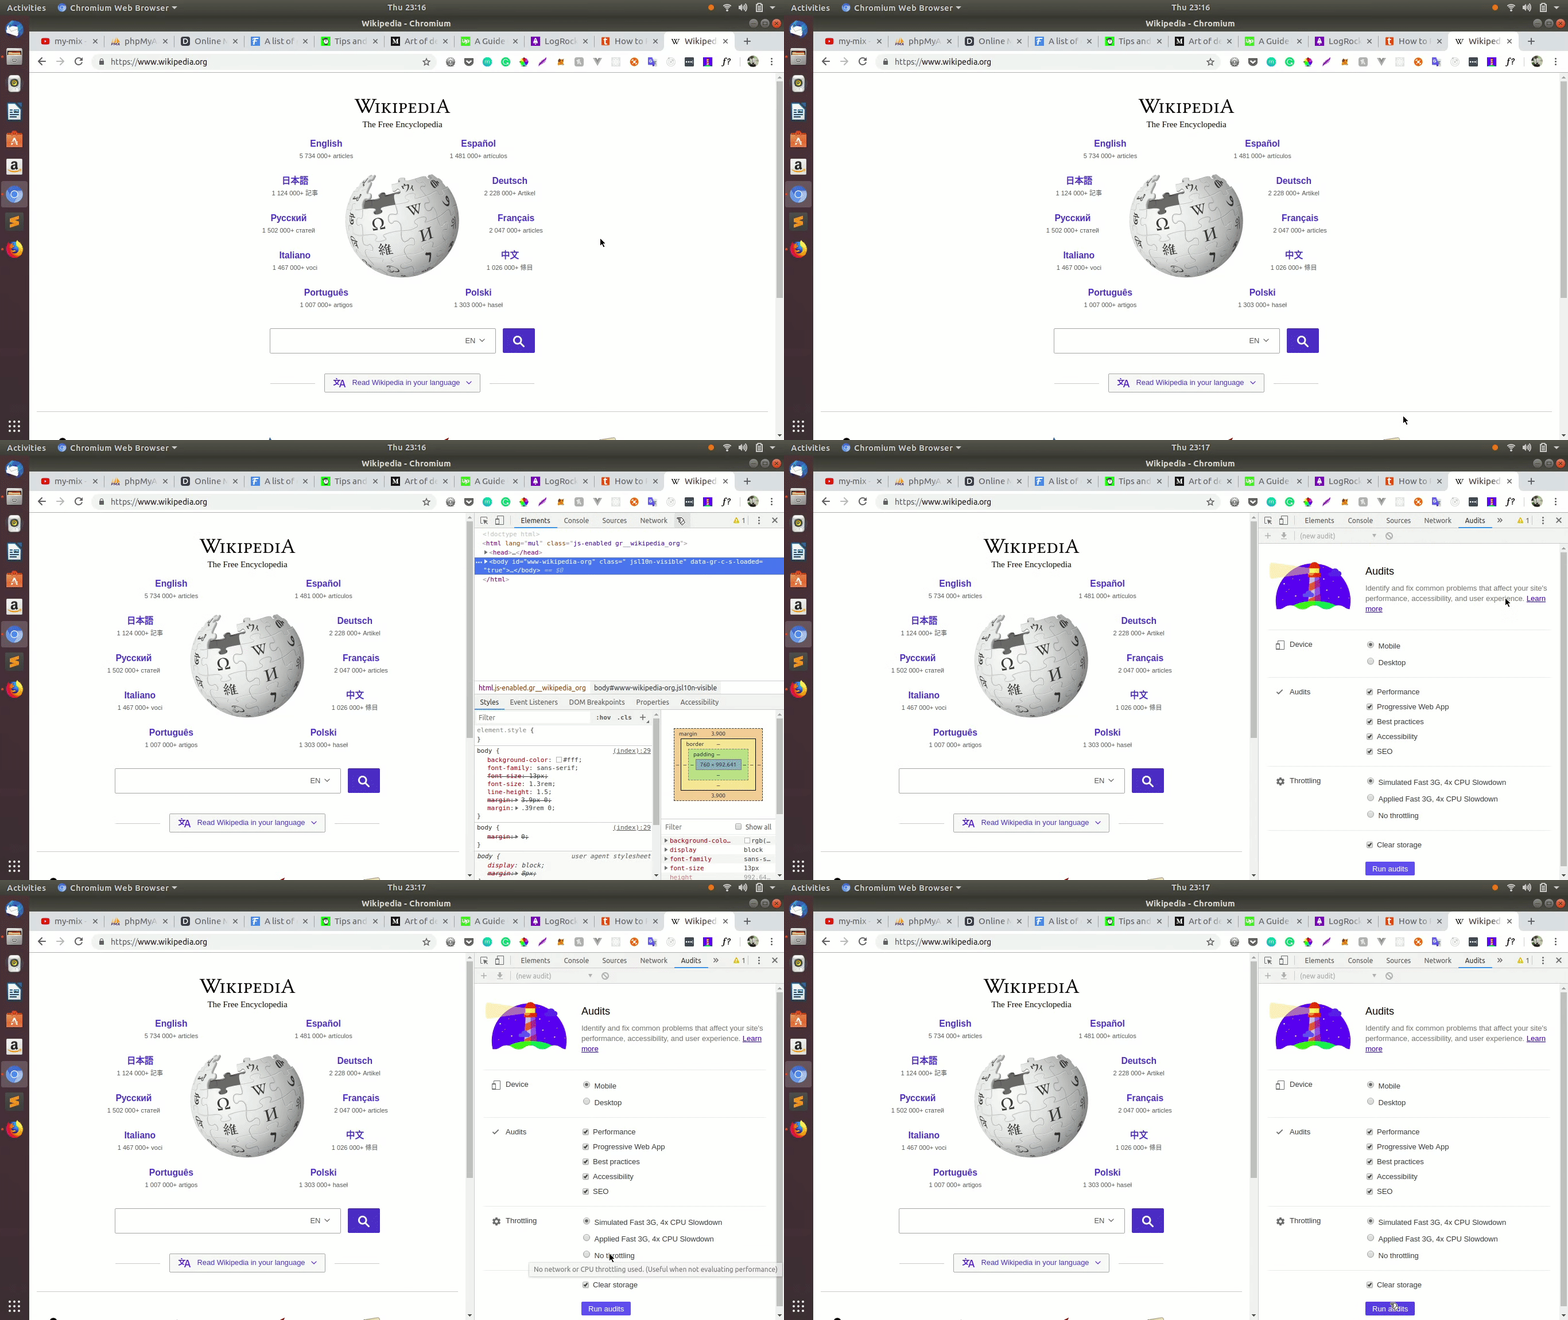
When the Audit Panel opens, you’ll need to choose your preferred options for the analysis:
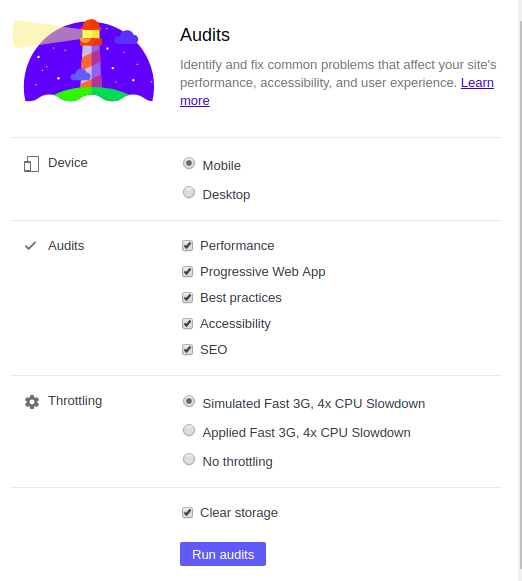
Device: Signifies what device you want to analyze.
Audits: Here, you choose the specific audits you care about. Performance? Best practices? I recommend you leave nothing out.
Throttling: This simulates the network speed of a majority of website users. (According to Akamai the average global connection speed is 7.2 ). This option is very important considering the location of your users.
The last option Clear Storage removes all stored data and simulates the first-time visit to your website. I recommend checking this the first time you want to audit your website.
Now click on Run Audits and wait a few seconds for it to generate a report containing the state of your website. Here’s a report for our test website:
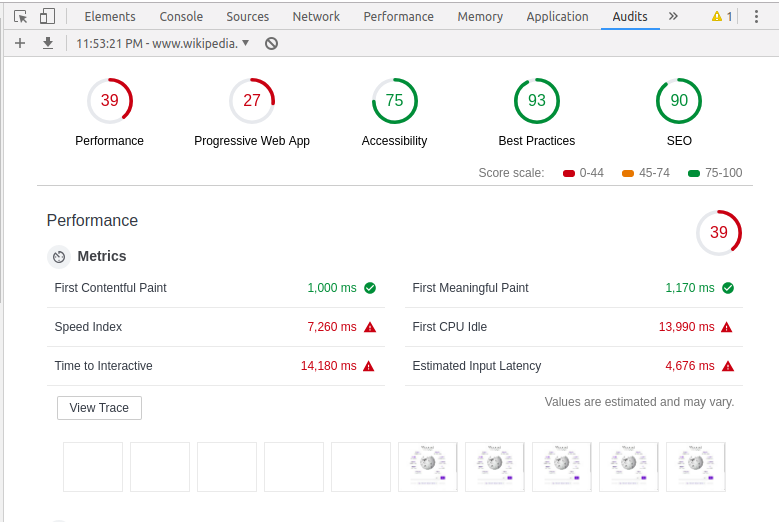
Based on the Audits you choose, a report will be generated for your website. Each Audit would have at least two sections (metrics and passed audits). Let’s discuss the Performance Audit and how we might increase it.
The first obvious information you see is the performance score. It’s 39. Since it’s measured over 100 your goal should be to take it up to at least 75%. Thankfully, dev tools have given us insights on how we can improve our website. Hover over a metric to know about it or click learn more to read about it.
First Contentful Paint: Denotes the time it takes for a user to see your first content. In our audit, the value s 1.000ms is a positive score for a high traffic website like Wikipedia. Time to interactive: This is the amount of time before a user can perform an action on your website. E.g time taken before a user can see any useful content, time taken before event listeners are loaded. Here, it takes about 14.180ms, which is not so good.
If you hover over the metrics, you will find more information about how to solve them.

The diagnostics section shows you the specific problems it has found. The green check mark shows you have a good implementation while the red stop sign signifies a problem that needs fixing.
In our case we have two red signs: Has a significant main thread network AND JavaScript boot-up time is too high”, let’s look into them:
- Has a significant main thread network: This is where the browser performs most of its activities, like parsing HTML/CSS and other functions. Our score from the audit is 14,520ms which means there’s room for improvement. To learn more about improving this, you can read this post on Chrome DevTools blog
- Javascript boot-up time is too high: This measures the total impact of JavaScript on your pages load performance. JavaScript can slow down your page by:
- Delaying the first meaningful paint
- Slowing down the time to interactive
Some recommendations:
- Remove unused code
- Cache code in the user’s browser
- Minify your code
You can learn more about improving your JavaScript boot time by reading this post on Chrome DevTools blog.
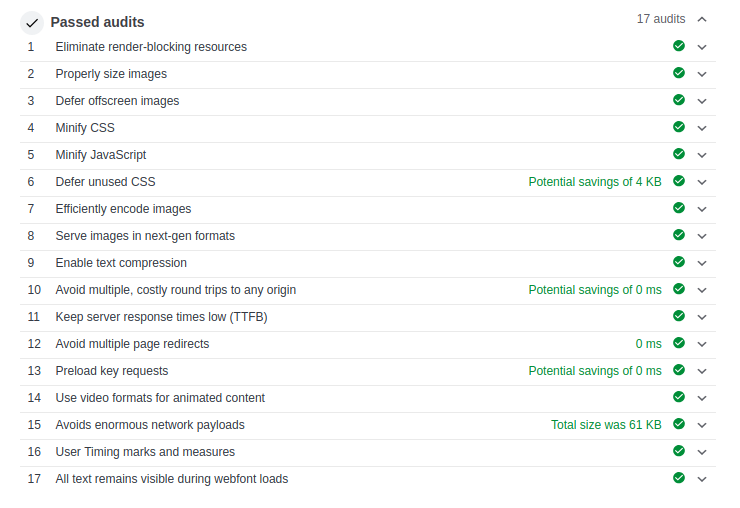
This section shows all the audits your website has passed. You can tell everything is good here by looking at the green check marks.
Debugging
Since Chrome is basically a JavaScript engine, it is most effective in debugging JavaScript applications but can also be used in debugging HTML/CSS. Let’s simulate a JavaScript error for us to test. Create a file called index.html and add the following lines of code to it:
<!DOCTYPE html>
<html>
  <head>
    <script>
    function printResult() {
      document.write(addNumber(7, 8));
    }
    function addNumber(num1, num2) {
      var result = num1 + num2;
      return result;
    }
    </script>
  </head>
  <body>
    <button type="button" onclick="printResult()">Try it</button>       </body>
</html>
This function takes two numbers adds it and print’s the result on screen. However, let’s put an intentional error so we can experiment on how to use Chrome DevTools for debugging. Just alter one function like this:
function addNumber(num1, num2) {
  var result = numss1 + num2;
  return result;
}
Now when we try to click it we don’t get a response, let’s see how Dev tools can help us track down the error. Open the panel either by right-clicking or pressing ctrl + shift + I on Linux/Windows or cmd + opt + j if you’re on a Mac.
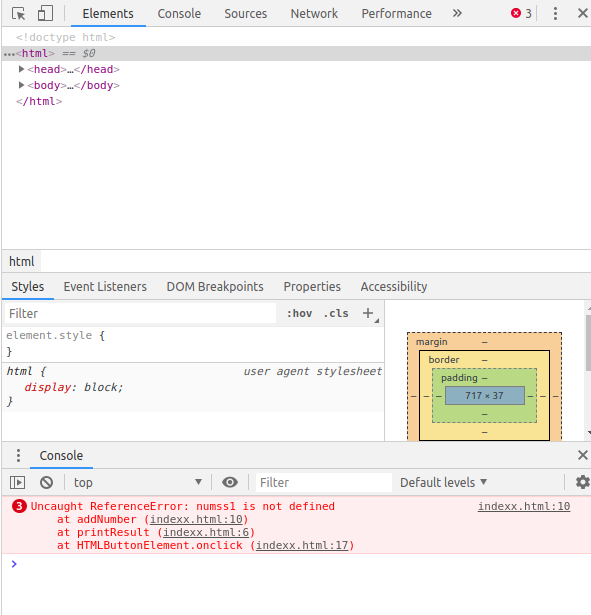
If you look at the console, you will see the error message written. The first line tells you the file which the error occurs, the second line shows you the function and the line of the error, the third line shows the action that triggered the error.
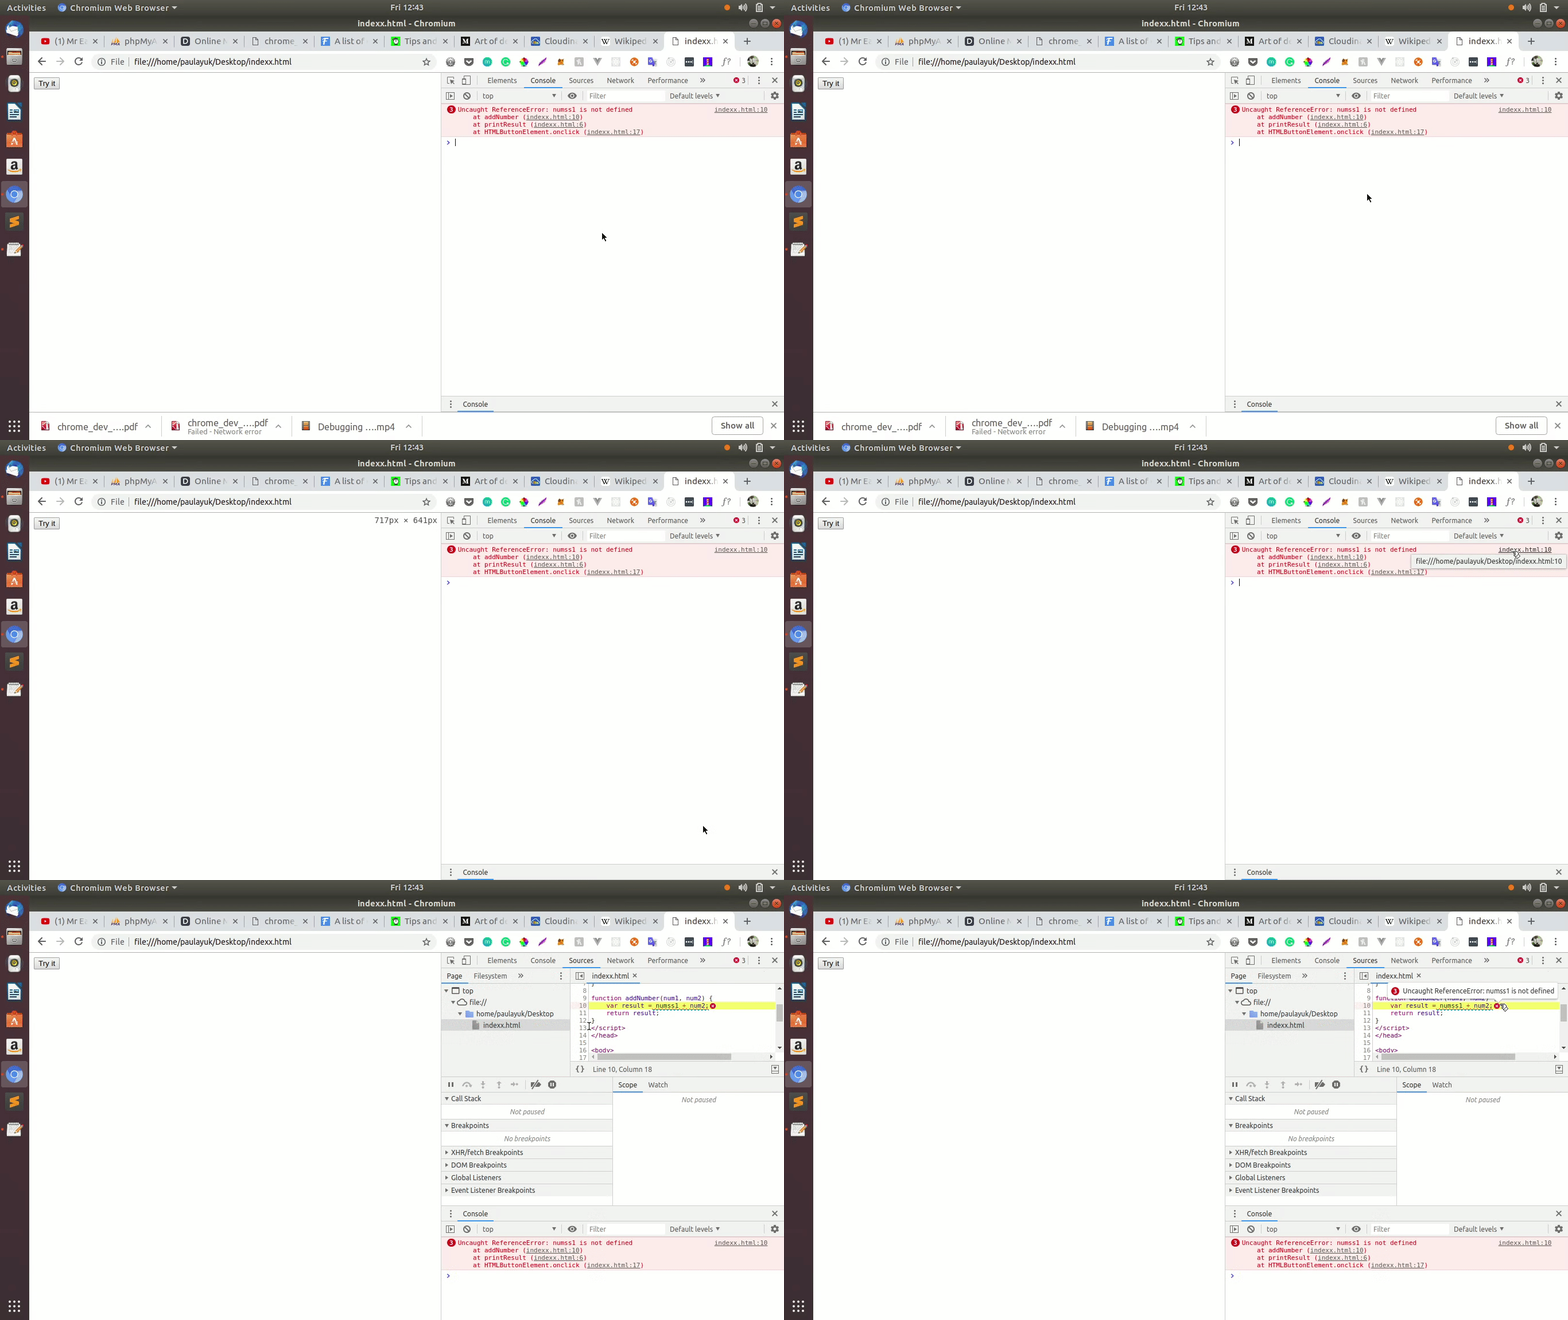
when you click the error file in the console, it opens the file under the sources tab in the console. If you hover over the error, you will be prompted with the exact error message. Now if you fix the error by changing this line var result = num1 + num2 you see that the error will disappear. There are a lot more ways to debug code with Dev tools, like setting breakpoints, listeners, etc.
To read more about using Chrome Dev Tools for debugging, look Here.
Tips and tricks
There’s a variety of things that can be checked with Dev tools. Let’s look at a few.
Testing
You can simulate a JavaScript testing environment by using the assert function. In your Dev tools console type the following code:
console.assert(1 === 2, "this is bad!!")You should see the following screen:

Also, notice that if you try to test for true values like 1 === 1 nothing will be logged on the console because assertion will only log false values.
Viewing DOM elements
You can view Dom elements on your page in two ways, either by: console.log(‘tagname’) — this will just log the element’s inner properties on the page. You can also use: console.dir(‘tagname’) — this will log out every single detail about the element. Like styles, child nodes, id, innerHtml and many more.
Counting values or attributes
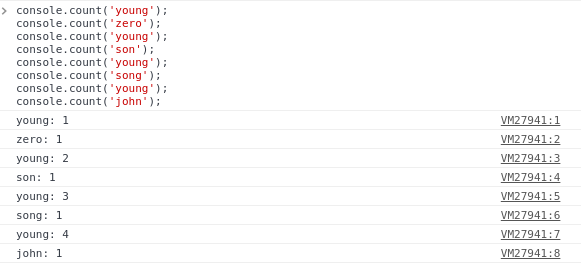
Many times you may want to log out the number of times an element is used on your page you can do that easily with the count function. console.count(‘tagname’) this will show the number of times an element has been called on a page. For demonstration sake let’s log names of people. In your console type:
console.count('young'); console.count('zero'); console.count('young'); console.count('son'); console.count('young'); console.count('song'); console.count('young'); console.count('john');You should get the following results:
Isolate DOM elements
More great articles from LogRocket:
- Don't miss a moment with The Replay, a curated newsletter from LogRocket
- Learn how LogRocket's Galileo AI watches sessions for you and proactively surfaces the highest-impact things you should work on
- Use React's useEffect to optimize your application's performance
- Switch between multiple versions of Node
- Discover how to use the React children prop with TypeScript
- Explore creating a custom mouse cursor with CSS
- Advisory boards aren’t just for executives. Join LogRocket’s Content Advisory Board. You’ll help inform the type of content we create and get access to exclusive meetups, social accreditation, and swag
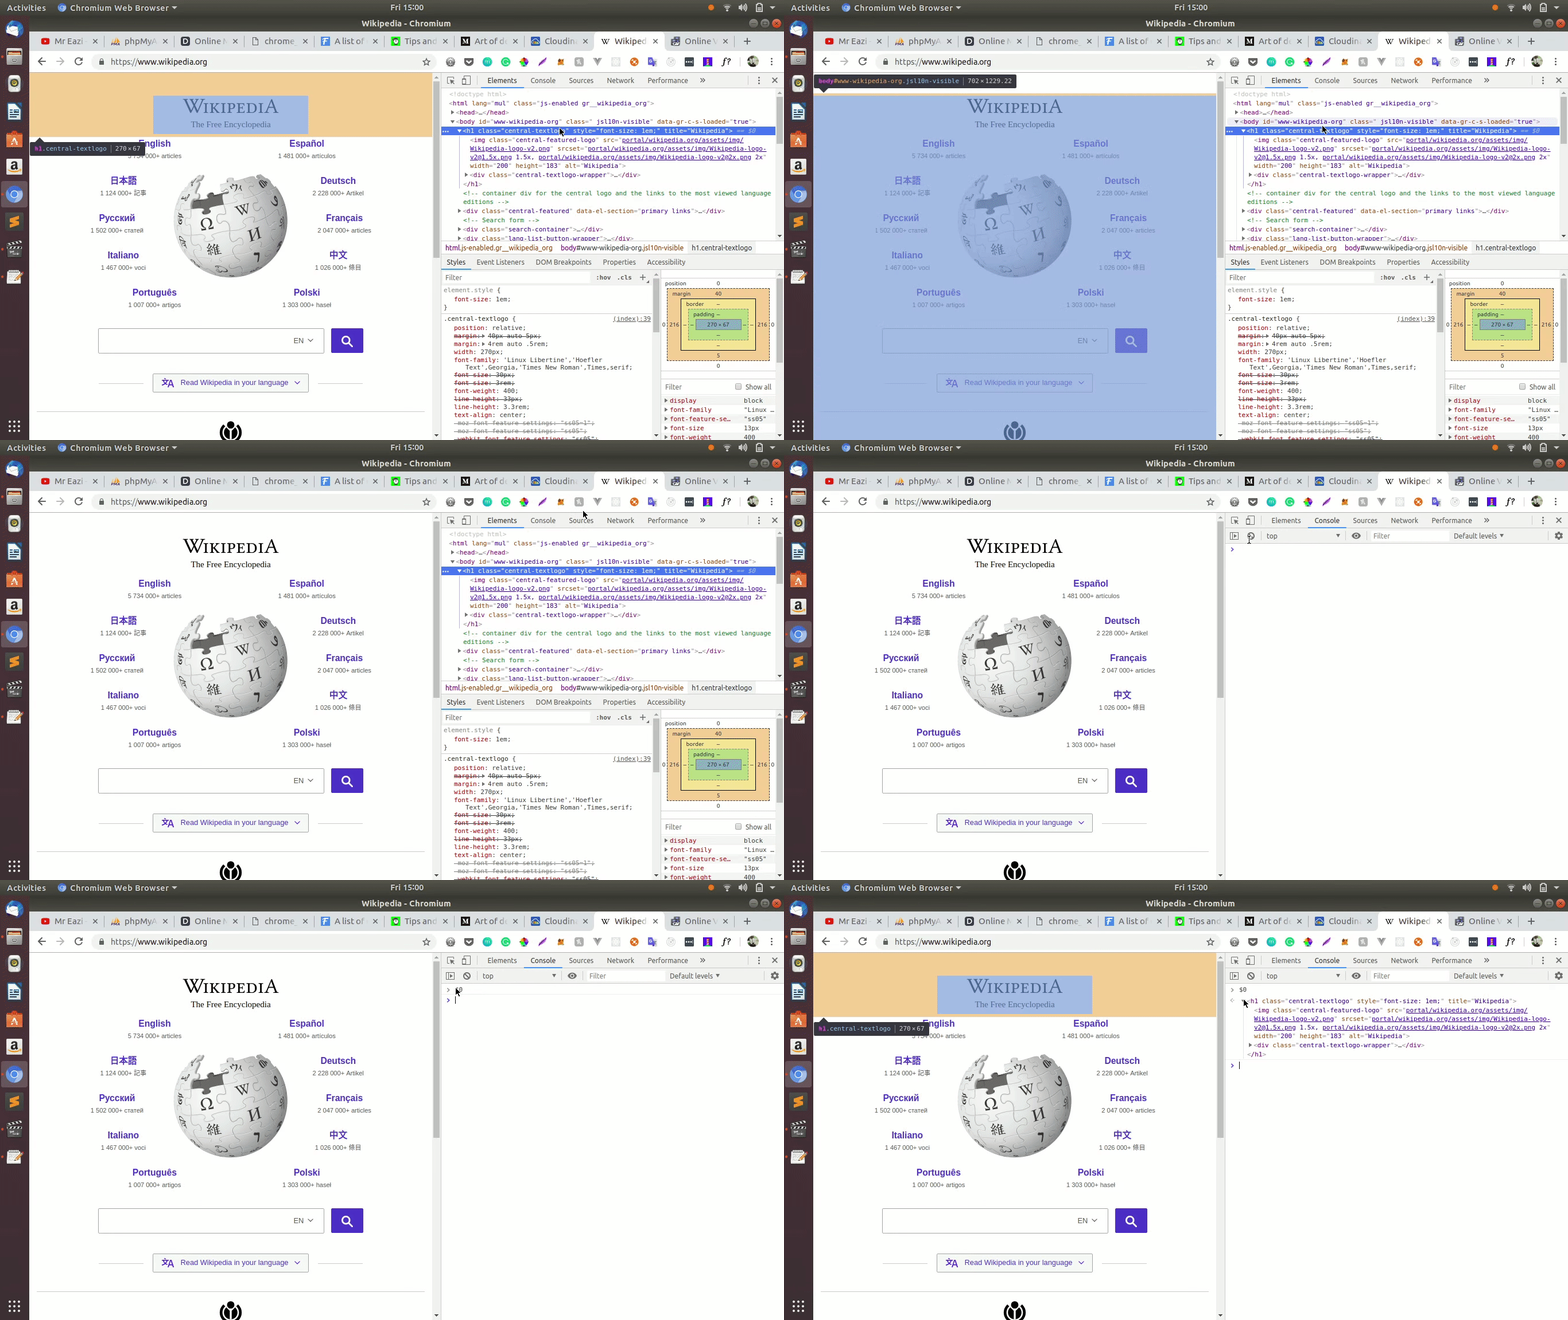
If you want more information about an element but can’t seem to get it because of how tough the code is all you need to do is click on the tag name from the element pane and a variable($0) will be assigned to it which you can the log.
Conclusion
In this article, we have looked at some ways which Chrome DevTools can enhance our development. There’s a lot of tips and tricks that are not covered in this article and I advise everyone to keep exploring and keep tabs on the Chrome DevTools blog.
Hope this article helped you!
Get set up with LogRocket's modern error tracking in minutes:
- Visit https://logrocket.com/signup/ to get an app ID
-
Install LogRocket via npm or script tag.
LogRocket.init()must be called client-side, not server-side$ npm i --save logrocket // Code: import LogRocket from 'logrocket'; LogRocket.init('app/id');// Add to your HTML: <script src="https://cdn.lr-ingest.com/LogRocket.min.js"></script> <script>window.LogRocket && window.LogRocket.init('app/id');</script> - (Optional) Install plugins for deeper integrations with your stack:
- Redux middleware
- NgRx middleware
- Vuex plugin


