
A while back, I owned revenue for a product with over 100 million monthly users. Our numbers were growing, the dashboards were green, and business reviews had turned into small celebrations.

Then revenue started dropping.
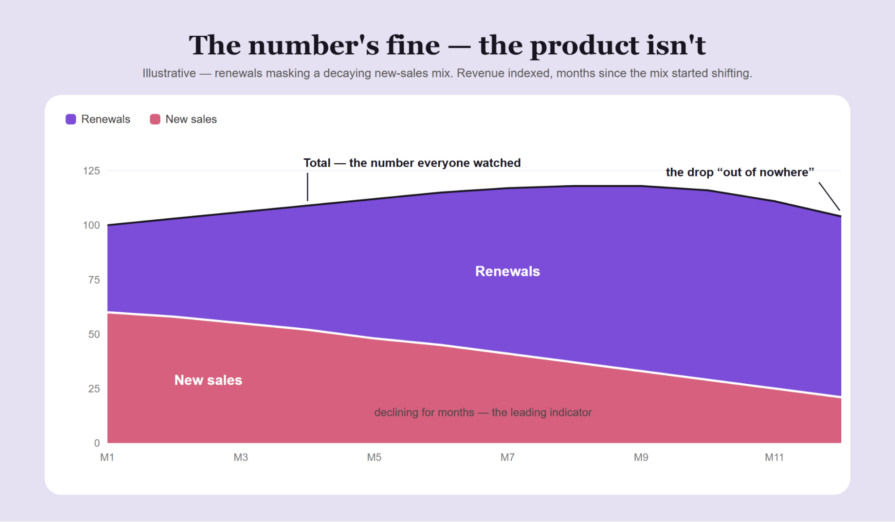
The root cause analysis was embarrassingly simple: renewals had been masking a decline in new subscriptions. Our headline number kept climbing while the engine underneath it stalled. By the time revenue fell, the damage was months old.
What stung was that the data was there the whole time. I owned the number, it was growing, and I kept reporting good news instead of questioning what was driving it. Hitting the target had become our evidence that the business was growing.
That’s the danger Goodhart’s law highlights for product managers. When you optimize a metric as a target, it can become a less reliable indicator of the outcome you actually want. Conversion can rise while the experience gets worse. You can hit a KPI while creating problems for the rest of the product.
Drawing on the mistakes I’ve made and the changes that helped, I’ll walk through three warning signs that your metrics are misleading you and four ways to keep targets connected to product outcomes.
Goodhart’s law describes what happens when hitting a number becomes more important than the outcome it’s supposed to measure. The number can improve without the product or business actually getting better.
It’s usually summed up as “when a measure becomes a target, it ceases to be a good measure.” I’ve yet to see a field embrace it as enthusiastically as product management.
Most people read the law as a warning about bad actors. Sales reps fudging numbers, teams inflating estimates, that kind of thing.
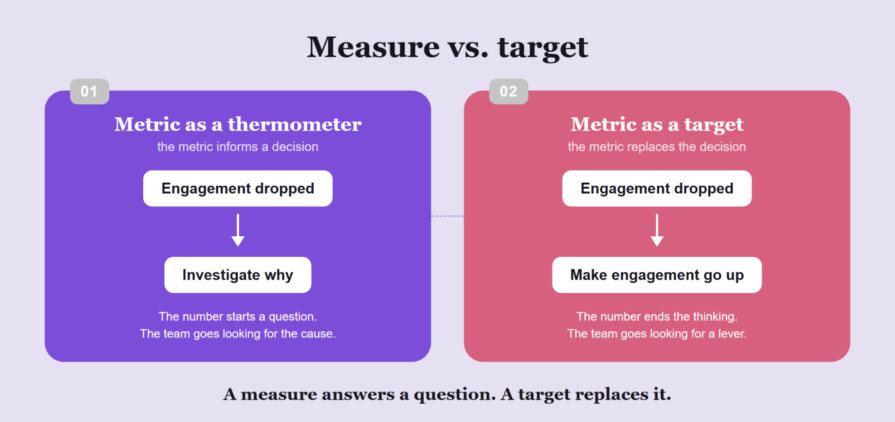
However, that’s only part of it. It speaks to what a target does to the psychology of smart, honest people. The moment a metric becomes a target, it changes the question your team is answering.
“Is the product getting better?” becomes “How do I move this number?” Those are different jobs.
Don’t get me wrong. I’m a metrics guy. I’ve spent a good chunk of my career elbow-deep in dashboards, and I’d do it again. Data isn’t the problem. Obsessing over metrics is.
The uncomfortable part? You rarely decide to do this. It happens by degrees.
Metrics-driven development, as most teams practice it, can quickly become a dopamine-chasing game. I ran a rapid experimentation program shipping two to three experiments a week. Nothing feels better than a winning test on a Friday.
Green dashboards are a drug for PMs. Every uplift delivers a little hit of “I’m good at my job” — which is exactly why nobody in the room wants to ask whether the number still means anything.
As another example, I once inherited a freemium funnel with more than 50 conversion entry points: banners, popups, tooltips, and ad-like placements. Each had been added after a winning A/B test; each was supposedly “worth” around half a percent of revenue. And none of them could be removed.
“Can we remove this one?”
“That’s half a percent of revenue.”
“Says who?”
“The test.”
I’ve written about this before, describing it as conversion pollution. What I didn’t write about back then is the defense mechanism.
Nobody in those conversations was lying. Nobody was even wrong — every placement really did win its test. That’s what made the whole thing untouchable. “The test proved it” ends conversations that evidence should start.
Meanwhile, the product got messier, the UX got noisier, and running any clean monetization experiment became close to impossible.
Fifty locally correct decisions. One globally wrong product.
So, how do you catch it? That’s the tricky part since Goodhart failures don’t look like typical product failures. The metric is up, the team is hitting targets, and everyone’s getting praised.
Here are three patterns to look for in a seemingly high-performing team, along with an easy way to check whether they’re happening to you.
On that same product, we once made content metering stricter. Conversion went up, the test “won,” and everyone moved on.
Over the following six months, engagement decayed. The lesson that stuck with me was that some bills arrive half a year after the purchase. If you close the books in two weeks, everything looks like a win.
I’ve seen the same mechanics with the novelty effect in A/B testing. A/B test results without long-term tracking are just a vanity metric.
Check
Can everyone on your team finish the sentence “Users are better off because…” for your last three shipped wins? If the honest answer is “the number went up,” the actual bill may not have arrived yet.
We also redesigned the ad experience for the product. Instead of a click-to-launch, 30-second blocker, the ad started playing immediately and could be skipped. Perceived friction went down and we could actually show more ads.
The ads team blocked it anyway. The 30-second video was their most premium placement, and premium pricing doesn’t survive a skip button. By their metric, at current traffic, the change genuinely was a loss.
The win only appeared when we projected the engagement lift from a less annoying product across the whole business. Their target wasn’t lying to them; it was just too narrow to see the larger win.
It took CEO-level escalation to ship it. Zoom out, and that’s Goodhart at the org level: every team optimizing its own number, with nobody responsible for the whole.
Check
When was the last time a team in your org voluntarily took a hit to its own KPI for a global win? If you can’t remember one, your targets might be at war with your product.
Time to close my revenue story. You already know the mechanics — renewals riding an old wave of sales, new subscriptions declining underneath. What I haven’t told you is the part I’m least proud of: the composition data was there the whole time.
Nobody was hiding it. I owned revenue, the number was growing, and I pushed the excitement upward instead of decomposing it. The target was rewarding me for not looking.
Had I flagged the shift when it started, we would’ve entered panic mode months earlier, with far more room to act. Instead, we got a fire drill.
The fix was almost trivial. I stopped reporting revenue as one number. New sales became the headline and renewals were a separate line trailing behind it. Same data, same dashboards, but a different question.
Check
Can you decompose your headline metric into three to four underlying streams from memory? If you only ever look at the aggregate, the aggregate is where the problems will hide.
Fewer metrics alone won’t save you. I’ve rarely seen a product improve because a team measured less. What has to change is the relationship between the team and the number. Here are four guardrails that have worked for me.
When I worked on the loyalty app of the biggest convenience store chain in Poland, one of our strategic goals was driving more store visits. It was easy to game by flooding users with cheap incentives to generate foot traffic that’s worth nothing.
As a result, the target never traveled alone. Basket size rode along as an explicit counter-metric. You couldn’t “win” by generating worthless traffic. The pair wouldn’t let you.
My rule of thumb is that if you can imagine a dumb way to hit the target, the counter-metric’s job is to make the dumb way lose.
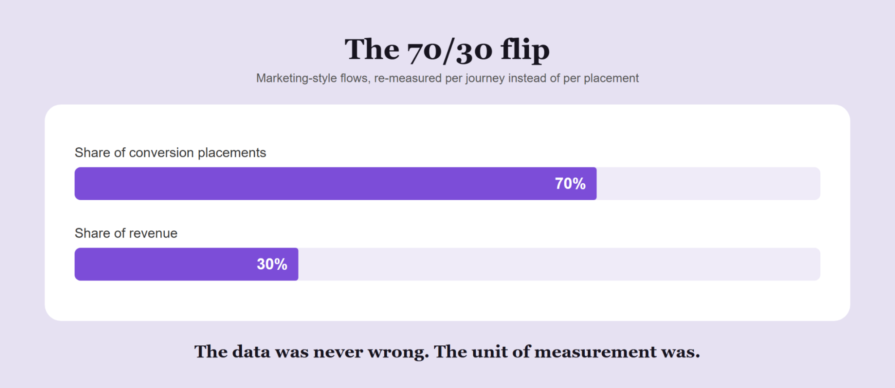
Back to the conversion pollution story. More per-placement data wouldn’t have helped — we had plenty. Instead, we changed what we were counting.
Instead of attributing revenue to individual placements, we grouped them into journey flows and pulled the numbers per flow. The picture flipped overnight: the marketing-style flows held around 70 percent of the placements but generated about 30 percent of the revenue.
Most of the UX noise, most of the maintenance cost, and most of the untouchable “winners” were all defending a minority of the money. We deleted the bulk of them and nothing broke.
Metrics do their best work as diagnostics, not KPIs. On another project, I inherited a team with a median cycle time above three weeks. We tracked cycle time and time-to-first-review obsessively, but as a thermometer, not a target.
The data pointed at ignored pull requests, so we added a daily Slack reminder bot. The team hated it and asked to kill it at the retro. The data showed time-to-first-review had dropped 30 percent since the bot appeared.
The bot stayed.
Median cycle time went from over three weeks to about seven days. Cycle time was never anyone’s target. It was a diagnostic we used to find problems. I’m convinced that’s exactly why the number stayed honest.
A metric is a thermometer. Pay people for the temperature, and someone will put the thermometer next to a radiator.
Think back to the stricter metering from sign one — a win when the test was called, a loss six months later. Targets have the same shelf life. The context that made a target smart in Q1 is often gone by Q3.
On paper, quarterly planning handles this. In practice, targets just get rolled over: the same metric, a more ambitious target, and nobody asking whether it’s still the right number to chase.
The fix is almost comically literal. When you set a target, set the date it dies. When that date arrives, don’t roll it over automatically. Make the target argue its way back in, from scratch, against today’s context.
Old target = new blind spot.
Keep the measure and the target apart. Measure generously. Whatever you promote to a target, pair it with a counter-metric, give it an expiration date, and decompose it before you celebrate it.
But the real takeaway sits one level deeper. Goodhart’s Law isn’t fundamentally a data problem. The metric changes the team long before it changes the product. It swaps “Is this getting better?” for “How do I move this number?” Nobody notices because every individual decision still looks rational.
In other words, the best teams I know use metrics as guides to build a better product, not as targets to hit.
Featured image source: IconScout
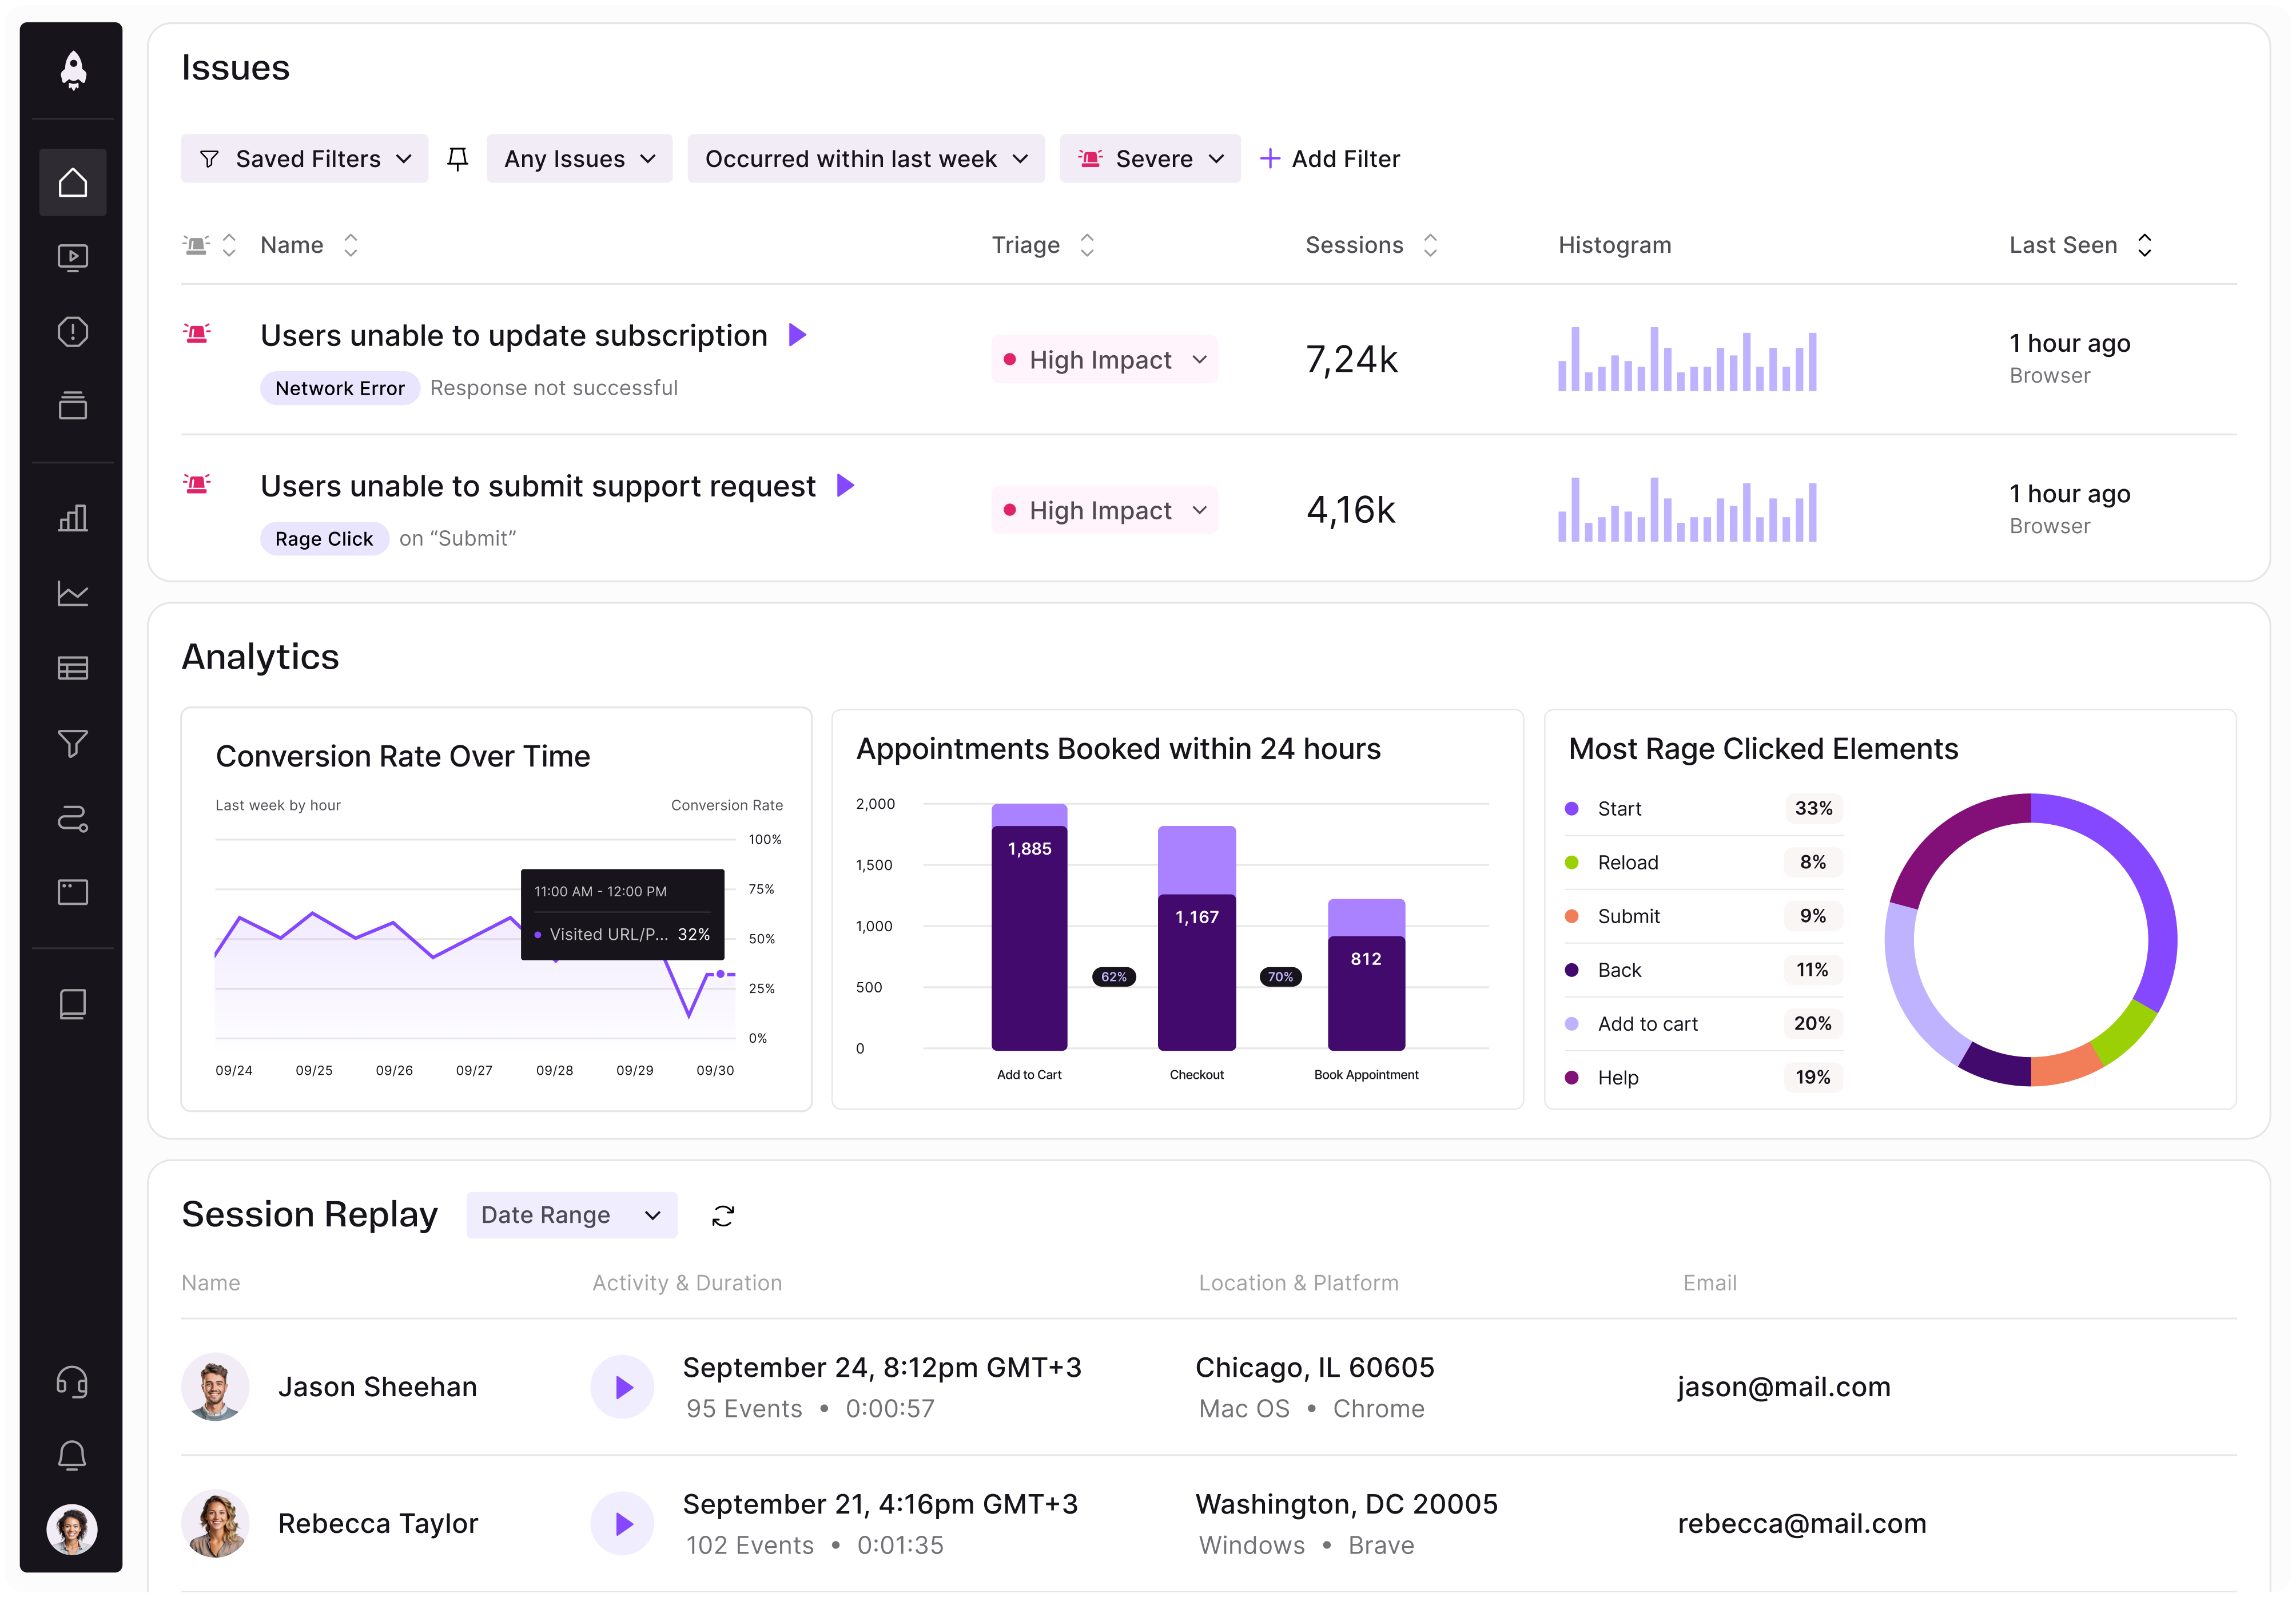
LogRocket identifies friction points in the user experience so you can make informed decisions about product and design changes that must happen to hit your goals.
With LogRocket, you can understand the scope of the issues affecting your product and prioritize the changes that need to be made. LogRocket simplifies workflows by allowing Engineering, Product, UX, and Design teams to work from the same data as you, eliminating any confusion about what needs to be done.
Get your teams on the same page — try LogRocket today.

Keep the reasoning behind product decisions within reach. Build a clear system to track customer feedback, priorities, and project progress.
Discover how Meilisearch uses LogRocket’s MCP and Galileo to improve free trial conversion and adoption of newly shipped features across its Cloud product.

Resolve cross-functional conflict in AI product development with a 3-step framework to clarify risks, assign owners, and align teams to act.

Learn when prompt-first UX adds friction and how product managers can choose AI interfaces that balance flexibility, structure, and control.


 Learn more →