Aliyah Davis runs an American-based online fashion and beauty store. She understands data and insights are key to improving marketing campaigns, store performance, and sales but she’s not sure what to look for or how to interpret the data.
Aliyah’s last marketing campaign for discounted hair moisturizers via Facebook Ads reached over 10,000 potential customers, resulting in a 37 percent increase in visitors and 2 percent additional sales. But is this good? Are these the right insights to look at? What could have been done to improve the sales further?
To make more sense of the available data and insights, Aliyah should look at the conversion rate.
A conversion is when someone carries out an action you intend them to take. The conversion rate is the percentage of users who complete such an action.
In the case of Aliyah’s marketing campaign, the conversion rate is related to the goal of customers purchasing one or more of the discounted hair moisturizers.
The desired goal can also cover a variety of actions, such as signing up for an event, using a certain feature, and downloading a discount coupon.
You can calculate the conversion rate by dividing the number of conversions by the total number of visits:

There is a school of thought that the conversion rate should only take unique visits into account.
There are pros and cons to following this notion. The biggest benefit is that the conversion rate will be higher. The downside is that following this approach makes finding optimization opportunities more difficult.
If you’re only accounting for unique visits, the conversion rate formula is the number of conversions divided by the total number of unique visits with the intent to convert:

As we mentioned before, Aliyah’s last campaign reached 10,000 potential customers. Looking further into the data, she sees that 8,000 users clicked on the campaign, of which 7,500 were unique visitors and 400 bought one or more of the discounted hair moisturizers.
The conversion rate of her campaign is as follows:
(400 / 8,000) * 100 = 5 percent
We use the “original” conversion rate formula in this example because Aliyah wants to understand whether users completed the conversion cycle the first time and, if not, what prevented them from completing it.
We’ll dive deeper into this topic later on, so, I would encourage you to keep reading.
Aliyah is ecstatic that she now knows the conversion rate! After the joy rush wears down, she wonders, what does this 5 percent conversion rate actually mean? Is it a good number? What is the average conversion rate of a marketing campaign? How can I improve this number?
If you search online, you’ll find results with a “good” conversion rate of around 2–5 percent and others that say you should aim for about 10 percent. But it’s not so straightforward; there is a lot that goes into defining what constitutes a successful conversion rate.
To gain a better understanding of what constitutes a good conversion rate for your product, answer these three questions:
Customers’ evaluation criteria differ depending on the industry. For example, having customers take an intended action for a product in financial service will have a different result than customers taking an intended action for a beauty product.
Conversions are measured via websites, landing pages, newsletters, paid ads, social media posts, organic searches, and so forth. Each setting has a different purpose, success, and conversion rate.
The conversion objective references the type of goal you are pursuing.
For instance, the conversion rate for users downloading a white paper differs from the conversion rate for customers making a purchase.
Even when you’re measuring purchases, what constitutes a good conversion rate can vary depending on the type of product. For example, a sale for a simple product (e.g., a protein shake), has a different conversion rate than that of a complex product (e.g., life insurance).
Through research, Aliyah discovers that the average conversion rate for a beauty product campaign is 7 percent. This means her campaign’s conversion rate of 5 percent is performing well below the average. So, how can Aliyah improve her conversion rates and boost her campaign’s performance?
Eager to get a better result from her next Facebook campaign, Aliyah is keen to optimize the 5 percent conversion rate. So how can she do that?
To optimize your conversion rate, start by understanding the conversion funnel, then look at what the data tells you about each step in the funnel and uncover the experience of a visitor while going through the funnel.
To understand the conversion funnel, look at the process steps. These are the steps taken from the moment the visitor is made aware of the conversion opportunity to the actual conversion.
For instance, if you are looking for a hair moisturizer, you might search for the “best hair moisturizer product” online. The search engine will present you with many options that might pique your interest.
There is a good chance you will gather some more information on a few sites and then decide on the product and the online store to buy it from. Now you select, order, and pay for the product, and await for it to be delivered to your home.
What does the data tell you about friction points in the process? The five metrics listed below are particularly useful to evaluate when endeavoring to improve your conversion rate:
The click-through rate (CTR) is the number of clicks from a visitor on the ad divided by the total number of times the ad is shown to a visitor.
The CTR indicates how well keywords and ads are performing.
Session duration is the time spent by a visitor in a session.
The session duration provides more context on the throughput time it takes to complete the conversion.
Interactions per visit are the number of actions a visitor takes in a session.
The interactions per visit provide an initial perception of customer behavior and the ease of achieving the intended conversion.
The bounce rate measures the number of visitors who abandon a step in the conversion funnel before completing the intended activity.
This metric supports the understanding of which step in the process creates the most friction and provides an opportunity for optimization.
The device type of visitors who expressed a conversion intention gives you an understanding of where your customers are experiencing the conversion.
Nowadays, so much of customers’ engagement with apps and products occurs on mobile devices. Therefore, this information gives you insights into how mobile-friendly your product needs to be.
The one to conquer them all. If you understand the process and understand what the data tells you, then validate those assumptions with visitors.
Reach out to visitors where regulations and compliance allow. Where you have to make assumptions, create and execute experiments to validate the assumptions.
Referring back to our example, Aliyah takes a look at her Facebook Ad through the lens of the user.
When a visitor sees the campaign, the visitor is encouraged to click the call-to-action (CTA) button. Clicking the button leads to the main page where all products are presented.
The visitor searches for the discounted product. The visitor then adds the products to the shopping cart and proceeds to checkout.
At the checkout, the visitor adds the discount code from the campaign. The visitor either creates an account or logs in to their existing account.
After being logged in, the visitor pays for their products by using a credit card. Now let’s apply the following five key metrics to help us evaluate the data for our conversion rate.
Aliyah gathers all the data and, from her previous analysis, she already knows that the CTR of the campaign is 80 percent:
(8,000 / 10,000) * 100
On average, a visitor session lasts 2 minutes and 58 seconds when browsing, and for visitors who convert to making a purchase, the average session is 8 minutes and 38 seconds.
The average interactions per browsing visit are 15. For those converting, the average is 12.
The bounce rate for each step is as follows:
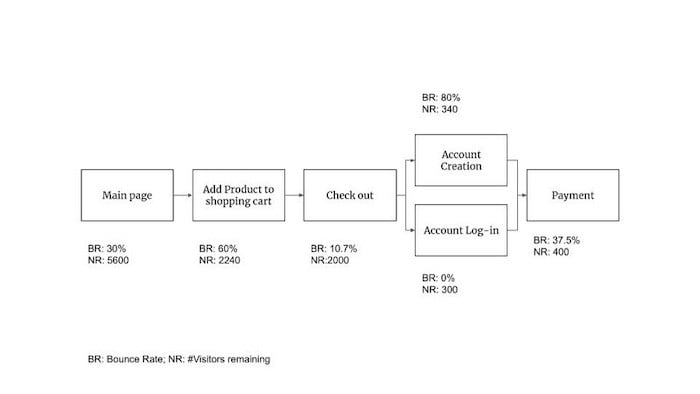
Aliyah finds that 89 percent of her visitors are mobile users and 11 percent are desktop users.
After uncovering the visitor’s experience, Aliyah focuses on three key areas of improvement: adding products to the shopping cart, account creation, and payment experience.
She discovers that visitors couldn’t find the discounted product, and when they did find it, sometimes they couldn’t add it to their shopping cart for unknown reasons.
On account creation, visitors did not feel the need to create an account and were uncomfortable providing many details needed to create an account.
Regarding payments, visitors would love to have the ability to pay through PayPal and Google Pay.
Conversion rate is traditionally viewed as a marketing metric to gauge whether campaigns are targeting the right audience and effectively swaying visitors to complete an intended action. However, it’s also an important product management metric.
Conversion rate helps PMs validate the product design and user journey and experience, identify bugs in key conversion events, and uncover opportunities for improvement.
Going back to our example, with the insights uncovered, Aliyah decides to focus on four items:
Conversion rate is a simple concept to understand but tricky to benchmark and optimize. Analyzing and tracking metrics is a part of the product lifecycle, and understanding conversion rates help product managers tailor the product based on what the customer needs it to be.
Featured image source: IconScout
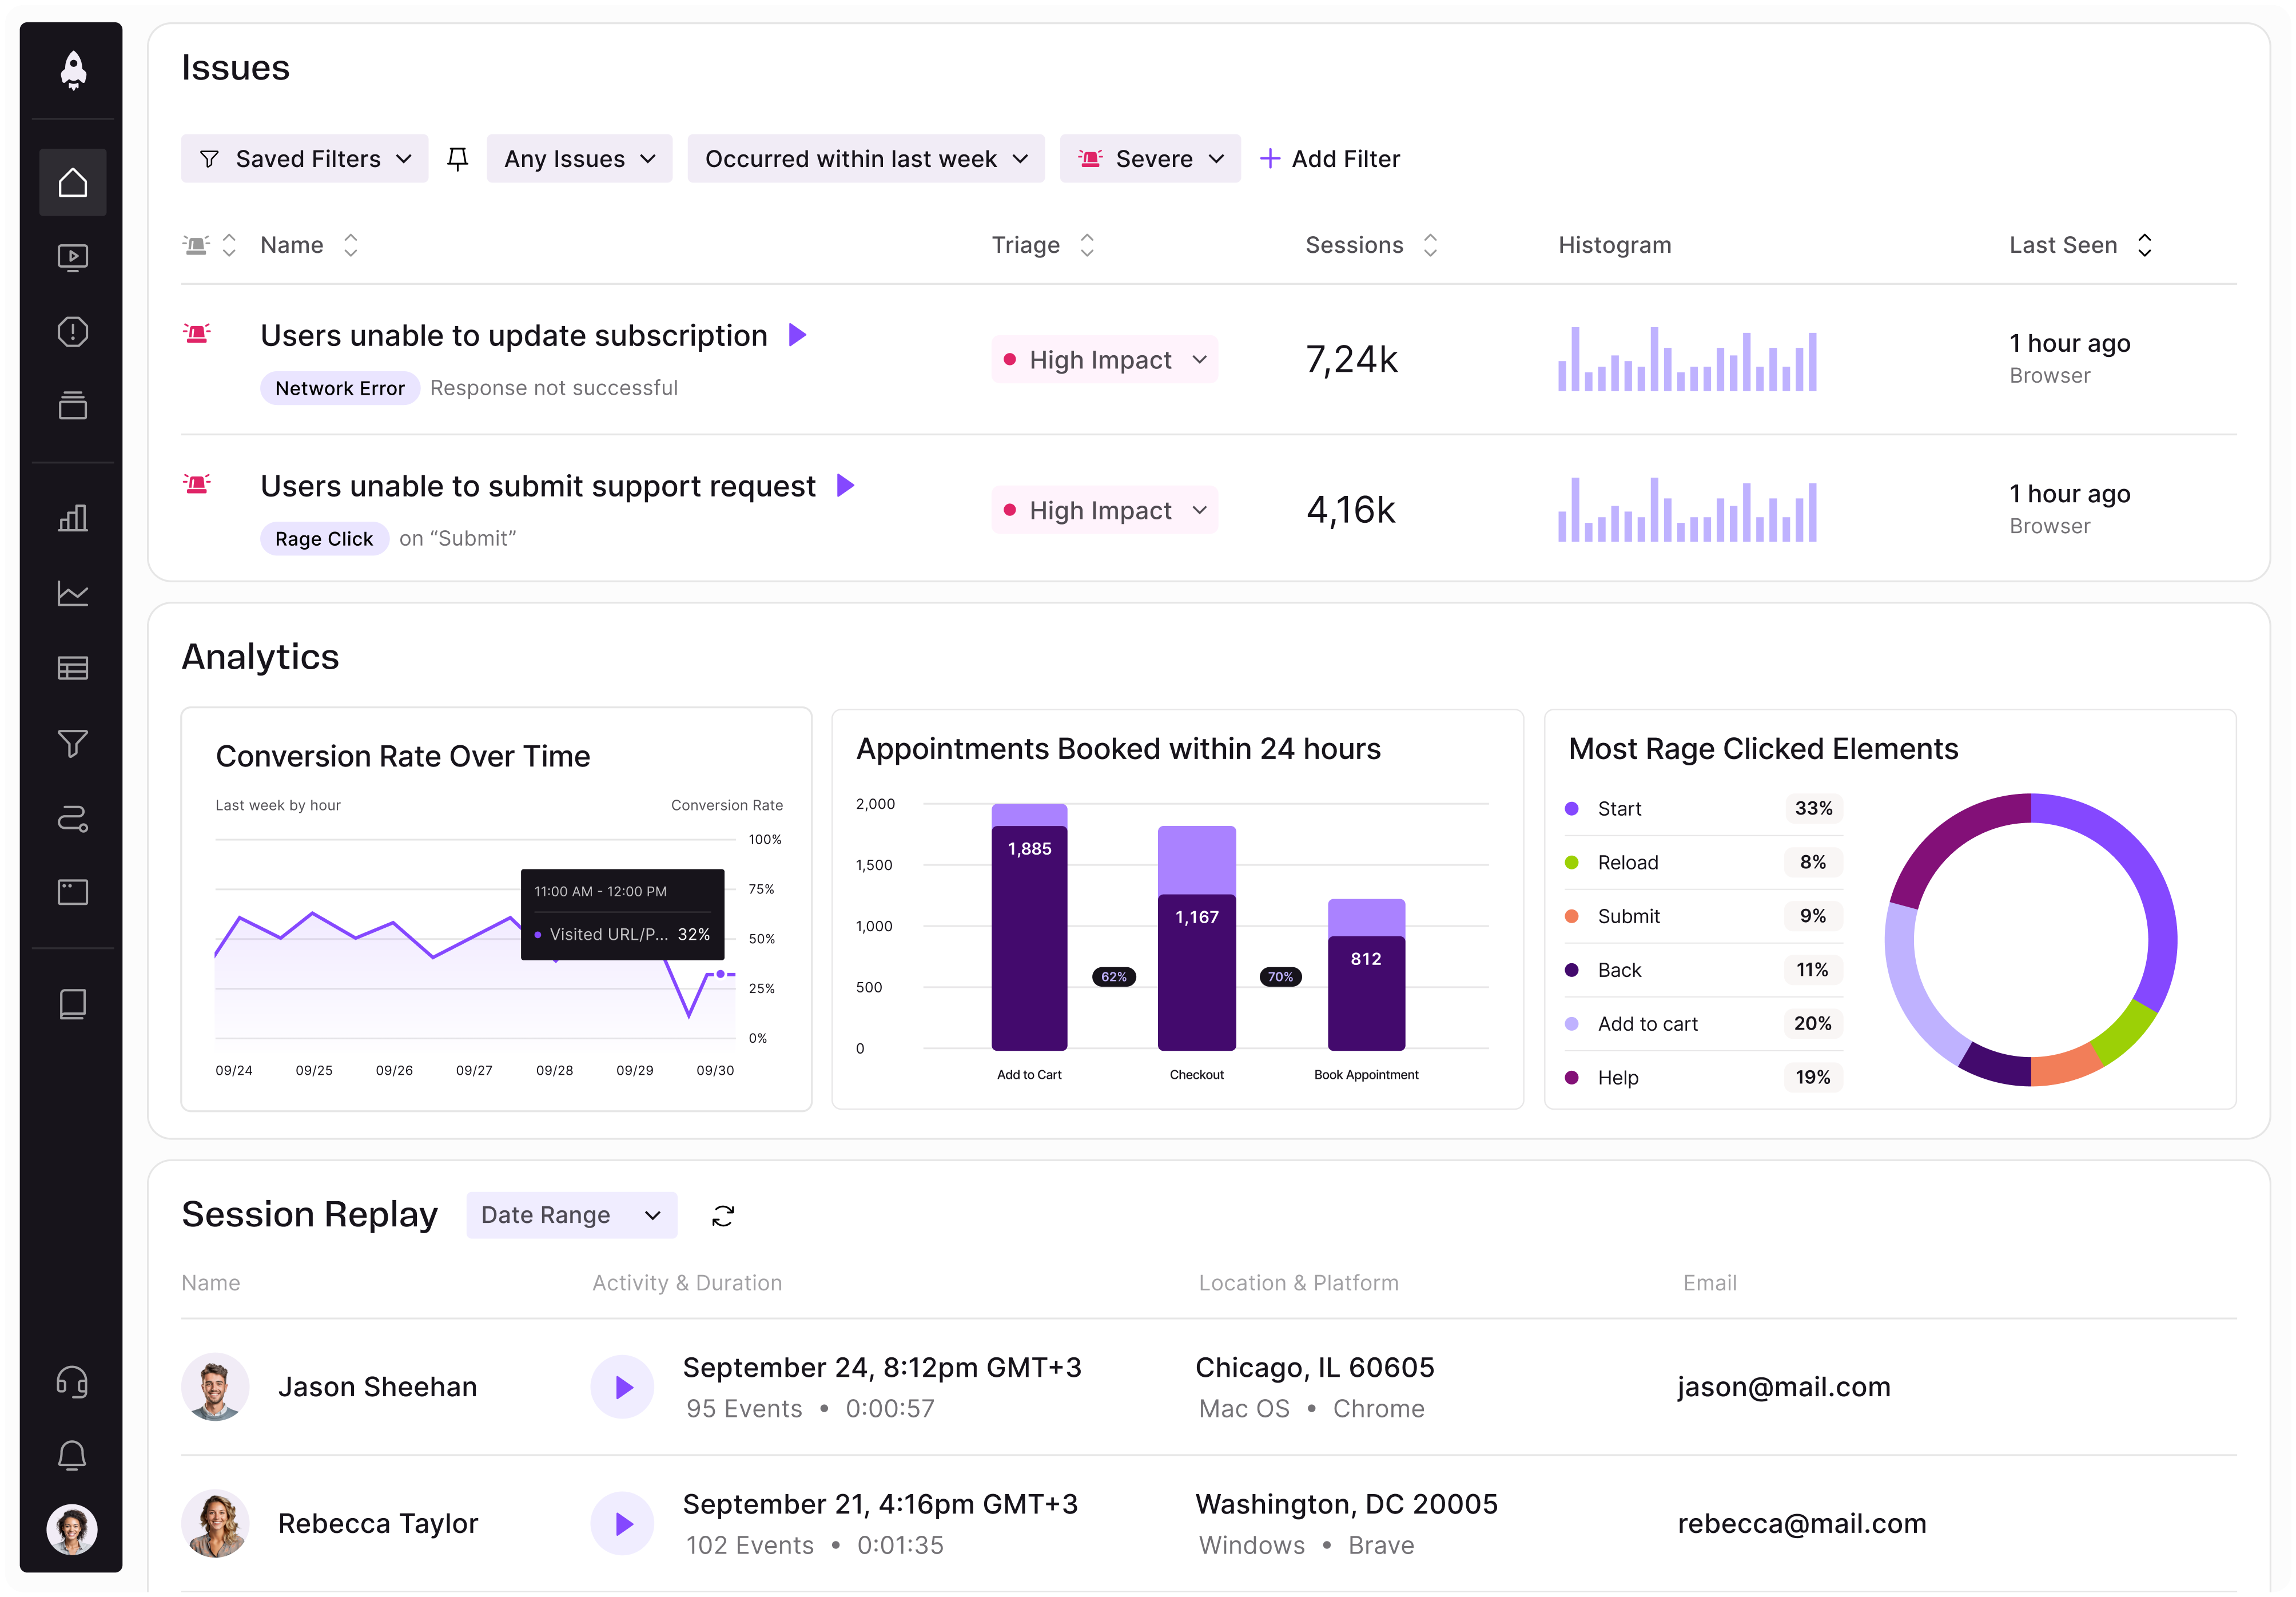
LogRocket identifies friction points in the user experience so you can make informed decisions about product and design changes that must happen to hit your goals.
With LogRocket, you can understand the scope of the issues affecting your product and prioritize the changes that need to be made. LogRocket simplifies workflows by allowing Engineering, Product, UX, and Design teams to work from the same data as you, eliminating any confusion about what needs to be done.
Get your teams on the same page — try LogRocket today.
Learn how PMs can use AI evals to diagnose output quality issues, set pass criteria, and improve AI features with less guesswork.

Learn how PMs can replace bloated PRDs with lightweight docs that align teams, reduce risk, and keep AI-assisted development moving.

New from LogRocket: Galileo AI now spots your highest-impact bugs and dispatches them to AI agents in Cursor, Claude Code, or Codex to fix.

Learn how PMs can use AI and communication to spot duplicate work early, align teams, and protect engineering capacity.


