Deciding how much to charge for a product can keep product managers and founders up at night.

That’s not surprising. Charge too little, and you might leave half of your revenue potential on the table. Charge too much, and you will scare off potential customers, possibly losing money in the process.
Luckily, there are various techniques for identifying the optimal price points for products and services that eliminate guessing games from the process and help you make an informed decision.
One of these tools is the Van Westendorp Price Sensitivity Meter (PSM for short). It’s one of the most adopted techniques for identifying optimal price points.
Let’s unpack what it is and when and how to use it.
The Van Westendorp Price Sensitivity Meter is a research tool used to determine the range of prices your users would deem acceptable for your product. You can use the meter to understand user perceptions of value and pricing. This becomes incredibly important when you’re looking to launch a new product, or modify the pricing strategy of an existing product.
Van Westendorp’s price sensitivity meter shines under two conditions:
If you are offering a product or service already known on the market, such as a VOD streaming platform, then customers already have established expectations towards the price. Unless you are extremely innovative, there’s no need to reinvent the wheel. Analyze how much competitors charge and what they offer in return, and evaluate how you compare to them.
Van Westendorp’s price sensitivity meter is a quantitative study, and as a bare minimum, you’ll need a thousand responses to draw any conclusions. For this reason, PSM is more often used for B2C than B2B offerings.
To sum up, if you are building a relatively new offering that doesn’t have established market expectations towards the price, and you can collect thousands of survey responses from prospective customers, then Van Westendorp is likely the best tool you can use to define your price.
There are three steps to developing a price-sensitivity meter:
The PSM survey has two main parts:
Before you ask customers how much they are willing to pay for the offering, you need to clearly explain what they’re paying for.
Depending on which stage of the product development lifecycle you currently are, it might take the form of:
Don’t focus on basics such as registration and login. The objective here is to highlight your value proposition — what are the two to three main things your potential customers will pay for?
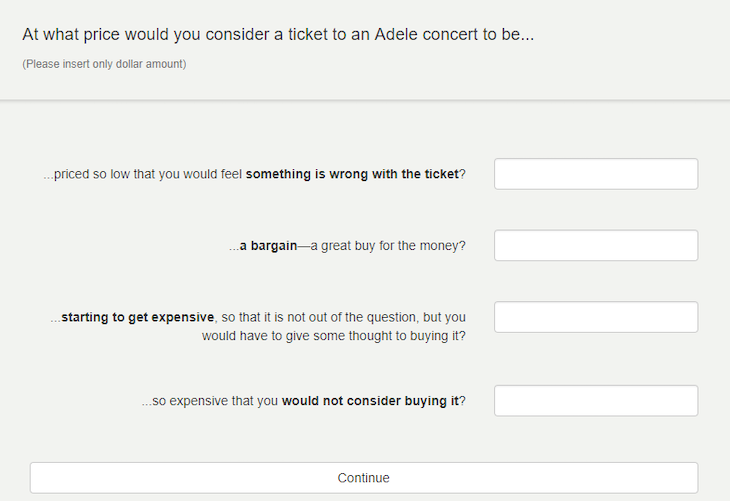
Once users respond and understand what your product does, ask them the following questions:
At what price would you consider our product to be:
The exact phrasing of these questions might differ. The goal is to discover four price points:

You can use this opportunity to ask additional qualitative questions and get further insights into their willingness to pay and overall product sentiment. However, these won’t be part of price-sensitivity analysis.
There are three things to consider when collecting responses:
First of all, you don’t want to ask random people on Reddit whether they’d buy your product or not, but you want to reach people who might actually be interested in the purchase.
One way to achieve this would be to send the survey only to eligible candidates, such as hobbyist forums or niche e-mail databases.
An alternative approach is to build in a screener that’ll filter out people who are not your target group.
Filter out responses that simply don’t make sense. The two most common areas are
Lastly, you need a high volume of answers. The general rule of thumb for Van Westendorp is between 2,000 and 10,000 responses.
This volume requirement, combined with eligibility and quality needs, makes the survey difficult to conduct and is the reason why many product companies decide to partner with pricing agencies to conduct this study.
If you are doing the survey in-house, I’d say that 1,000 responses should be enough to give you a high-level picture. The real question is your risk appetite and final objective. For a dip test, even a few hundred might be enough. For a statistically significant “fact,” you should aim closer to a five-digit number.
The last step is to create cumulative frequencies for each price point.
This is a heavily statistical concept usually performed by a skilled data analyst. Explaining the process step-by-step would be overkill — I worked on PSM studies three times, yet never had to perform this step myself.
However, if you really need to conduct this analysis on your own, numerous Excel templates are available for that purpose.
Excel templates:
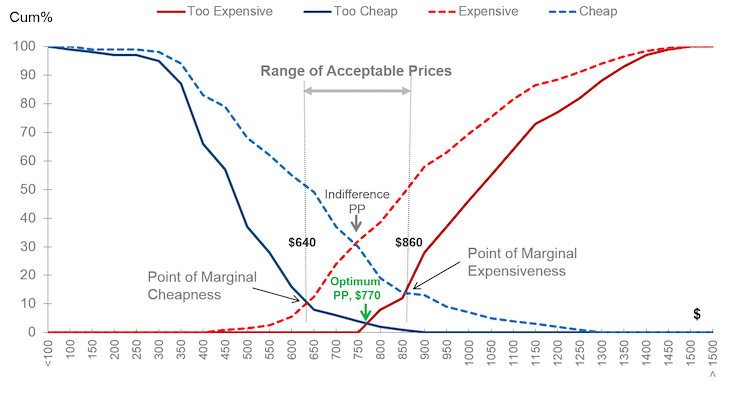
After plotting cumulative frequencies, you’ll end up with a four-line chart similar to the one below:

What we are primarily interested in are the three line intersections:
The point of marginal cheapness is the price point above which more people perceive the price tag as “expensive” than “too cheap.”
It’s often a sweet spot for penetration pricing.
Charing that price point below is usually counter-productive — more customers would perceive you as too cheap (which also isn’t good; too low prices raise quality concerns) than expensive.
An expectation would be if you want to double down on market penetration with an already established brand.
The price point where more people start to perceive you as “too expensive” than “cheap” should be the maximum price you charge for.
Charging above that price point would scare off most of your potential customers.
An exception would be if you deliver a niche, luxurious offering that doesn’t require a high sales volume.
The moment the number of people saying the offering is too cheap (which could raise quality concerns) and too expensive (to even consider) is the same is usually referred to as the optimal price point.
Charge above this price point and the percentage of customers perceiving you as too expensive will rapidly grow. Charging below this price point will lead to an increasing number of customers considering you too cheap.
Although the theory behind the optimal price point is sound, take it with a grain of salt.
Remember that the study, even if extensive, was based on an isolated sample of potential buyers. It also relies on the theory of perfect economic equilibrium, which, in reality, rarely (if ever) happens.
Since you shouldn’t charge below the point of marginal cheapness (PMC) or above the point of marginal expensiveness (PME), you end up with a so-called range of acceptable prices.
Technically speaking, every price point between PMC and PME is a viable price to charge your customers.
If you were to choose blindly, then go with the optimal price point; it’s probably your safest bet.
But the proper way would be to consider also other factors than customers willingness to pay, such as:
Ultimately, the main objective of a PSM is to inform you what price range is available to you, but it can’t set the price for you.
Setting the right price is among the most important decisions you need to make when launching a new product or service, so it’s essential that you invest enough time and resources to limit the guessing game and make an informed decision.
The Van Westendorp Price Sensitivity Meter (PSM) is one of the tools that can help you reduce ambiguity when making a decision. It’s best suited for discovering the price of unestablished products with a large pool of potential buyers.
Any price point between marginal cheapness and expensiveness should work for your offering. However, the perfect price points depend on many other factors, such as your strategy, branding, objectives, costs, and expected LTV.
Points of marginal cheapness and expensiveness help you narrow down your thinking, but no tool will be able to make the final pricing decision for you.
Featured image source: IconScout
LogRocket identifies friction points in the user experience so you can make informed decisions about product and design changes that must happen to hit your goals.
With LogRocket, you can understand the scope of the issues affecting your product and prioritize the changes that need to be made. LogRocket simplifies workflows by allowing Engineering, Product, UX, and Design teams to work from the same data as you, eliminating any confusion about what needs to be done.
Get your teams on the same page — try LogRocket today.

Emmett Ryan shares how introducing agile processes at C.H. Robinson improved accuracy of project estimations and overall qualitative feedback.

Suvrat Joshi shares the importance of viewing trade-off decisions in product management more like a balance than a compromise.

Great product managers spot change early. Discover how to pivot your product strategy before it’s too late.

Thach Nguyen, Senior Director of Product Management — STEPS at Stewart Title, emphasizes candid moments and human error in the age of AI.