AI is not a new field of work, and it’s definitely not limited to chatbots such as ChatGPT. Your credit score, your Instagram feed, the price of a BigMac, the ads on TV, your prescriptions, etc. — almost everything is directly or indirectly powered by AI at some point in its lifecycle. The people building and maintaining those tools are commonly bundled under the “data” profession.

Product managers have always been heavy users of data in general, so it’s only natural that data professionals and product managers get along. What was originally a simple “demand-delivery” relationship between the two roles came to be an intimate codependency with digital products, becoming more and more reliant on AI value generation.
Up until the release of ChatGPT, it was fairly common to see data scientists working inside multidisciplinary squads in sectors, such as banking and fraud prevention. With the cultural boom generated by OpenAI in 2022 and the following race for AI, what were niche squad topographies have become more and more ubiquitous, with most squads now interacting regularly with data science.
If you’re new to the whole AI bandwagon and are starting to work with data professionals right now, this is the article for you.
The “data” roles are mostly divided into three groups: data engineering, data science, and data analysis. For the purpose of relevance, I’ll be talking about data science specifically because this is who PMs tend to interact with the most.
Data science, in broad strokes, is the knowledge area responsible for building, training, and applying machine learning (ML) and AI algorithms to business problems. The goal is to understand or to answer these problems by using complex sets of data.
In the same way a software engineer is responsible for building and maintaining general software, the data scientist does the same with AI software. They know how to code (usually in Python), have a very good grasp of mathematics and statistics, and are familiar with the majority of models and research on the field available today.
If you have the luck of interacting with a data scientist or working with one inside your team, be ready to have a new best friend.
Data scientists solve business problems with AI and ML. We covered that already, but exactly what type of problems can they take care of, and how do they do it? We can break this answer into four different axes: structured data, unstructured data, supervised learning, and unsupervised learning:
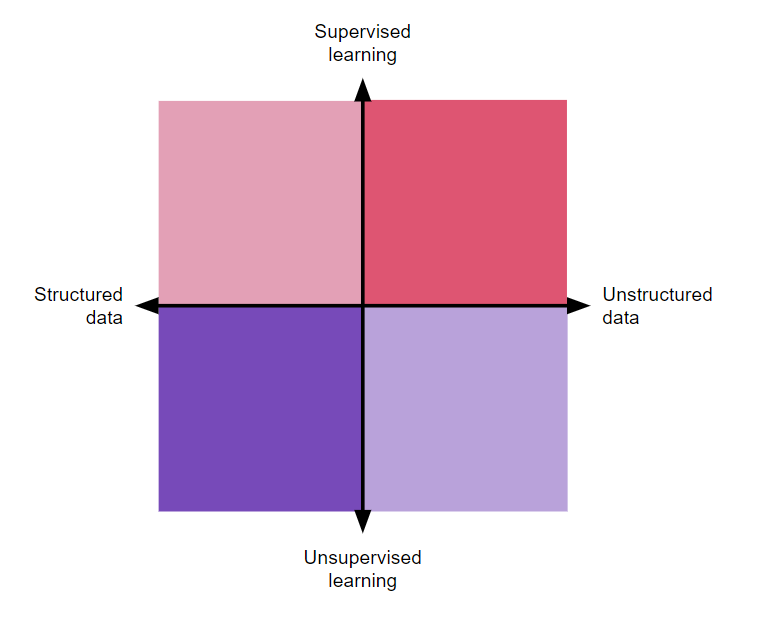
Structured data is either numeric or categorical, they are always organized in a table structure (or are, at least, can be organized into one). Your bank record is a structured dataset because there are dates, amounts, and labels for expenses. Your internet history record is also structured data. Same for national demographics or Spotify Top Hits lists.
Structured data problems were the first to be explored when AI was still young, and they are the most common, inexpensive, and easy-to-grasp applications of AI.
Unstructured data, as opposed to structured data, is data that you can’t plot in a graph or table. It’s not measurable mathematically in its natural form — long text, images, sound, and video, mostly.
Translation and auto-correct are some of the oldest applications of unstructured data AI applications. The algorithm doesn’t only work with the data itself, but with the context as well.
Although at different ends of the structure axis, those two types of problems are not mutually exclusive, and they have a large intersection area. Every unstructured dataset becomes structured at some point during its processing, while a structured dataset can have unstructured values in it, such as a user analytics report with written user feedback as one of its columns.
The data axes intersect problems at the formatting level and the learning axes cut it at the objective level. A supervised algorithm tries to predict missing information based on existing data. It can be a temporal prediction, such as guessing data in the future, or an atemporal one, such as recovering lost data or generating original data.
The word “supervised” comes from the training step, in which the algorithm is expected to reach a previously defined conclusion set by the data scientist. ChatGPT generating original text, Midjourney generating images, and the weather forecast saying if it’s going to rain tomorrow are all supervised learning problems that a data scientist can work with.
The objective behind an unsupervised learning problem is not to create more data, but to reduce it. By categorizing, clustering, qualifying, or aggregating a large dataset into smaller groups, unsupervised algorithms make sense of what looks like noise. You are not so much interested in getting a new data point but want to understand the full picture of your data instead.
Unsupervised algorithms are very common in marketing, ecommerce, and research. You can use it to group individuals based on purchase power, categorize products by category, or cluster code incidents by criticality. Regardless, what you get out of an unsupervised learning problem is a reduced dataset of the overall larger dataset, losing as little information as possible.
With these four concepts, a data scientist can deliver exponential value to a product. Something that would need an army of analysts or savant-grade code logic to be produced can systematically come out of the models that a data scientist trains and maintains.
We can take the four quadrants of problems that data science can solve and place user problems and business opportunities into them. Let’s experiment and find out how we could explore some common product features with a data scientist with two product examples and one use case: Amazon listing suggestions, Apple Face ID, and digitizing paper files to a database.
Amazon is the forefather of recommendation algorithms, and they built an empire on top of it. Broken into smaller parts, the solution is as simple as clustering assets (products and users) and cross-referencing those two groups to find intersections:
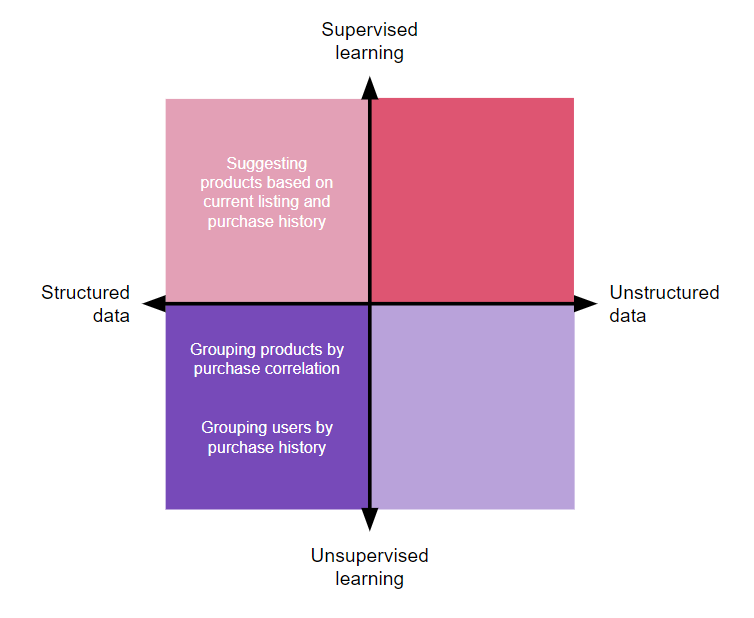
The suggested product has an exponentially higher chance of converting when compared with a simple categorical suggestion, which increases average ticket price and LTV per user (beyond opening a window of opportunity for advertisement).
Security and privacy have grown as perceived product values several times in the last 10 years, and as our lives become more and more digital, fraudsters have become more effective at stealing sensitive data.
Apple did not invent facial recognition technology, but it sure brought it to the place of the gold standard in terms of personal device security with its Face ID:
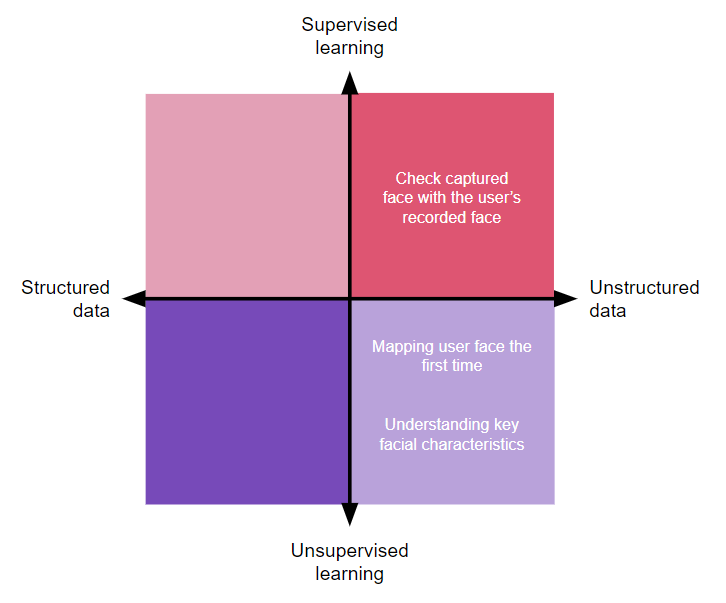
Essentially a computer vision algorithm capable of recognizing faces and comparing them against each other, Face ID is yet another innovation in the long list of Apple technologies that set them apart from the competition. FaceID is frictionless and increases user security without detracting from the simple, intuitive user journey experience.
OCR technology is one of my favorite algorithms — it’s so simple yet so transformative. The ability to read images into text is the leap that allowed so many of our older records to be incorporated into the digital age. What would take an analyst in the 2000s years to convert a document into a record, now, it’s performed almost instantaneously by an image-to-text algorithm:
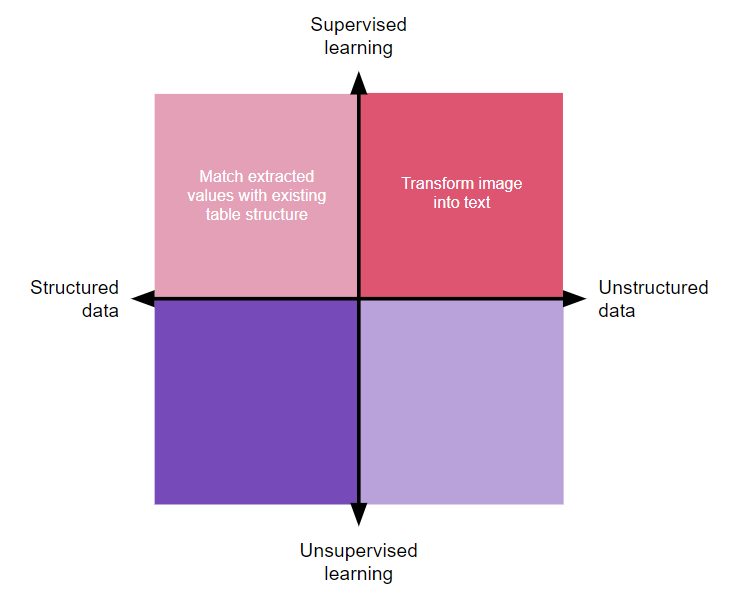
This technology works beyond paper documents. It can also digitize PDFs, do web scraping, print screens, and transform all sorts of digitally native files that are not text-based in their natural state.
As soon as the ChatGPT API came out, some organizations and developers launched PDF readers using the technology. They’d “read” the PDF image and send it to ChatGPT as a message while asking questions. This feature has been incorporated by OpenAI ever since.
Before you freak out, don’t worry — this is not the responsibility of the product manager. Measuring how effective a model is falls 100 percent on the shoulders of the data scientist. Regardless, it’s important you know the basics of the terminology so that you can at least understand what your data science teammate is sharing.
There is a lot of mathematics involved in assessing how good a model is, and you have a handful of methods to do so. This is not an exhaustive list and I’m just scratching the surface. The two concepts I’m sharing are the most common ones you’ll deal with in your product on a daily basis.
To assess how good a model is at predictions or categorization, you must pitch the inferred data against already existing data. During training, you usually use 70–80 percent of your dataset and the remaining part is left out for measuring purposes.
After the model is ready, you use a confusion matrix to see how well your inferences performed compared to reality:

Imagine you are trying to predict if a credit card transaction is fraudulent or not. Your hypothesis can be true or false, and the same goes for the reality of that same transaction. If the model says that the transaction is a fraud (true statement) and it was indeed a fraud, that’s a correct prediction! Similarly, if the model says it was not (false statement) and it wasn’t in fact, the model is right again.
If the model predicted something other than reality, be it true or false, it’s a mistake. That plays against the model’s accuracy score (the share of all answers that were correctly predicted).
Moreover, you can measure the precision and recall of that model. Precision is how much of the total “trues” the model got right, while recall is the opposite — how many “falses” the model got right.
A model can have an OK accuracy with a horrible recall, for example. In the case of assessing if credit card transactions are false, depending on your business objectives, you can tolerate a lower recall rate in favor of precision, which means you’ll lose sales but have less fraud. Alternatively, you could maximize the recall at the expense of precision, meaning you deny fewer transactions but have some more fraud.
AI has no critical thinking, meaning that in the confines of math. It will do its best to comply with the data scientist’s request. That said, sometimes the findings that models generate might not make sense given how loosely related the data points are. Imagine trying to predict the number of subscriptions for the coming month based on the amount of potholes in national highways. That doesn’t make sense, but it’s highly likely that a model will be able to do it if you give those as the only data.
A good way of finding out if the correlations that the model found are relevant is to see its correlation significance:
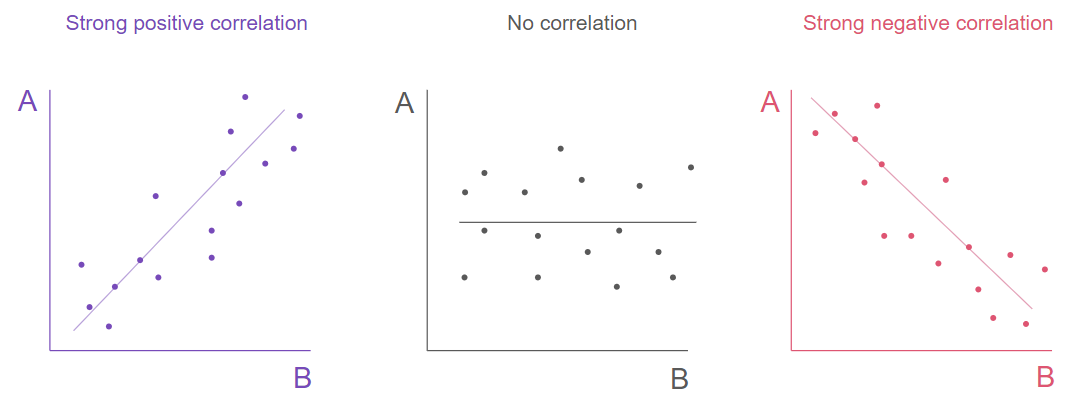
As the number of potholes grew in previous months, you probably see no difference in the number of subscriptions, but marketing expenses or the number of sales calls might show a strong correlation.
That’s why it’s vital to have good data going in a model, and as a product manager who masters the business knowledge inside the squad, you are vital to select said data and help the data scientist to make sense of its model’s results.
The AUC-ROC curve shows how good a model is at classifying a dataset in a binary true or false fashion:
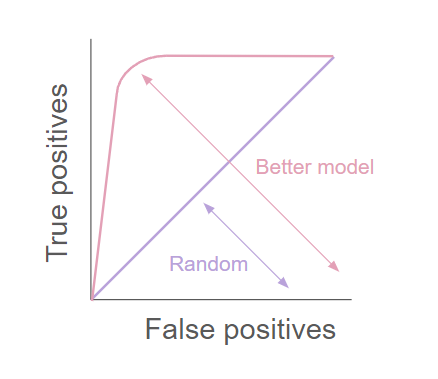
A perfect model would give only true positive responses (from the precision matrix, when prediction meets reality, true or false), but actual models have some degree of false positives (prediction doesn’t meet reality) for the number of true positives they find.
The greater the area under the curve, the better the model is at classifying if a hypothesis is true or not. A proportional line means the model is unable to predict, its output is completely random.
The AUC-ROC curve might be a rare sight for you as a product manager since the data science team will most probably use the confusion matrix we mentioned already, which is way more comprehensive and easy to read. It is, regardless, important to know how to read this graph given that it might show caveats that the precision matrix omits, especially at low accuracies.
This article hardly covers the basics — there is so much more to explore, but it should give you a starting point to further expand your knowledge on the topic. In the same way you don’t have to be code literate to manage a digital product, you also don’t need to be a data scientist to manage a product that heavily uses AI. Knowing enough about it helps a lot, regardless.
We could go to lengths to explore what a data science sprint looks like, how to prioritize data science initiatives, how data science relates to code and deployment, who the usual stakeholders are in a data science context, and much more. The point is, contrary to what I’ve shared above, there is no “right” or “wrong.” Everyone may tackle these items differently.
Data science is a huge part of a lot of products already, and the expectation is that it will become more and more intrinsic to value generation moving forward. Data scientists will, for sure, stick around as new cornerstones of the product trio.
Maybe we should rename it to the “product square” already.

LogRocket identifies friction points in the user experience so you can make informed decisions about product and design changes that must happen to hit your goals.
With LogRocket, you can understand the scope of the issues affecting your product and prioritize the changes that need to be made. LogRocket simplifies workflows by allowing Engineering, Product, UX, and Design teams to work from the same data as you, eliminating any confusion about what needs to be done.
Get your teams on the same page — try LogRocket today.

How AI reshaped product management in 2025 and what PMs must rethink in 2026 to stay effective in a rapidly changing product landscape.

Deepika Manglani, VP of Product at the LA Times, talks about how she’s bringing the 140-year-old institution into the future.

Burnout often starts with good intentions. How product managers can stop being the bottleneck and lead with focus.

Should PMs iterate or reinvent? Learn when small updates work, when bold change is needed, and how Slack and Adobe chose the right path.