While revenue maximization is a critical part of every product development, you shouldn’t neglect the second part of the equation — the costs.
The costs you acquire to generate revenue impact:
In this article, you will learn what the cost of revenue is, the different types of costs, and how you can use this information to make better product decisions.
The cost of revenue refers to the costs accrued to generate revenue from a specific use case. It’s usually split into two groups of cost:
Understanding these costs will help direct your product strategy moving forward.
To better understand the cost of revenue, let’s unpack the two main drivers of cost:
Cost-to-serve includes all the costs you acquire to properly serve one paying customer. These costs scale with the number of customers you serve.
Let’s take Figma as an example. To serve one customer, they need to cover the costs of:
The most common types of cost-to-serve include:
Cost-to-serve allows you to calculate your margins, that is, the total earnings after offsetting the cost:
Margin = revenue – cost-to-serve
If you charge your customers $20 a month for a subscription, and your average cost to serve one customer for a month is $13, then:
Margin =$20 – $13 = $7
This means that you generate a $7 profit with every renewal.
You can also calculate the margin percentage:
Margin percentage = margin/revenue
In our example, it would be:
Margin percentage = 7 / 20 = 35 percent
Here you capture 35 percent of your revenue for further investments.
Cost of acquisition, or customer acquisition cost (CAC) includes costs related to getting a new customer.
Although it’s often simplified to marketing and advertising costs, there’s much more to that.
Let’s take Netflix as an example. The journey to become a paying customer looks like this:
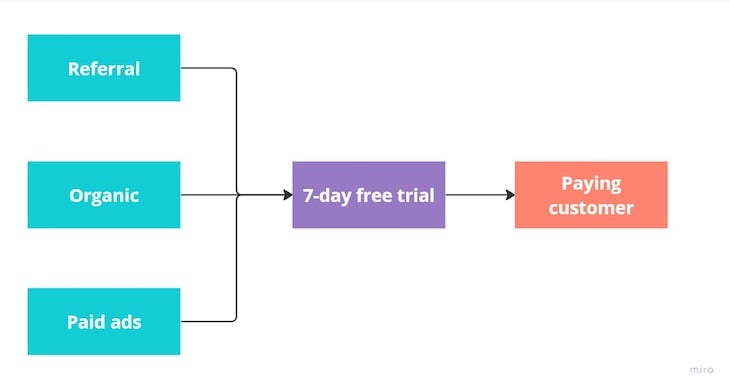
Users first come to the platform from referrals, organic search, or Netflix’s paid ads. Part of Netflix’s growth model involves first serving a free trial for newcomers to get them hooked.
This free trial is also an additional cost that Netflix needs to acquire to obtain paying customers.
So, if the average cost of getting users from ads is $0.50, and the cost to serve the trial for a week is roughly $2. Let’s assume the following scenario:
The actual cost of acquiring this particular customer would be $6:
Acquisition cost = 4 users x $0.5 ad costs + 2 trials x $2 = $2 + $4 = $6
But it’s still only a part of the equation, you can also have these other types of acquisition costs:
Ultimately, while marketing teams often use CAC to calculate their performance marketing costs, when you look at this from the product perspective, it’s often a significantly higher number:
Cost of acquisition = all costs required to get one paying customer
Attributing all these costs to a particular customer is close to impossible, so we often resort to using averages.
For example, if in May you acquired a total of $30,000 in acquisition-related costs, and you got 5,000 new customers, you can assume:
Cost of acquiring one customer = $30,000 / 5,000 = $6
After understanding your customer acquisition costs and cost-to-serve, you can derive your payback period:
Payback period = acquisition cost / (revenue per period – cost-to-serve a period)
For example, say you sell a monthly subscription plan for $30. It costs you roughly $15 to serve the value proposition for each month.
Let’s assume that your conversion funnel looks as follows:
That gives you a $15 cost-to-serve and a $52.5 acquisition cost ($5 for ads + $37.5 to serve trials + $10 for other costs)
Payback period = 52.5 / (30 – 15) = 52.5 / 15 = 3.5
After 3.5 months, you break even, which means you offset all costs related to acquiring the customer and generate your $15 profit margin every month (revenue – cost-to-serve).
Why does this matter, though?
The payback period might be even more of a factor than your profitability and revenue per se.
Let’s visualize that with an example. Say you serve two different use cases to your customers. Each type of customer sticks with you for roughly one year before churning, and you bill them a monthly fee.
It costs you $500 to acquire a customer for use case A and $30 per month serving them. The revenue you get from these customers is $100 a month.
For use case B, you acquire a $200 acquisition cost and $10 monthly cost-to-serve. You charge them $50 a month.
When we look at these use cases from the financial perspective:
Although from a pure revenue perspective, the use case A brings you more money, there’s one caveat.
The revenue-cost structure of use case B allows you to recover your costs two months faster. As a result, you can reinvest in new acquisitions sooner. That’ll mean more new customers, which will also pay back sooner, allowing for yet another round of reinvestment.
Now that we’ve covered what cost-to-serve, acquisition cost and the payback period is, let’s take a look at a few examples of how you can use these data points to make better product decisions:
Just as we covered in our payback period example, analyzing how expensive it is to acquire users and serve specific use cases gives valuable input on profitability and potential growth rate.
Use this input and plan your next steps to reach a desired balance between:
Many decisions you make have consequences on your revenue and cost metrics. Let’s take the most common example — monthly versus annual subscription plans.
Yearly plans usually offer an instant payback period (as you collect all revenue upfront) at the price of reduced total revenue potential (yearly plans are usually discounted). In contrast, monthly plans tend to generate higher total LTV at the cost of longer payback.
Combining that insight with the difference they make on new vs. recurring revenue will help you make well-informed decisions and predict their impact on the long-term revenue structure.
Ultimately, the more nuisance factors you consider when making the decision, the smarter the final decision tends to be.
By segmenting your acquisition costs, cost-to-serve, and payback periods per different acquisition sources, you might be able to identify interesting outliers.
It might turn out that users from your most expensive acquisition source tend to buy long-term subscriptions, thus still offering a quick payback. As counterintuitive as it might sound, that would be a powerful signal to invest heavily in that most expensive channel if you prioritize quick reinvestments to fuel the growth loop.
Similarly, the fact that a specific acquisition channel is cheap doesn’t necessarily mean it’s a good channel. If it takes a year for users to come from that channel to eventually pay back (say, because they chose the least profitable use cases), investing heavily in this cheapest channel might lead to freezing your resources for a long period, which might even kill the whole business.
You can also analyze the cost structures per various user segments, such as segmenting by:
Proper segmentation often reveals surprising insights. There might be a segment of heavy users with incredibly high cost-to-serve. That signals you might rethink your pricing approach or offer a separate, more expensive plan for heavy users.
You might discover a segment that uses a specific feature heavily, but that feature generates high cost-to-serve, which eats all your margins. Maybe you should price additionally for that particular feature to offset the extra cost? Or, if used rarely, maybe you should kill the feature to reduce your overall costs.
If users with a specific profile or from a particular region have significantly lower or higher acquisition costs, you might rethink your acquisition strategy and product direction to focus on attracting low CAC users.
Before you use customer acquisition costs, cost-to-serve, or payback period as input to your decision-making process, ensure you understand how these are defined and how they impact the subsequent analysis. Sometimes you might need to tweak the formula here and there to get the answers you care about.
Whenever someone talks about cost-related metrics, my first question is always, “What’s included and what’s NOT included in our CAC/cost-to-serve definition?” That helps in avoiding painful misunderstandings.
Featured image source: IconScout
LogRocket identifies friction points in the user experience so you can make informed decisions about product and design changes that must happen to hit your goals.
With LogRocket, you can understand the scope of the issues affecting your product and prioritize the changes that need to be made. LogRocket simplifies workflows by allowing Engineering, Product, UX, and Design teams to work from the same data as you, eliminating any confusion about what needs to be done.
Get your teams on the same page — try LogRocket today.

Guard your focus, not just your time. Learn tactics to protect attention, cut noise, and do deep work that actually moves the roadmap.

Rumana Hafesjee talks about the evolving role of the product executive in today’s “great hesitation,” explores reinventing yourself as a leader, the benefits of fractional leadership, and more.

Trey Courtney talks about his process for evaluating partnerships or acquisitions and how he successfully implements these initiatives.

Asma Syeda shares the importance of responsible AI and best practices for companies to ensure their AI technology remains ethical.