Why do you build new features?

If you think it’s to keep your developers busy or so that you have something to show your stakeholders at the sprint review, you should probably stop reading now.
If you call yourself a customer-centric company, your work should have one unwavering destination: creating value for your target customer.
The response I get from most PMs I coach is usually, “Great! But how?”
As the name so eloquently suggests, the focus lies on your users and/or customers and whether they’re getting value from your product.
Below is an overview of common customer outcomes and example metrics you could track to see whether you’re achieving those outcomes. To make the metrics more concrete, imagine Company A, a startup offering a company internal communications tool to be used by HR and team leaders to communicate important information to employees:
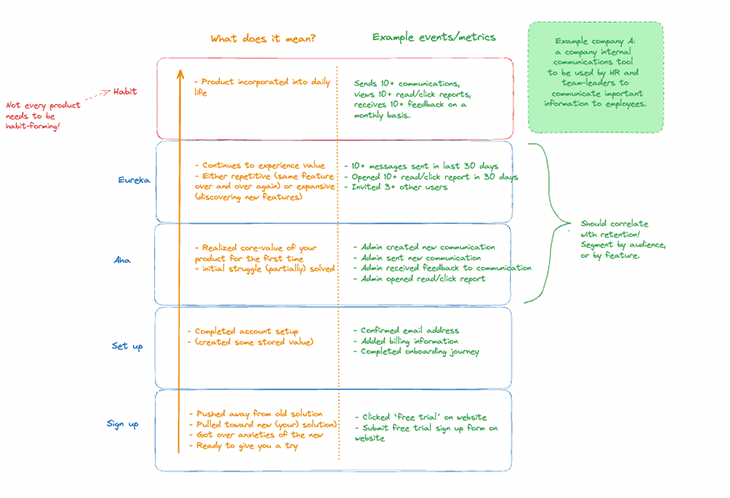
To make things a little more confusing, every different target audience segment (or every actor or persona within your ICP) might have different “aha”, “eureka” and “habit” moments. You can see why a clear focus on one particular segment, ICP, or persona can save you a lot of headaches.
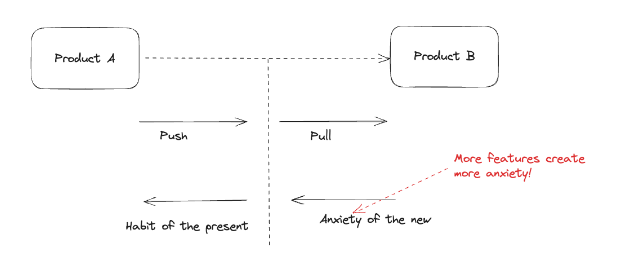
The fact that a user has signed up for your product usually means that a lot has happened in their world:
Example events you could track:
The user has taken the necessary steps to set up their account.
Example events include:
The user realized for the first time how your product can add value to their life and how it can solve their particular challenge. You want to drive your users to this point as quickly and linearly as possible, reducing the time to value (TTV).
This is where things get tricky. What value means and what particular challenge they want to be solved depends entirely on the customer and will differentiate between customer segments. Most products don’t solve for only one job but for three to five conflicting jobs.
Some customers will select your product to get their job done faster, others will select it to do it more thoroughly. If you can’t distinguish between those two, you will fail to guide them to their desired outcome.
I highly recommend adding a quick onboarding survey to your new user flow, simply asking new users what they’re trying to achieve first. This way, you can send them through a personalized walkthrough and help them get what they’re looking for. Yes, this adds friction, but not all friction is bad. This will help you do a better job for that particular user.
When you know what “aha” looks like for your different segments, you can start tracking in a funnel report how many new users are actually getting there. Then, you can start looking for ways to reduce that good old time to value.
Example events include:
The user continues to enjoy the product, for example by re-using the same feature, and/or by slowly discovering more features and value that the product has to offer.
Examples of continued value actions include when:
The usage of your aha and eureka events should correspond strongly with retention. The fact that users are taking the aha or eureka paths should indicate a far stronger likelihood that they will retain over a certain period. If this isn’t the case, you’re probably wrong about which events indicate aha or eureka moments.
You can segment your audience based on whether they have or haven’t taken the aha or eureka paths and compare the retention graph of these audiences to the control group (the target audience that hasn’t achieved aha or eureka). Retention should look worse for the control group, a lot better for your aha segment, and best for your eureka segment.
Another way to go about it is by analyzing each individual feature that is part of your aha moment and seeing how many users who have interacted with that particular feature come back after particular time intervals. For Company A, these features would be communication-sending; feedback; and click/read reports.
This is the moment when users have incorporated your product into their lives. They’ll likely no longer need external pushes to come back but will come back on their own. For Slack, a habit is built once a user has used the product more than 2,000 times in 30 days.
In the case of Company A, a habit for the admin could look like this:
Important note: not every product has to be habit-forming. For some products, cases, or business models it doesn’t make sense for users to incorporate them into their daily lives (for example, selecting a retirement plan, submitting taxes, etc.).
Align upfront within the leadership team how much recurrence is expected, for example by analyzing how often your users are doing their job the old way. Define terms like “active,” and “recurring” together. It’s really not helpful when product, marketing, and sales are using conflicting definitions.
This list of customer outcomes is not exhaustive, and what customer outcomes to expect depends heavily on your business. Other important customer value metrics are:
If there are two things I like, they are focus and alignment. Picking one, or a handful of metrics to focus on across the team or organization (depending on your company size), achieves both. But how do we pick the right one?
Again, a customer value metric is about the customer experiencing value within your product, not about whether you’re experiencing customer or revenue growth as a business. It will likely be the same as the core action in your aha and eureka moments.
Example customer value metrics:
| Company | Value metrics |
| Wistia | Videos uploaded |
| Slack | Messages sent/received |
| PayPal | Revenue generated |
| Company A (company internal communication tool) | Messages read |
I’m personally not as hard-lined as the one-metric-that-matters fans and usually look at several supporting customer value metrics as well.
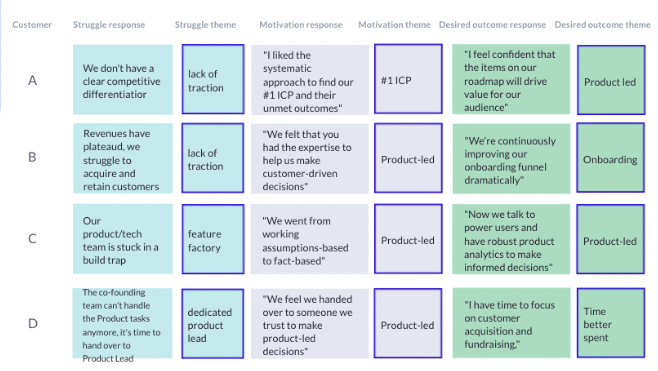
Talk to your customer. Either through qualitative interviews or surveys, you’ll need to chat with your customers to get inside their heads. For those who need some help, here’s a template customer interview guide:
Talk to your CS/sales colleagues. They’ll likely already have deep knowledge about what your customers and prospects are trying to achieve with your product.
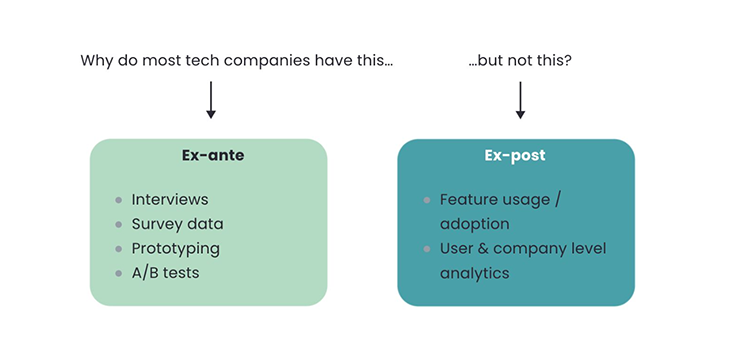
Dig into the data and check for feature adoption metrics. I quite like Regorge’s distinction between:
Although the data is the most objective source of knowledge, beware of two things.
First, data is backward-looking. You can see what people have been doing until now, but not what they will be doing in the future.
Let’s say Company A has been marketing their tool as an internal communications tool for the past 4 years, but just recently added an employee time tracking function, which they haven’t marketed yet. Product analytics data will tell them that the internal communication feature is performing best — this is why people select their product. You can easily see why dropping the time-tracking feature at this point would be the wrong conclusion.
Second, data doesn’t tell you the “why” behind the “what,” and that can be frustrating. This is why we prefer the term “data-informed” over “data-driven,” and should always combine quantitative data with qualitative insights.
Final words of wisdom on the topic of finding your #1 customer value metric: the more simple and less bloated your product, the easier it is to find it. If you’re a startup, and already struggling to zero in on your #1 customer value metric, you might have bigger fish to fry.
Assuming you’ve successfully identified what aha, eureka, and habit moments look like for your target audience segments, ICPs, or personas, and you know which metrics you are trying to move when making changes to your product, we move into the next question:
How to get those pesky customer value metrics to budge?
Let me start by busting a myth: onboarding is not only about getting new users to set up their accounts. Instead, it’s a continued effort throughout a customer lifecycle, focused on showing them initial, retained, and, ideally, even expansive value. It’s about helping them achieve the goal they came for and then showing them all the other stuff you can help them with.
Let’s go back to Company A, our company’s internal communications tool which just added an employee time-tracking feature. Even with only two core features, the product is solving for a myriad of jobs:
Communication tool:
Time tracking:
The more features you add, the more jobs you solve for, and the more complicated you make things for your customers. Adding many features is usually a sign of not knowing what your customers are coming for. You end up increasing the level of anxiety associated with switching to your product.
If done right, the company has distilled these jobs by combining qualitative and quantitative customer insights. If done poorly, this list is the result of the imagination of the loudest person in the room.
Or, if you have no idea of knowing which main job a new user is trying to accomplish, why not just ask? I’m a big fan of short onboarding surveys before dropping anyone into your tool.
Miro — a PLG superstar — does an outstanding job at this. They start by asking profiling questions to segment their audience (‘What’s your role? What kind of work do you do?” and end by simply asking, “Where would you like to start?”
You now have three core ingredients to a great onboarding experience and improving your value metrics:
Common ways to guide users through your product are:
Eating your own dog food is not optional. Check out this section of my previous article on detecting low-hanging fruits to learn more.
This goes without saying, but not all friction is bad. In the previous paragraph, I advocated heavily for adding friction through an onboarding survey. It’s imperative to measure whether your onboarding survey isn’t harming your metrics more than improving them.
So you think your idea is a slam-dunk, and you’re totally confident it will create customer value and improve your value metrics. You’re probably wrong. 80 percent of new features are hardly or never used!
Getting real-world feedback as cheaply and quickly as possible is key. You can do this with fake door marketing tests (adding users to a waitlist), feature stubs, or by doing usability testing with a prototype. For a list of validation methods, check out my discovery and validation guide here.
Rule of thumb: if it’s not possible to test your idea in a lightweight way, toss it in the bin.
Make sure not to forget to monitor whether your new features are living up to your expectations in the real world:
It can be difficult to attribute changes in metrics to changes to the product. Imagine you’ve rolled out a new feature to your product. At the same time, your marketing department is running a special summer-deal campaign, and a new rockstar head of sales has revamped the sales strategy.
Besides all those internal factors, there are also external factors to consider: maybe a new competitor has entered the market, there’s an economic downturn, or your business is seasonal. If you now see an uptake or decrease in new revenue, it’s not easy to confidently say “That’s all because of my feature!” Differentiating between causation and correlation is hard. Luckily there are analytics tools that help you get this right, such as Loops AI.
Just because it’s difficult, doesn’t mean you shouldn’t do it.
Featured image source: IconScout

LogRocket identifies friction points in the user experience so you can make informed decisions about product and design changes that must happen to hit your goals.
With LogRocket, you can understand the scope of the issues affecting your product and prioritize the changes that need to be made. LogRocket simplifies workflows by allowing Engineering, Product, UX, and Design teams to work from the same data as you, eliminating any confusion about what needs to be done.
Get your teams on the same page — try LogRocket today.
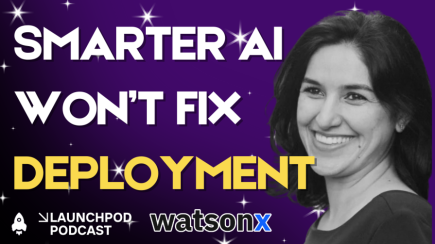
Maryam Ashoori, VP of Product and Engineering at IBM’s Watsonx platform, talks about the messy reality of enterprise AI deployment.
A product manager’s guide to deciding when automation is enough, when AI adds value, and how to make the tradeoffs intentionally.

How AI reshaped product management in 2025 and what PMs must rethink in 2026 to stay effective in a rapidly changing product landscape.

Deepika Manglani, VP of Product at the LA Times, talks about how she’s bringing the 140-year-old institution into the future.