As the PM on LogRocket’s Issues team, I was recently doing data research into a specific feature of Issues: triaging.

Triaging issues is one way we monitor user engagement with Issues. However, the fundamental feature hasn’t changed in years. We’ve recently had ideas for how we could improve triaging to bring more value to users while also reducing confusion, as new users can be confused by these statuses.
Though it was tempting to jump right into product enhancements, we needed to ask ourselves, “What do we want to know that would be valuable to make product decisions?”
Well, it all starts with good research.
In my experience, I’ve encountered a handful of pitfalls when doing user data research that can preclude you from drawing accurate conclusions. In this article, I’ll walk through a story about my recent experience doing research for our triaging feature and how it helped us figure out what to do next.
To follow this story, the only things you need to know about LogRocket’s Issues are:
One big mistake I see teams make is jumping straight into making product improvements instead of starting with one or more key questions.
On LogRocket’s Issues team, we raised three instructive questions to kick off our research:
Let’s go step by step. First, we grabbed a snapshot of how our customers are triaging each issue type:
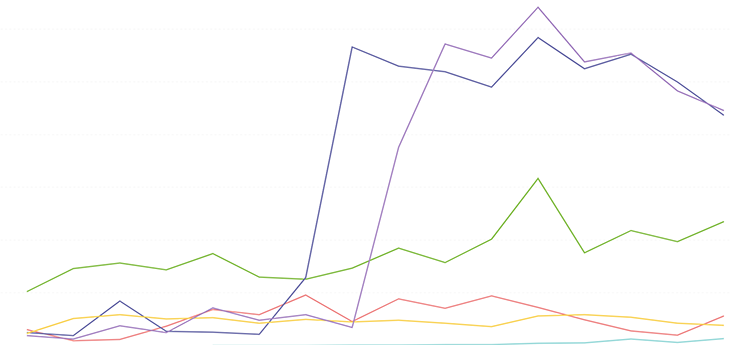
Simple enough, right? Wrong! And you get a hint from two of the issue types spiking out of the blue when we haven’t had any big marketing pushes or product changes for those issue types. So why is this happening?
I have a few ideas, but after some investigation, it turns out we have sandbox data intermingled here, so let’s remove those data points. In LogRocket, users can create “sandbox” apps to explore the full extent of the platform without needing a Pro account or even needing to install the SDK:
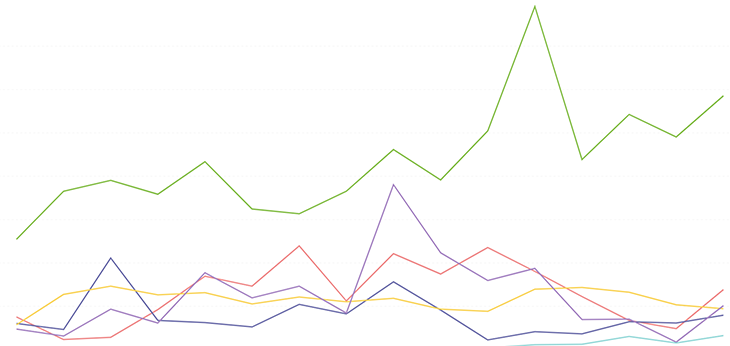
That already looks drastically different. But wait, there’s more!
Per our original question, we want to know about a certain level of paid customers that we call “Pro.” This leads us to another pitfall PMs often have: not analyzing behavior relative to different user types.
In this case, we have a Team plan that’s cheaper than Pro, but the biggest Issues feature unlocks with Pro. Specifically, our AI and all issue types are available on Pro, so we’re going to scope the data to Pro customers.
This is a great example to show that sometimes you’re going to focus on drawing the line between certain features, not just paid versus unpaid.
OK, so we grab a snapshot of how our Pro customers are triaging each issue type:
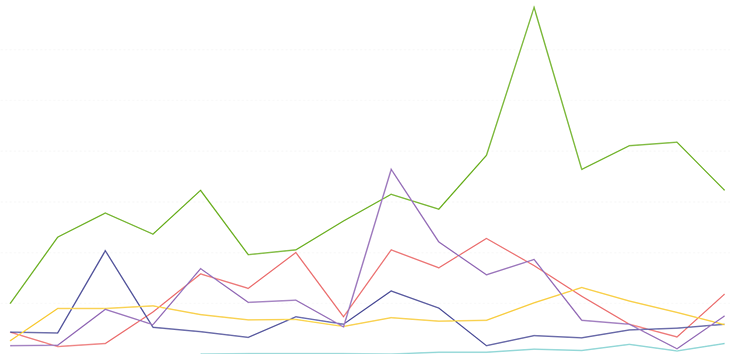
This graph had fewer visual changes, but the shape of the green line (which represents JavaScript errors, if you’re interested) does change a bit, and the total count has dropped — as we’d expect from removing all non-Pro customers.
We can now answer the first question — “How many Pro customers are actively using issues over the past three months?” — because we’ve narrowed down the activity to certain account types and behaviors.
The second question is, “What’s the distribution of how these active customers triage issues per issue types and statuses?” Are we ready to answer it?
This is the distribution of issue triaging among customers, with the gray section being “all the rest” of customers:
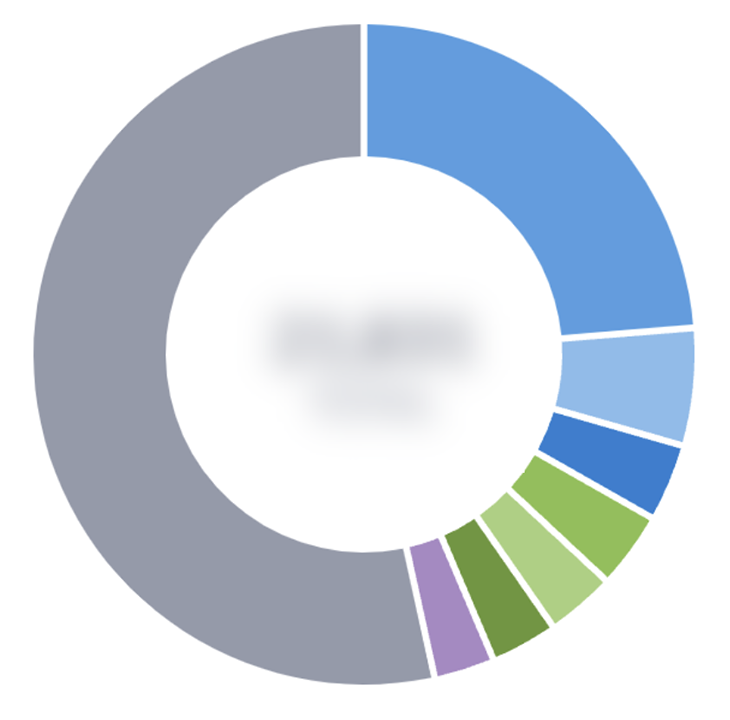
Looks like about a quarter of issue triaging actions happen by a single customer! Additionally, the next six most-triaging customers account for almost another quarter of the activity. Excellent segue to the next point — if we’re trying to answer questions about the distribution of customer activity, we need to make sure we don’t have outliers distorting the data.
If we didn’t double-check on this, we’d assume we’d average these triaging numbers over the whole customer base and, as a result, think our average issues triaged per customer is much higher than it really is.
So, now I have a new question: Why are these handful of customers using triaging so much more than other users? The data we’d collect and what we’d learn from this small cohort of super-user customers are likely very different from the takeaways of the rest of our customers. So it’s critical to identify your super users via usage cohorts and analyze the cohorts separately.
For now, we’re going to put the super-user customer cohort aside — removing those customers from the data and working just with the rest of the Pro users.
So the issue triage data we’ve narrowed down now to could be described as:
The third and final question I posed is, “Are there outliers in the way users are triaging certain issue types or using certain issue statuses?” Here’s another pitfall: not considering different vectors of seemingly simple stats.
This is a case where we’re looking for more depth in the data and are curious if there could be big differences when comparing vectors of data.
For example, “How many users triage issues?” is a question we’ve already answered. We’ll likely learn a lot more from “How many users triage issues of each type and to each severity level?”
To do this, I created a matrix and crunched some numbers:
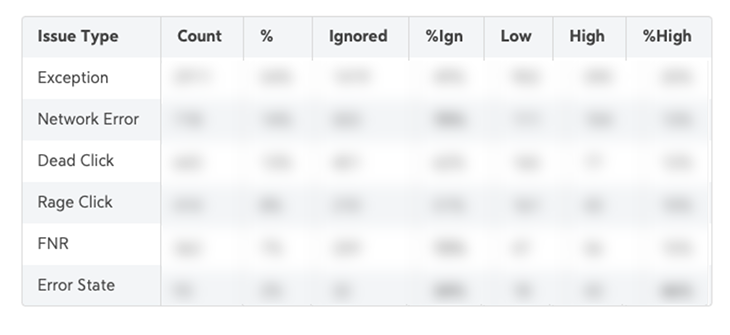
The next step is to review these numbers and look for standouts. What surprises you from this list? Bold those numbers and come back and prepare for the next step: drawing hypotheses for exceptional data.
This pitfall means you can only answer four of the five Ws — “who,” “what,” “when,” and “where” — with certainty. But at the end of the day, the most valuable questions are in the “why.”
For example, “Why do users mark dead clicks as high impact statistically more than rage clicks?”
The exceptional data points help us create hypotheses. Those hypotheses can be used to create questions that we can then answer in user interviews, user testing, or even via watching session replay (LogRocket!).
Finally, don’t forget to document your findings and share them with colleagues for feedback.
Like any research, learnings should grow on each other. Research is collaborative. Colleagues will see things you didn’t see and help you ask better questions and draw better hypotheses.
Also, data changes over time. Knowing the context you took the data from that created certain hypotheses helps relate these findings and hypotheses in the future.
User research is a pretty critical part of any PM’s job, and I hope this experience from my role as a PM on LogRocket Issues was helpful.
As a review, the seven pitfalls of user data research are:
Thanks for reading!
Featured image source: IconScout
LogRocket identifies friction points in the user experience so you can make informed decisions about product and design changes that must happen to hit your goals.
With LogRocket, you can understand the scope of the issues affecting your product and prioritize the changes that need to be made. LogRocket simplifies workflows by allowing Engineering, Product, UX, and Design teams to work from the same data as you, eliminating any confusion about what needs to be done.
Get your teams on the same page — try LogRocket today.

CPO and PhD Jen Wang covers “The Zone of Absorption” and why product teams are struggling to build when AI is shifting faster than anyone can keep up.

Explore four product team structures, when each works best, and how to choose the right model for speed, ownership, and clarity.

Learn how code-style reasoning helps product managers make sharper decisions, surface edge cases, and write clearer requirements.
A practical framework for product leaders to prioritize better, reduce noise, and focus teams on what matters most.


