Most web developers are familiar with the basic features of the chrome developer tools — the DOM inspector, styles panel, and JavaScript console — however, there are a number of lesser-known features that can dramatically improve a debugging or creation workflow.
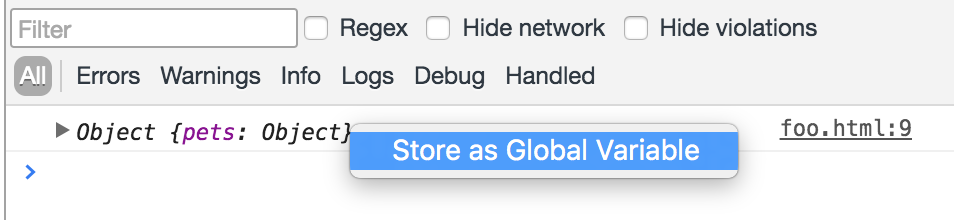
Inspecting complicated objects that are logged to the console can sometimes be tricky if they have many keys, or contain values that are hard to parse manually. Luckily, Chrome makes it easy to inspect such objects with JavaScript.
To do so, right click on an object in the console and press “store as global variable” . This stores the object as a global variable called temp1 which you can then work with using JavaScript.
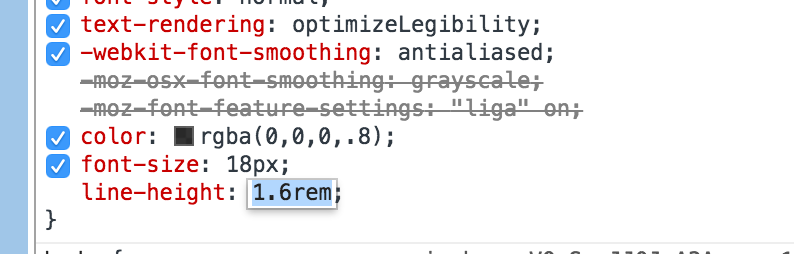
When debugging CSS, you can select a property and use the up/down keys to tweak it’s value. By default, the arrow keys adjust values by +/- 1. However, by holding the alt key, you can use the arrow keys to adjust values finely in steps of 0.1, which is particularly useful when working with fractional values.
Conversely, you can hold shift to adjust values in steps of 10.
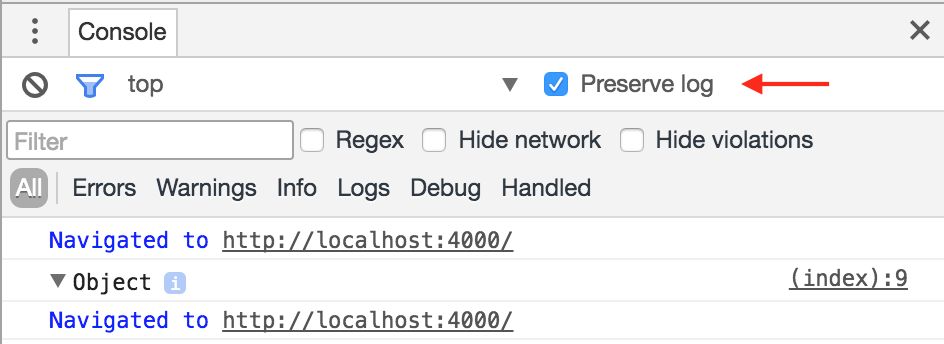
Preserve log is a checkbox that lets you persist logs between page refreshes. This is useful when debugging website issues that require you to refresh the page, since all console output is otherwise cleared. When this option is enabled, a new type of “Navigation” log appears in the console to show page refreshes or navigation events to different pages.
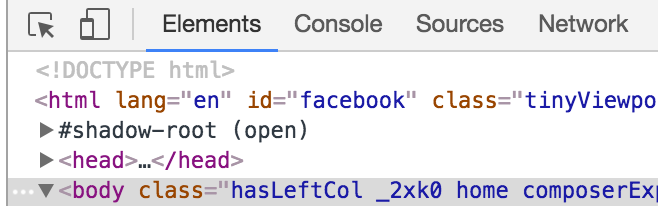
In part one of this series, I discussed selection mode, which is activated by pressing the icon in the upper-left corner of the DOM inspector. This lets you visually select elements on the page to inspect by hovering over them with your mouse.
I recently learned that by holding shift, you can go “through” the topmost element in a stack, and select deeper elements. This is helpful for complicated sections of DOM, or a page with some type of overlay that covers other elements.
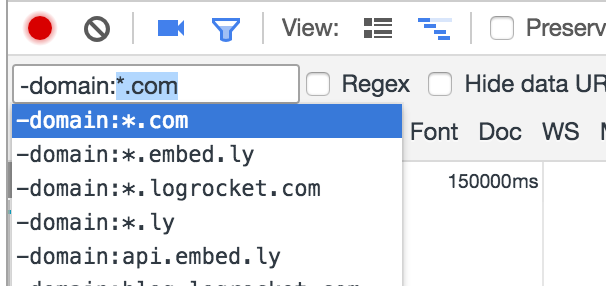
When debugging an app that has a lot of network requests or console logs, it can be useful to filter for particular types of events. Chrome has a filtering language that supports many different properties, as well as operators like * to do wildcard matches.
If you type “-”, Chrome will expose a typeahead that shows the various properties you can filter for. You can also toggle on “regex” mode to do a regex match on the data shown in each row.
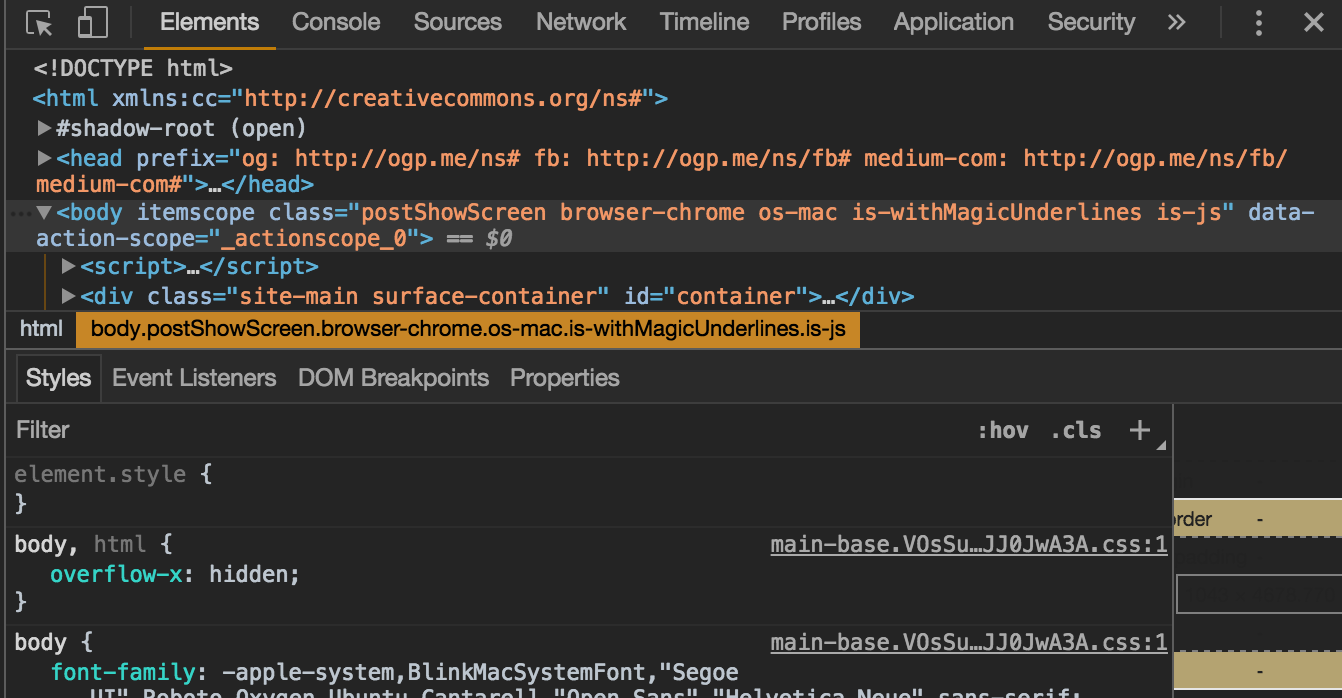
Chrome comes with a built-in dark theme for the dev tools. You can enable it by clicking the three dots icon in the upper right of the dev tools pane, clicking “settings”, and then toggling the theme.
The Replay is a weekly newsletter for dev and engineering leaders.
Delivered once a week, it's your curated guide to the most important conversations around frontend dev, emerging AI tools, and the state of modern software.
I sometimes find this easier on my eyes, and, obviously, it looks much cooler 🙂
The Chrome dev tools only work if you’re running your app on your own machine. If you’re interested in understanding bugs and performance issues that users see in production, try LogRocket.
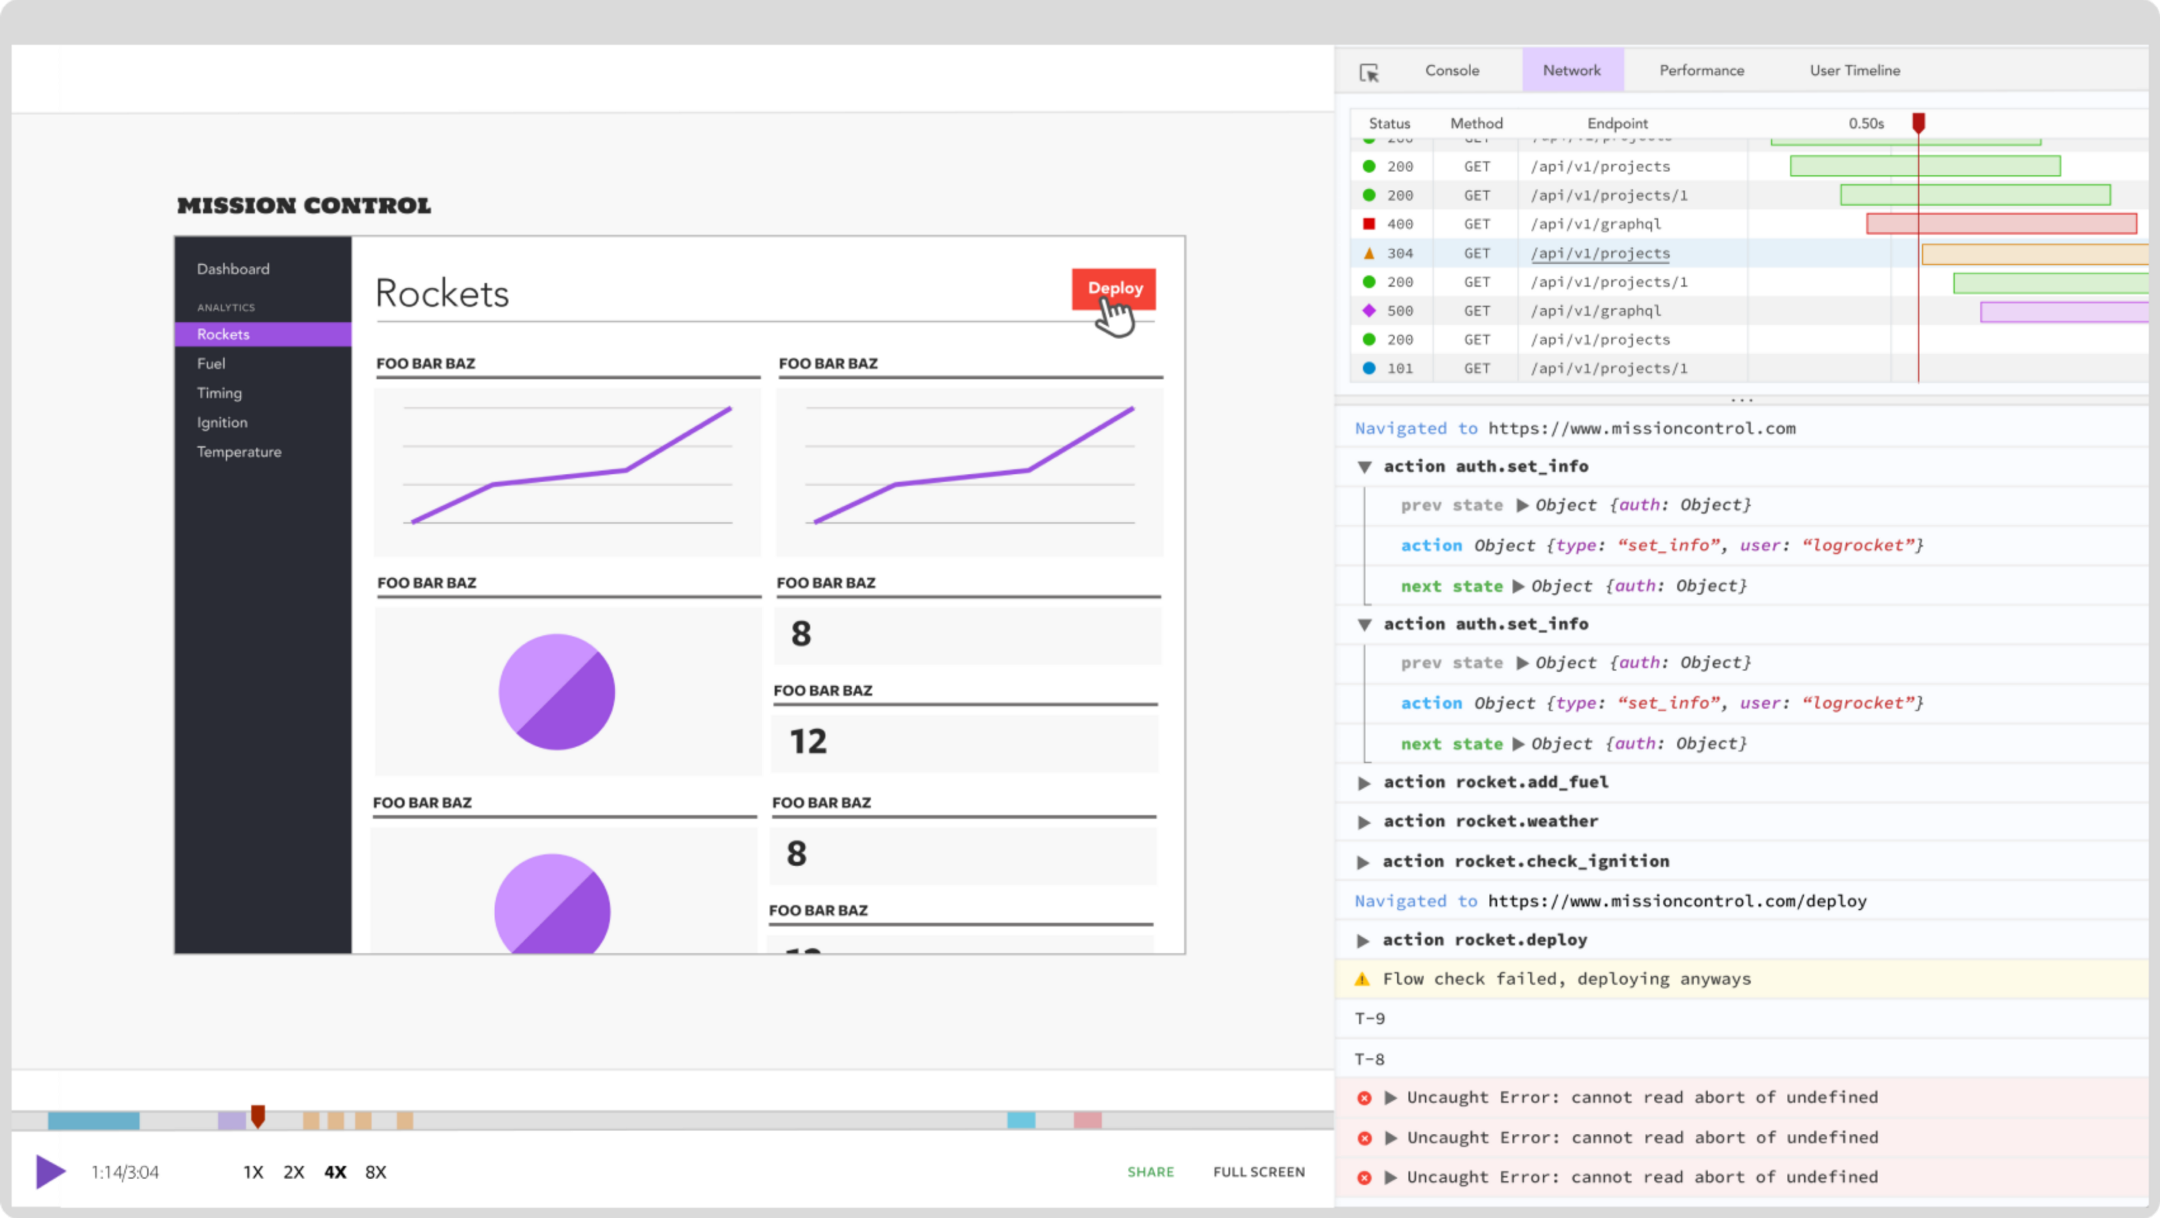
LogRocket is a front-end logging tool that lets you replay problems as if they happened in your own browser. Instead of guessing why errors happen, or asking users for screenshots and log dumps, LogRocket lets you replay the session to quickly understand what went wrong. It works perfectly with any app, regardless of framework, and has plugins to log additional context from React, Angular, and Vue.js.
LogRocket instruments your app to record console logs, network requests/responses with headers + bodies, browser metadata, Redux actions/state, and performance timings. It also records the HTML and CSS on the page, recreating pixel-perfect videos of even the most complex single-page apps.
You can check out LogRocket here.
Session Replay | Product Analytics | Error Tracking
LogRocket helps you understand problems affecting your users, so that you can get back to building great software.

A real-world debugging session using Claude to solve a tricky Next.js UI bug, exploring how AI helps, where it struggles, and what actually fixed the issue.
CSS wasn’t built for dynamic UIs. Pretext flips the model by measuring text before rendering, enabling accurate layouts, faster performance, and better control in React apps.

Why do real-time frontends break at scale? Learn how event-driven patterns reduce drift, race conditions, and inconsistent UI state.

Test out Auth.js, Clerk, WorkOS, and Better Auth in Next.js 16 to see which auth library fits your app in 2026.
Would you be interested in joining LogRocket's developer community?
Join LogRocket’s Content Advisory Board. You’ll help inform the type of content we create and get access to exclusive meetups, social accreditation, and swag.
Sign up now
