
Bugs make our users unhappy and slow the development of our products down. The front end of our product is arguably more volatile than the backend so perhaps more at risk of bugs. So, how can we limit the front-end bugs we introduce into our products?
Linting is the process of finding problematic patterns or code that doesn’t adhere to certain style guidelines. The linting rules can be run automatically by our code editor as the code is being written as well as part of our CI process. So, it helps enforce high-quality readable code as it is being produced.
Linting tools exist in many programming languages including JavaScript. In fact, there are a few linters in the JavaScript world but the most popular one at the moment is ESLint.
ESLint comes with a lot of rules applicable to modern JavaScript code. We can configure which rules are on and off or just give us a warning instead of failing the build, in a .eslintrc JSON file. We can also just choose to adopt a set of recommended rules from the community, rather than figuring out our own set of rules to use.
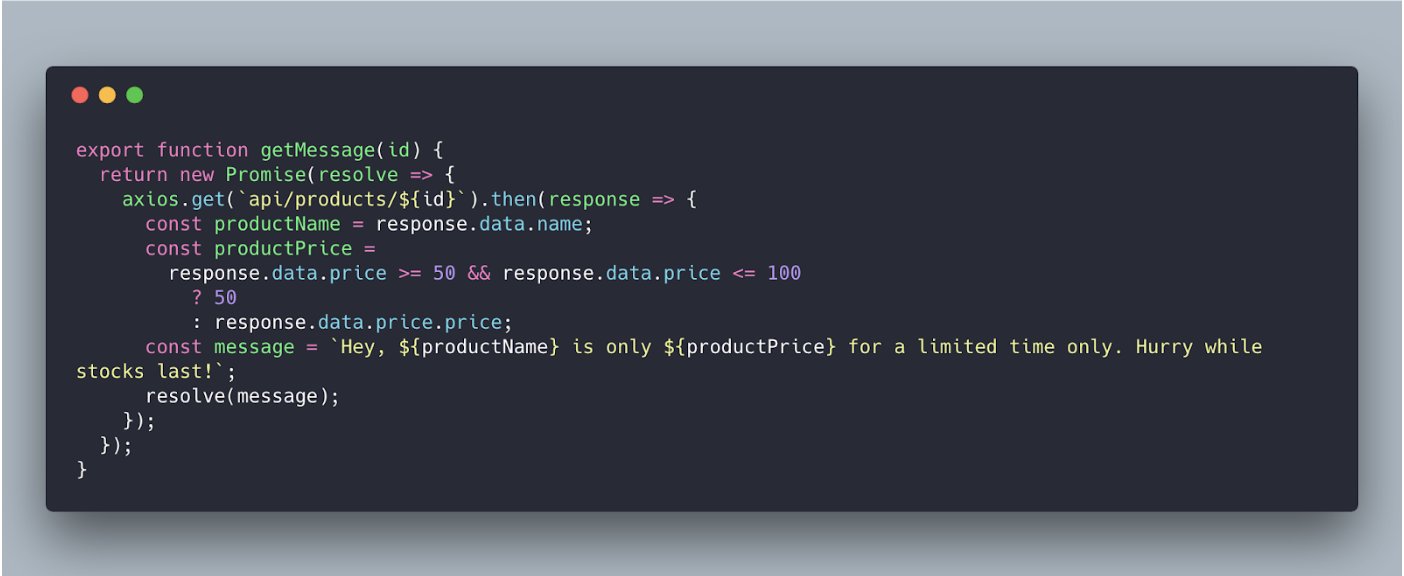
Can you spot the bug in the following code?
ESLint is super easy to install via npm and there are plugins for lots of editors that clearly highlight the problems that the linter has caught. Look at how clearly we can see the issues in the problematic code in VS Code with the ESLint extension below:
That’s right, there was more than one issue!
If we are writing our front-end code in TypeScript then TSLint is a great linter we can use to enforce our style guide. Its capabilities are very similar to ESLint — rule configuration, prebuilt rulesets and a great VS Code extension.
Linting is fairly straightforward to implement in any front-end project and will return significant benefits. So, well worth giving a try.
Couldn’t some of the styling issues that the linter finds be automatically corrected? For example, could a tool automatically add missing semicolons? Yes! This is where code formatting comes in. Have a look at the following code:
This isn’t the easiest piece of code to read in a code review. Does the code contain a bug?
Prettier is a code formatting tool that we can use to automatically format our code when checked into source code. Editor extensions, like the Prettier extension in VS Code, also allow the code to be automatically formatted when we save it.
So, just by saving the code file in VS Code, we can turn the code into something much more readable:
Code formatting is super easy to implement, works nicely alongside a linter and allows us to spot bugs in our code more easily.
Static types also allow us to catch problems very early as we are writing our code. Can you spot the error in the Javascript function below?
There is a bug where we reference the response object that a linter won’t catch and it is difficult for us to spot unless we are very familiar with the particular web API that is being called. What if we were able to define the response object type? Then a compiler could check that we have referenced the response object correctly. Well, this is what TypeScript allows us to do!
Now if we add a type for the response object, can you spot the problem?
The editor in the above screenshot is VS Code which has great TypeScript support, highlighting the bug as soon as it can with a very informative error message.

The Replay is a weekly newsletter for dev and engineering leaders.
Delivered once a week, it's your curated guide to the most important conversations around frontend dev, emerging AI tools, and the state of modern software.
TypeScript layers a static type system on top of JavaScript and is hugely popular at the moment. In fact, vue 3.x is being written using typescript.
The TypeScript compiler is highly configurable, so, whether we are working on a greenfield or brownfield project, we can add TypeScript into the mix and start to catch bugs earlier.
Linting, code formatting and static type checking don’t require a lot of effort to add to our projects. Automated tests, on the other hand, do take a fair amount of effort but they can catch more sophisticated bugs so it is well worth the effort.
Jest is a great unit testing tool that we can use to test JavaScript functions as well as our front-end components. It is very popular for testing React apps. It has useful mocking capabilities and gives us informative error messages when our tests fail:
When writing unit tests, it is useful to know what areas of code aren’t covered by code. With Jest all you need to do is add the--coverage option to get a great code coverage report:
We can then use this knowledge to help plan future unit tests we need to write.
Unit tests give us confidence that isolated bits of our app are working and continue to work as our app develops. However, they don’t give us a great deal of confidence that key storylines through the app will continue to function correctly as our app develops. This is where end to end tests (ETE) come in. Cypress is a great ETE testing tool that allows us to build our tests in JavaScript. Cypress really shines when debugging a failing test because the tests run inside the browser which means we have all of the capabilities of Chrome DevTools at our disposal.
As well as giving us confidence that key storylines in our app continue to work, ETE tests are often easier to add to an existing codebase because they are decoupled from the code. ETE tests can also quickly cover areas of our app. ETE tests are more brittle though because they are dependent on all of the layers of the app — a little change to the data that the app is based on can cause an avalanche of failing tests without catching a real bug.
So, the cost is higher, but a nice combination of robust unit and ETE tests can help regressions that linting and type checking don’t catch.
Another way to reduce bugs in our code is to reduce the size of our codebase and leverage other people’s battle-hardened code. Leveraging a framework like React, Vue or Angular will save a ton of code and more importantly a ton of bugs. These three frameworks all have thriving ecosystems and great robust libraries to go with them for things like state management and beautiful UI components.
We have to be careful though, pulling in lots of dependencies can bloat our codebase and leave us with a really challenging bug to fix — performance! This leads us on nicely to preventing performance issues …
As we develop our app, we can use the great DevTools in Chrome to help keep a close eye of performance.
Firstly we can use Network panel to look at HTTP requests. Are there large payloads? Is a particular resource getting called too frequently? Large web requests or chatty web APIs can cause the performance of our app to suffer. DevTools even lets us simulate our app running on a slow network that can really highlight these kinds of performance issues.
There is actually a specific panel in DevTools for profiling performance in the Performance panel. We can record a period of app usage to get a timeline of performance-related information that helps us spot and determine where performance bottlenecks are. It’s well worth profiling the area of the app you are working on to check that performance hasn’t regressed.
Performance problems can be costly to resolve because it often involves refactoring code. So, it is well worth using the tools above regularly to catch these problems early.
Have a look at the code below:
The function takes in an object and returns the same object with the string property values converted to lowercase. Can you spot the potential problem with the code?
Well, the root problem is that the function mutates the argument that is passed into it. Another part of the code may depend on the object that was passed in its original state. These are subtle bugs and costly to pin down and fix.
A pure function version of this is shown here:
The function is pure because it will always return the same value for a given argument and doesn’t produce any side effects like mutating the argument. Not mutating the arguments means that the function can’t cause bugs in other areas of our code.
The second version of our function uses the array reduce function to create a new object without mutating the original object. Other useful non-mutating array functions are:
concat— for adding array itemsfilter— for removing array itemsmap — for changing array itemsA common requirement is to support all major browsers. If we are in this camp and are using a feature we haven’t used before, we can check its browser support at caniuse.com. There’s nothing worse than writing a cool bit of code and later realising it isn’t supported in IE!
Along with making sure the features we are using are compatible with the browsers we need to support, we can do spot checks in the different browsers as we develop our app. Tools like BrowserStack make checking our app in different browsers super easy.
We can do all of this great stuff whilst developing our app but bugs may still get into production. Wouldn’t it be great if we could catch the errors that happen in production and resolve these before our users report these? This is where error reporting tools come in to play. There are lots of great tools to choose from (including LogRocket).
So, there we have it, lots of ways we can reduce bugs in our front-end code. Some of them are quick wins like code formatting and linting and some of them are more significant investments like automated testing.
Limiting bugs and catching bugs early means happier users and more time creating cool features!

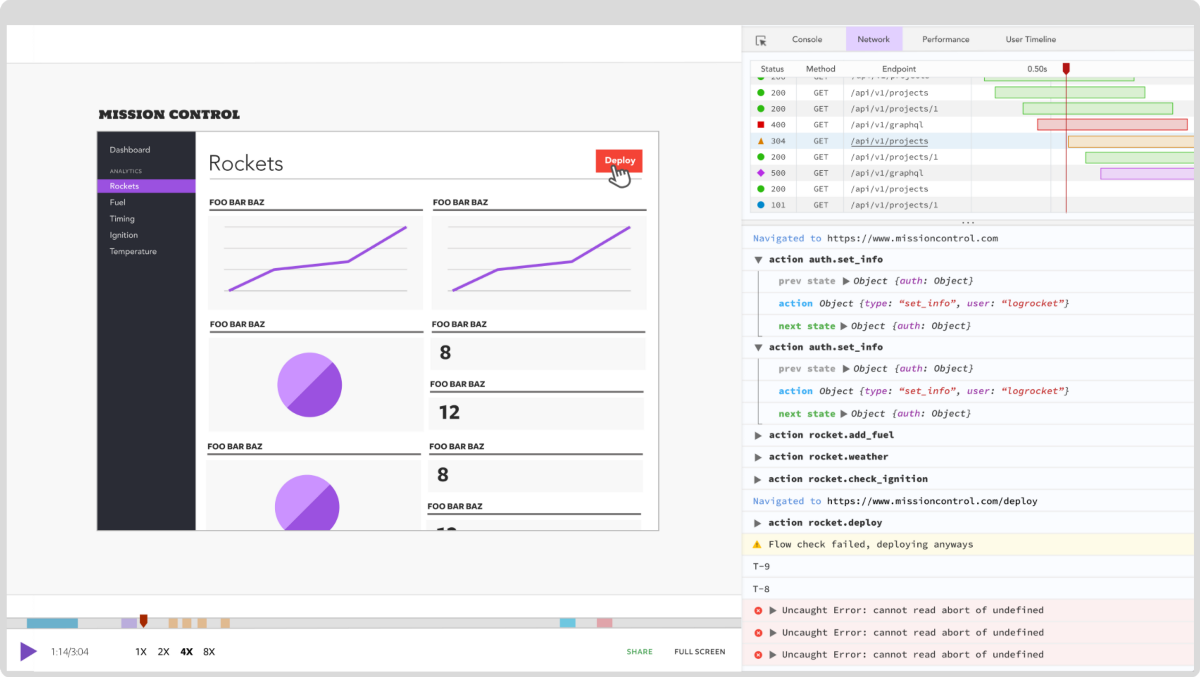
LogRocket lets you replay user sessions, eliminating guesswork by showing exactly what users experienced. It captures console logs, errors, network requests, and pixel-perfect DOM recordings — compatible with all frameworks, and with plugins to log additional context from Redux, Vuex, and @ngrx/store.
With Galileo AI, you can instantly identify and explain user struggles with automated monitoring of your entire product experience.
Modernize how you understand your web and mobile apps — start monitoring for free.

When should you move API logic out of Next.js? Learn when Route Handlers stop scaling and how ElysiaJS helps.

Explore how Dokploy streamlines app deployment with Docker, automated builds, and simpler infrastructure compared to traditional CI/CD workflows.

A side-by-side look at Astro and Next.js for content-heavy sites, breaking down performance, JavaScript payload, and when each framework actually makes sense.

AI-generated tests can speed up React testing, but they also create hidden risks. Here’s what broke in a real app.re
Hey there, want to help make our blog better?
Join LogRocket’s Content Advisory Board. You’ll help inform the type of content we create and get access to exclusive meetups, social accreditation, and swag.
Sign up now