
If you’re a developer, you know how painful and time-consuming it is to debug an app in a remote environment. The typical process of debugging a remote app includes build and deployment, the use of remote debugging tools to identify the issue, implementing a fix, and iterating through the process again.
Sidekick, a live app debugger, is designed to solve this issue. It provides the ability to debug in remote environments as if they were local environments. The official documentation declares Sidekick “like Chrome Dev Tools for your backend.”
Sidekick recently released an open source version that allows developers to self-host and includes all the live debugging features provided by the commercial version. We will focus on the open source version in this article.
Jump ahead:
The Replay is a weekly newsletter for dev and engineering leaders.
Delivered once a week, it's your curated guide to the most important conversations around frontend dev, emerging AI tools, and the state of modern software.
As more and more apps move to the cloud, existing debugging tools and techniques are becoming inadequate. Before we dive into Sidekick, let’s have a look at the traditional techniques to debug a remote app and how they fall short.
Using traditional remote debugging tools, developers debug a program while it runs on a remote environment via a port open for debugger. Many tools or platforms provide remote debugging features. For example, you can use Visual Studio Code to remote debug .NET applications by connecting Visual Studio to the remote server. However, the remote server will be blocked once the remote debugging hits a debug breakpoint.
Pausing the running service in debugging is disruptive for other users in a non-production environment. It’s normally not allowed in a production environment for obvious reasons. Another issue is the security concern of the open port required.
In contrast to the traditional remote debugging tools, Sidekick allows developers to set a non-intrusive breakpoint. Sidekick conveys the point locations to the Sidekick agent. When the code executes, the agent takes a snapshot of the application state — including the call stack and variables — without stopping the application. Thus, developers can debug the code without pausing the application.
At the time of writing, Sidekick works for the Java, Python, and Node.js runtimes. Developers can use either the Sidekick Web IDE, VSCode, or IntelliJ IDEA to set the tracepoint or logpoint.
Sidekick consists of three layers: the broker, agents, and clients.
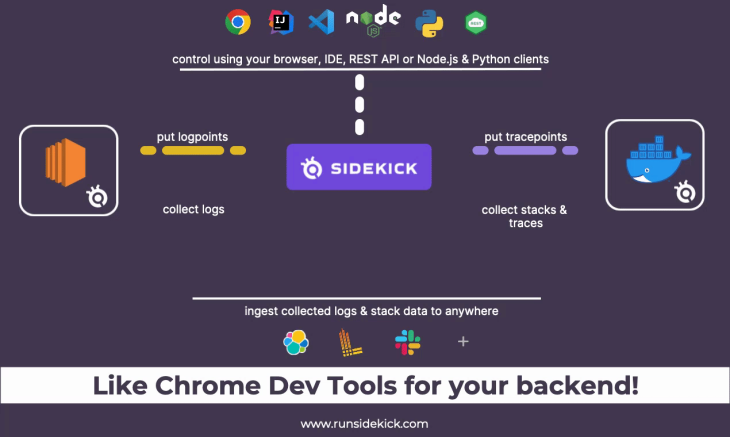
As shown in the above image, the Sidekick broker controls the communication between clients and agents. Agents comprise the layer that collects snapshot data and generates dynamic logs. It is deployed together with the application to be debugged.
Agents also receive commands from the broker. When the code hits a logpoint or tracepoint, it collects data and sends it back to the clients via the broker.
Clients are the interface that allow a user to interact with agents. It is provided as either the Sidekick IDE, an IDE extension, or a Sidekick REST API. For Sidekick open source, only the IDE extensions and REST API are available.
At this time, the IDE extensions are available for VSCode and IntelliJ IDEA.
The REST API lets you apply CRUD operations over logpoints and tracepoints via the HTTP protocol. It opens up a headless way to control the agents programmatically and make use of your collected data using code.
The core features of Sidekick are the tracepoint and logpoint.
The tracepoint is a non-breaking remote breakpoint. Compared with ordinary breakpoints, a tracepoint doesn’t pause code execution, but takes a snapshot of the variables and the call stack when the code hits that line.
It is called a tracepoint instead of a breakpoint because it’s integrated with Thundra’s distributed tracing technology. It’s this tracing technology that enables the connection between several tracepoints in the same transaction.
A logpoint allows developers to add log expressions to a running app. Logpoints can be added dynamically without changing the source code.
Logpoints open the way for on-demand logging to Sidekick users. Replacing traditional logging with dynamic logging has the potential to lower stage sizes, costs, and save time for log searching, redeploying, or restarting the app.
Sidekick has enforced security on multiple levels.
Let’s walk through the process of configuring Sidekick open source and its quick start Node.js project using the provided Docker image.
Since the Docker image is used to install Sidekick for self-hosting, we need to make sure the Docker daemon is running.
To install Docker in your preferred OS, refer to the official documentation.
Firstly, we need to clone the Sidekick repo:
git clone https://github.com/runsidekick/sidekick.git
Navigate to the [Project Root]/sidekick/docker, and run the following command:
Docker-compose up -d
The above command will setup the following local instances:
sidekick-db: A MySQL database for Sidekicksidekick-api: Sidekick REST APIsidekick-broker: The broker that manages the data flow between client and agentsNow we can open the quick start application folder in VSCode. Select Extensions from the left menu, and search for and install the Sidekick extension for VSCode.
After the installation is completed, the Sidekick extension icon will be shown at the bottom of the left menu.
![]()
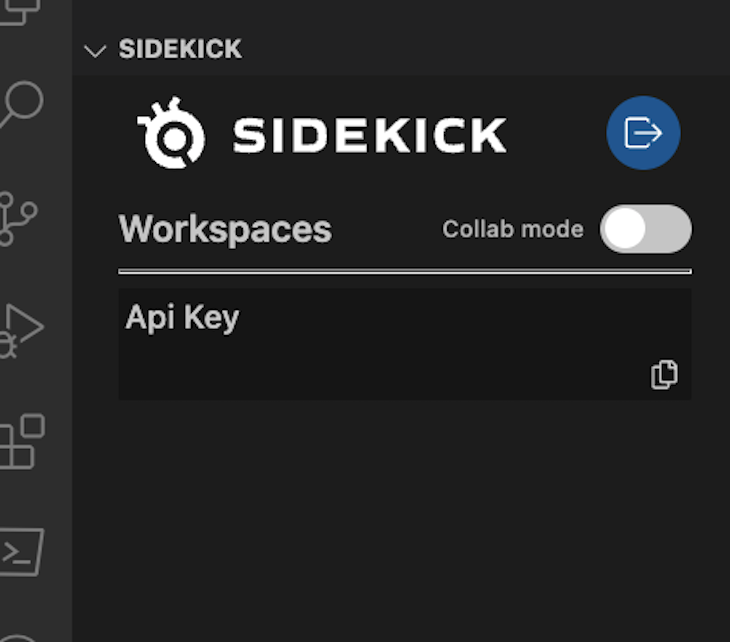
Then, click the Sidekick Login button to connect the agent to the Sidekick broker. You’ll notice the Sidekick VS Code extension turns into connected mode.
Next step, we can clone the quick start sample project:
git clone https://github.com/boroskoyo/sidekick-nodejs-quickstart.git
The quick start project includes an inbuilt Sidekick Node.js agent. In the app.js file, the agent is initialized and started as below.
var sidekickDebugger = require('@runsidekick/sidekick-agent-nodejs');

sidekickDebugger.start({
  apiKey:"my-token",
  SIDEKICK_AGENT_APPLICATION_NAME: "sidekick-demo-app",
  SIDEKICK_AGENT_LOG_LEVEL:"debug",
  SIDEKICK_AGENT_BROKER_HOST: "ws://127.0.0.1",
  brokerPort:7777,
  applicationVersion:"1.0",
  applicationStage :"lab"
});
Run the following command to start the quick start app.
cd sidekick-nodejs-quickstart
npm install
npm start
Now, we have the self-hosted Sidekick instance and quick start app running. Let’s try to use Sidekick tracepoint and logpoint to debug it.
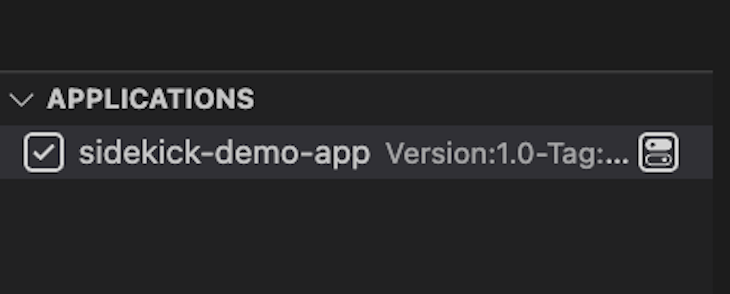
Before adding a tracepoint, we need to select the sidekick-demo-app in the Applications panel in the left menu.
Then open app/routes/index.js in VS Code, add a tracepoint by right-clicking line 10, and choose Sidekick > Add Tracepoint. A tracepoint icon will be added to the left of the line:
![]()
Then, open a browser and navigate to https://localhost:3000. This will trigger the app and output of the tracepoint events.

Open the app/routes/index.js in VS Code, and add a logpoint by right-clicking line 10 and choosing Sidekick > Add Logpoint. A logpoint icon will be added to the left of the line, as well as the Logpoint UI.
You can configure the Logpoint in the following ways:
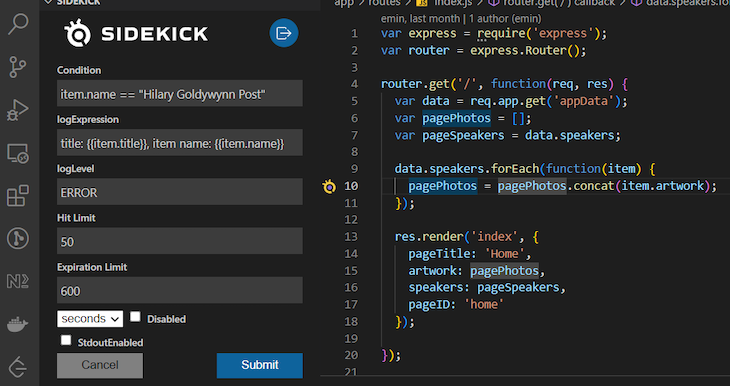
Click Submit to save the logpoint; it will be shown in the logpoint panel:

Sidekick exposes all of its live debugging functionality via REST endpoints. For the self-hosted Sidekick, you can see the API’s swagger interface at the URL
http://localhost:8084/swagger-ui.html.
To use the API, you will need to enter the apiKey for authorization. The apiKey can be found in the Node.js agent configs in app.js.
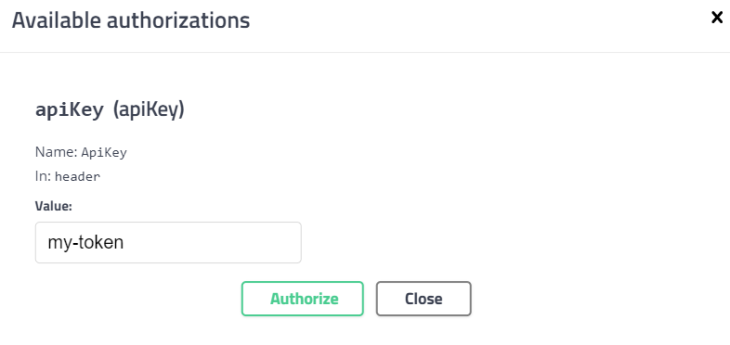
The API endpoints include the standard CRUD for tracepoint, logpoint, and webhooks.

Sidekick agents are lightweight and add almost no overhead to the application execution. In Sidekick’s recent benchmark blog, tests were carried out on the passive impact of Java agents deployed together with demo applications. The test result shows the overheads of all three agents are negligible.
Sidekick open source was just released in August 2022, and its commercial version was launched as a standalone product in 2021. At the time of writing, the Sidekick open source GitHub repo has 1.5K stars and 57 forks. As a new tool, it will take some time to mature and be recognized by developer communities.
The Sidekick repo in GitHub is actively maintained, and issues raised received a prompt response.
Sidekick provides a viable solution to address the pain points associated with live debugging and logging needs. It is secure and lightweight, and provides non-intrusive debugging capabilities unlike traditional remote debugging tools.
I hope this article raises your interest to give this new and promising tool a try.
There’s no doubt that frontends are getting more complex. As you add new JavaScript libraries and other dependencies to your app, you’ll need more visibility to ensure your users don’t run into unknown issues.
LogRocket is a frontend application monitoring solution that lets you replay JavaScript errors as if they happened in your own browser so you can react to bugs more effectively.
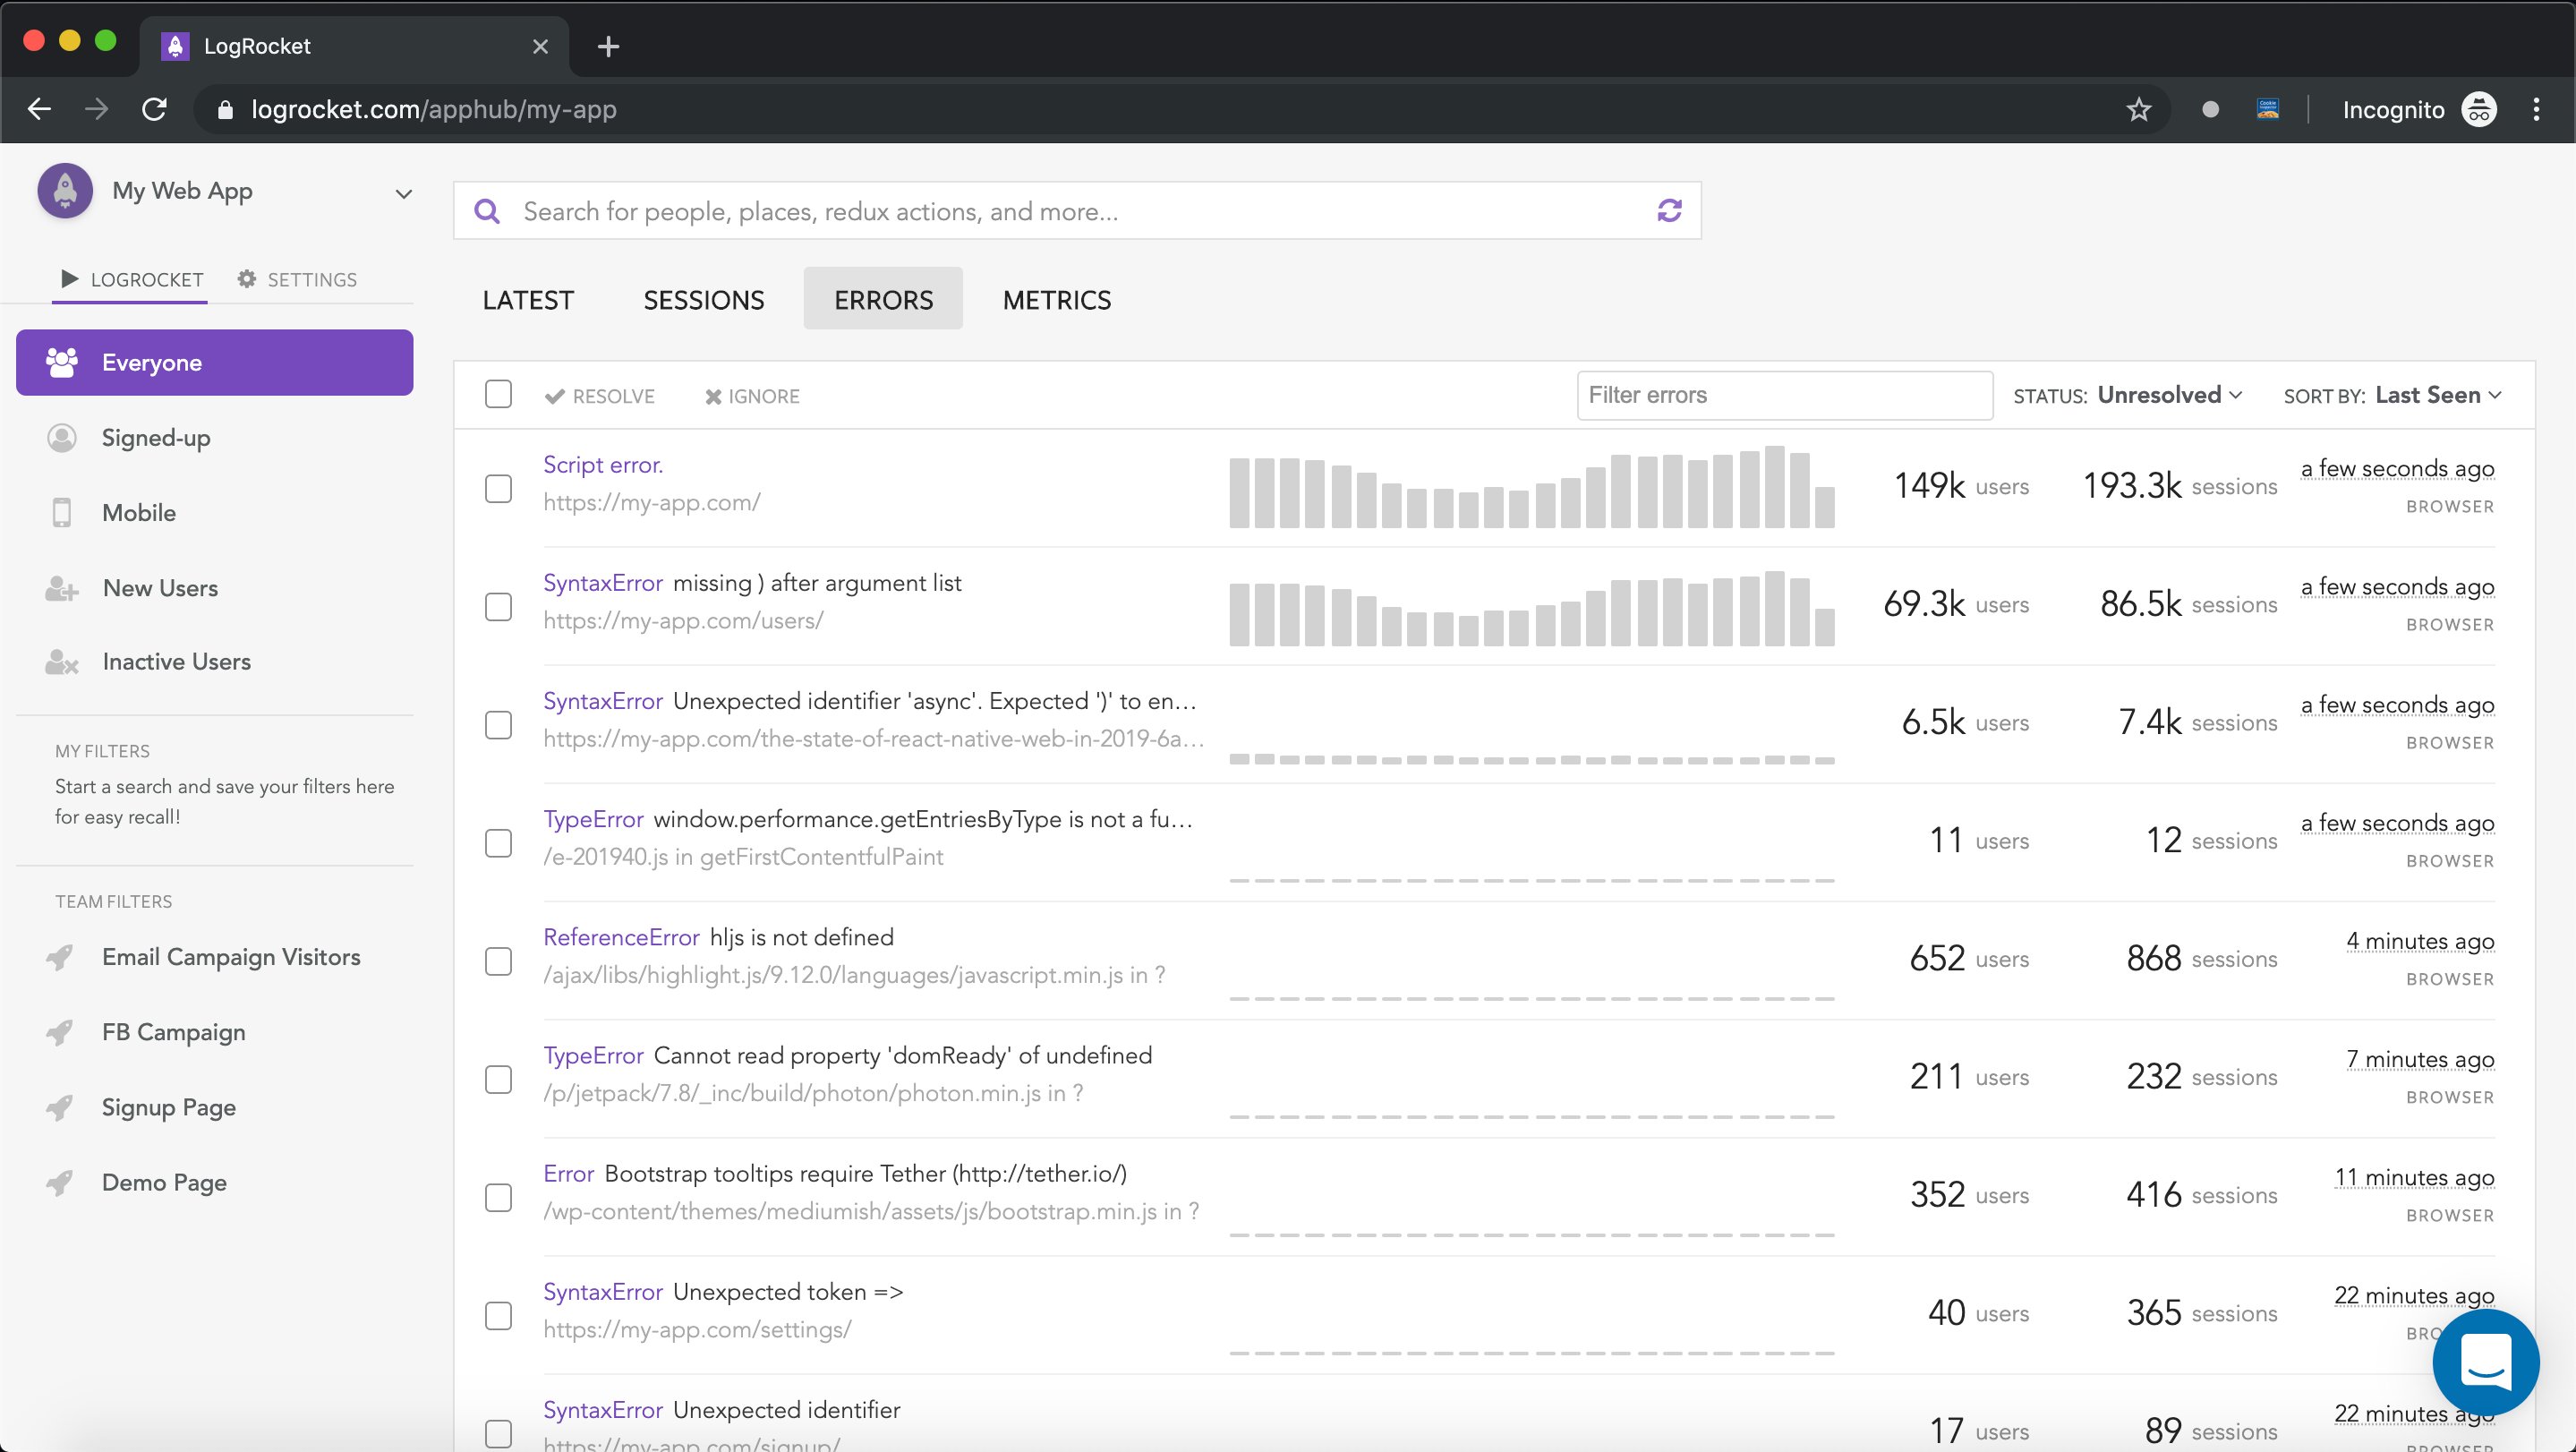
LogRocket works perfectly with any app, regardless of framework, and has plugins to log additional context from Redux, Vuex, and @ngrx/store. Instead of guessing why problems happen, you can aggregate and report on what state your application was in when an issue occurred. LogRocket also monitors your app’s performance, reporting metrics like client CPU load, client memory usage, and more.
Build confidently — start monitoring for free.
When should you move API logic out of Next.js? Learn when Route Handlers stop scaling and how ElysiaJS helps.

Explore how Dokploy streamlines app deployment with Docker, automated builds, and simpler infrastructure compared to traditional CI/CD workflows.
A side-by-side look at Astro and Next.js for content-heavy sites, breaking down performance, JavaScript payload, and when each framework actually makes sense.
AI-generated tests can speed up React testing, but they also create hidden risks. Here’s what broke in a real app.re
Would you be interested in joining LogRocket's developer community?
Join LogRocket’s Content Advisory Board. You’ll help inform the type of content we create and get access to exclusive meetups, social accreditation, and swag.
Sign up now