Editor’s Note: This article on debugging React applications with React Developer Tools was last revised on 8 February 2023 to reflect recent updates to React Developer Tools and include React Hooks-related features. To learn more about React Hooks check out our cheat sheet here.

Debugging is one of the most useful skills a developer can possess. It allows you to navigate properly, spot errors in your code, and apply fixes quickly and efficiently to deliver production-ready, error-free, high-quality software systems. In the modern web development industry, this is made possible by using various tools and techniques.
React is one of the fastest-growing frontend development libraries. It makes creating complex and interactive UIs painless by offering a component-oriented UI development approach. Like other UI development frameworks and libraries, it has React Developer Tools, a debugging tool.
In this tutorial, I will explain how to use Rect Developer Tools’ latest features which came with the v4.x (and later) releases, to debug your React applications with practical examples.
Jump ahead:
React Developer Tools is a solution to inspect and analyze React components. It lets you edit component props and the state for debugging purposes. It also offers an inbuilt profiler for performance analysis. It comes as an official browser extension and an Electron-based standalone desktop app. The browser extension is available for Chrome, Firefox, and Edge. For Safari and other web browsers, the React development team offers the standalone Electron app via the react-devtools package.
React Developer Tools extends the browser’s native DevTools environment with several React-related debugging tabs. Similarly, the standalone React Developer Tools app offers the same browser-extension-like debugging experience.
Since the Developer Tools solution’s inception, there have been many releases from the core team. In this tutorial, I’ll highlight the notable features and demonstrate ways you can use its features to better debug your React apps productively.
Every modern web browser offers an inbuilt developer tools solution for developers to inspect and fix bugs in web apps. For example, you can add breakpoints and use the console to debug any JavaScript-based app. Also, you can inspect native DOM elements and attributes easily with the browser’s DevTools. React uses a virtual DOM with component instances and renders the real DOM during component rendering phases, so we can’t use inbuilt browser developer tools to debug React-component-specific things.
React Developer Tools offers a solution to debug your React apps by letting you inspect/manipulate React component internals, such as props and state. So, using React Developer Tools boosts your React app debugging tasks without using console.log browser-native workarounds.
Now, you know how the React Developer Tools solution helps debug React apps and why the web browser’s built-in debugger is inadequate for productively debugging React apps. Look at the following highlighted features that React Developer Tools offer:
React Developer Tools is available as an extension for modern popular browsers. Install the extension using the following links:
If you have already installed the extension, it should update automatically whenever the React team publishes a new version. If you use React Native, Safari, or another web browser, you can install the standalone version from npm:
npm install -g react-devtools
# --- or ---
yarn global add react-devtools
# --- or ---
npx react-devtools
Let’s create a test app to get started with React Developer Tools debugging. I created a starter project for easy setup and to reduce overhead, ensuring the article focuses on debugging. The skeleton of the application has already been set up. It includes a few components, styling, and project structure.
Run the following command to clone the repository if you want to experiment with me:
git clone https://github.com/codezri/react-contacts.git
Then, open the folder and install the project’s dependencies by running the following command:
cd react-contacts

npm install
# --- or ---
yarn add
To start the React app development server, run the npm start or yarn start command in the root folder of your project. Open your browser to localhost:3000, and you will see the project live! Before checking newly introduced React Developer Tools features, try the basics you already know to get familiarized with our test app. For example, React elements tree is as follows:
According to the React Developer Tools internal design documentation, the legacy DevTools solution rendered the component tree and internal properties in a less-efficient strategy that involves many JSON serialization events, so debugging complex React apps had performance bottlenecks from the DevTools perspective.
The new DevTools solution offers significant performance gains and improved navigation and inspection experience by transporting optimized component tree data and props on demand. These performance enhancements motivate developers to productively use React Developer Tools in larger apps.
In previous versions of DevTools, navigating through large component trees has been a bit tedious. But now, DevTools provides a way to filter components so that you can hide ones you’re not interested in. To access this feature, let’s filter through the three components in our sample application. Open your DevTools, and you will see our three components listed:
Click the setting icon below the components tab to filter out a component and focus on the one we are interested in. You’ll be presented with a popup that consists of several tabs. Click the components tab and choose your preferred filtering option.
By default, the component tree shows all React components. You can add a filter via the component tab and hide components that match Pe regular expression to exclude Persons and People components from the tree:
After we filter out components, they become hidden by default but will become visible after disabling the filter. This feature will come in handy when you work on a project with many components and fast sorting becomes a real need. What’s even more interesting about this feature is that filter preferences are remembered between sessions, so you don’t need to re-add your favorite component filters during each debugging session.
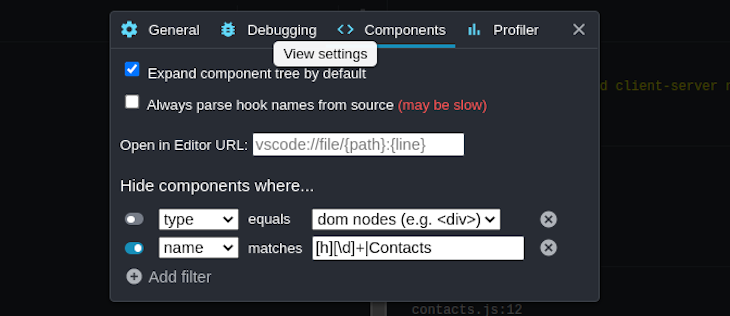
You can add multiple filters and exclude elements based on component name, type, location, and higher-order components (HOC). Also, you can use advanced regular expressions. For example, the following filter hides all heading DOM elements (<h1>) and Contacts React components:
To make larger component trees easier to browse and to make DevTools faster, components in the tree no longer show inline props. To see this feature in action, all you need to do is select a component and all the components’ props, state, and Hooks will be displayed on the right-hand side of the React Developer Tools components tab.
In our sample application, we only pass props to our Contacts component. Clicking it will reveal the value of the props passed to it, and clicking the other components will reveal that no props were passed to them. Look at the following preview:
Although viewing props from DevTools may not be so useful for smaller React projects since props are easily inspectable through the code, it will come in handy when working with larger React projects that consist of complex component trees and props. However, the props and state editing feature helps debug even small-scale apps productively:
In React component handling, a component’s owner refers to the component that renders it. On the other hand, parent refers to the upper-level component of the component tree. The parent component is not always the owner. Let’s understand it with an example. Rename the App component to App_original and add the following code:
function Container({ children }) {
  return (
    <div style={{ padding: '8px', background: '#bbb' }}>
      { children }
    </div>
  );
}

function Panel({ color }) {
  return (
    <div style={{height: '16px', background: color}}></div>
  );
}

function App() {
  const color = 'red';
  return (
    <Container>
      <Panel color={ color }/>
    </Container>
  );
}
Container is the parent of Panel, but App is the owner of the component, and only owners can send down props. In the newer version of React Dev tools, you can quickly debug an unexpected prop value by skipping over the parents and finding the owner that initiated the unexpected prop value. DevTools v4 adds a rendered by list in the right-hand pane that allows you to quickly step through the list of owners to speed up your debugging process.
By clicking the Panel component from the component tree, you can see where the color prop came from by browsing the rendered by list:
This is very useful when tracing back a particular prop’s origin. It also comes with an inverse function called owners tree. It is the list of things rendered by a particular component — the things it owns. This view is kind of like looking at the source of the component’s render method and can be a helpful way to explore large, unfamiliar React applications.
The owners tree typically appears before the component tree UI.
To use this feature to debug our application, double-click a component to view the owners’ tree and click the x button to return to the full component tree. You can also move around in the tree to see all the children of the component. Rename App_original to App, get our contacts app back, and check the owners tree as follows:
Carefully designed UI/UX concepts directly affect the quality of software systems. As a result, every software development team typically hires at least one UI/UX developer or more. UI/UX principles-based visual improvements may not always come with the first release of a particular app — the UI/UX team typically research, experiment, analyze, and implement new visual improvements to boost app users’ productivity and improve the app’s usability aspects.
Before v4 of React Developer Tools, some UI/UX-related issues affected debugging productivity and overall debugger’s usability (especially while debugging large React apps). So, in v4, the React development team introduced the following developer-friendly visual improvements.
In the previous versions of React Developer Tools, deeply nested components require both vertical and horizontal scrolling to see, which makes tracking large component trees difficult. DevTools now dynamically adjust nesting indentation to eliminate horizontal scrolling.
To use this feature in our app, click the components tab, then click any component. All its children will automatically appear below it with an automatic indentation from the next component. It’s impossible to demonstrate this with our sample contacts app since it’s a simple app that doesn’t contain deeply nested elements. However, you can see the dynamic indentation if you open React Developer Tools for the official React documentation:
Previously, when searching in DevTools, the result is often a filtered components tree showing matching nodes as roots. Other components are hidden, and the search match now displays as root elements. This made the overall structure of the application harder to reason about because it displayed ancestors as siblings. Now, you can easily search through your components with inline results similar to the browser’s find-in-page search:
As mentioned before, visual improvements increases React developers’ productivity during debugging. A good UI/UX isn’t the only fact that makes a software system great — app functionality (or features) also increases a particular software product’s quality. Early React Developer Tools versions weren’t fully-featured and didn’t align properly with modern React library features, for example, Suspense, Hooks, and more. In v4, the React team introduced the following functionalities to debug React apps that use the latest, advanced React library concepts.
Hook-based React projects can be debugged faster and better because Hooks in v4 now have the same level of support as props and state. Values can be edited, and arrays and objects can be drilled into. Open the sample app, select the App component in DevTools, look at the Hooks area, and try to edit state, as shown in the following preview:
While debugging, if you hit reload, DevTools now attempts to restore the last selected element. Let’s assume we were sorting through the Persons component in our sample application before a page refresh occurs, DevTools will resume with the Persons component automatically selected:
Experienced React developers often tend to use advanced development techniques while developing apps. Higher-order components (aka HOC) is an advanced React component composition technique that implements a function to take a component and return a modified component. React Developer Tools v4 displays HOC badges as it displays forwardRef, Memo -like badges. Let’s check HOC support in DevTools.
First, add the following function to your App.js file:
function withMoreProps(Component) {
  function withMoreProps() {
    return (
      <Component x={10} y={20}/>
    );
  }
  withMoreProps.displayName = `withMoreProps(${Component.displayName ||
    Component.name})`;
  return withMoreProps;
}
The withMoreProps HOC adds x and y props to the input component. Modify the Persons component with withMoreProps HOC as follows:
function App() {

  const [contacts, setContacts] = useState([]);
  const PersonsWithMoreProps = withMoreProps(Persons);

  useEffect(() => {
    fetch('http://jsonplaceholder.typicode.com/users')
      .then(res => res.json())
      .then((data) => {
          setContacts(data);
      })
      .catch(console.error)
  }, []);

  return (
      <div>
        <Contacts contacts={contacts} />
        <Persons/>
        <People/>
        <PersonsWithMoreProps/>
      </div>
  );
}
Check DevTools. Now you can see the HOC label and newly added props:
React’s Suspense API lets components wait or do something before rendering. <Suspense> components can be used to specify loading states when components deeper in the tree are waiting to render. DevTools lets you test these loading states with this toggle:
In the programming field, a profiler refers to a software program that analyzes another software program’s source dynamically. The dynamic analysis process helps developers identify performance issues in their apps. For example, if a web app works slowly in certain conditions, web developers can use a profiler to identify performance bottlenecks. React Developer Tools offers the profiler program in a separate tab in the browser extension and the standalone app.
React Developer Tools Profiler is a powerful tool for performance-tuning React components. Legacy DevTools supported profiling but only after it detected a profiling-capable version of React. Because of this, there was no way to profile an application’s initial mount (one of the most performance-sensitive parts). This feature is now supported with a reload and profile action:
The profiler displays a list of each time the selected component is rendered during a profiling session, along with the duration of each render. This list can be used to quickly jump between commits when analyzing the performance of specific components. For example, profile the sample app and click a component to see how many times a particular component was rendered as follows:
Only the following versions of React are supported:
So if certain features don’t work on a particular project, check the React version you are using. It’s always good to use the latest React version for new projects or upgrade React version in existing projects to use the latest library features and receive performance or security enhancements.
In this tutorial, we have talked about debugging React applications with DevTools. We looked at some additions and improvements that came with it. We also looked at how they make debugging your code easier.
Try debugging your React apps with the features we’ve discussed in this article. You can check this live playground app to learn how to debug React apps with DevTools without installing the browser extension or the standalone app. Here is the summary that you need to remember before debugging React apps:
If you have any questions, comments, or additions, be sure to drop a comment. Happy coding!

Compare the top AI development tools and models of July 2026. View updated rankings, feature breakdowns, and find the best fit for you.

Learn how to detect unused and ghost dependencies in JavaScript projects using Knip, a project-level linter that keeps your dependency graph accurate.

Learn how Storybook MCP enables AI agents to understand your component library, generate accurate UI, and validate code using documentation, stories, and automated tests.

Debug RSC hydration mismatches in production with Next.js instrumentation, Suspense isolation, HTML diffing, and CI smoke tests.
Would you be interested in joining LogRocket's developer community?
Join LogRocket’s Content Advisory Board. You’ll help inform the type of content we create and get access to exclusive meetups, social accreditation, and swag.
Sign up now