
Although it has the potential to provide the best UX for users, developing iOS and Android apps natively usually isn’t an option for JavaScript developers. This is where React Native comes into play.

React Native application code can be analyzed with the inspector, profiler, and remote debugger, all accessed by the in-app development menu. You can combine this with the stand-alone React Developer Tools. In contrast to native development, however, this approach has its limits with regards to debugging network communication.
This article covers additional tools for React Native that enable debugging capabilities the shipped React Native Developer Tools don’t offer. The focus is on inspecting and rewriting network traffic between your app and server.
At the end of this article, you will have learned that debugging network traffic for Android apps has its limits depending on the selected development approaches, such as Expo managed workflow, ejecting from the Expo managed approach, or React Native CLI.
This article describes the handy local proxy tools Charles Proxy, HTTP Toolkit, and Proxyman. For debugging encrypted network traffic for iOS, I cover Proxyman and Charles Proxy, and for Android, HTTP Toolkit and Proxyman (I skip Charles Proxy even though this is supported).
My goal is not to cover every possible use case with every tool, but to show you different scenarios with different tools in order not to drag out the article unnecessarily. I only cover how to debug the traffic of your connected iOS tool with Proxyman, for example, and not with Charles Proxy (though it’s possible).
Additionally, some debugging use cases are only possible on real devices; thus, I’ll show you two handy tools for iOS and Android development to mirror the device screens on your machine. This is a lifesaver in a remote pair programming session.
The Replay is a weekly newsletter for dev and engineering leaders.
Delivered once a week, it's your curated guide to the most important conversations around frontend dev, emerging AI tools, and the state of modern software.
There are several ways to develop a React Native app. The most common options are:
There are many differences between these three approaches, but the most important distinction in terms debugging network traffic is whether you have access to the native Android code or not.
As you will see later, to enable all capabilities of network debugging, you need to define some security settings in native Android code. This is possible with options 1 and 3, but not with 2 — except if you eject from the managed workflow.
Your ability to inspect HTTPS network calls comes down to whether it’s possible to establish an HTTP(S) proxy in your development setup with a local proxy tool like Charles Proxy or Proxyman. They install SSL certificates that enable you to view encrypted HTTPS contents. For Android in particular, it boils down to whether you can customize the native network security configuration.
Below is an overview of whether encrypted requests and responses can be inspected for each of the three options reviewed above:
For those readers who are new to React Native, the next section will give you a quick overview on how to set up a “pure” React Native environment (options 1 and 2 above). I do not cover the hybrid approach (3) because this would go beyond the scope of the article.
Expo is a great way to get a basic React Native app up and running in a pinch. If you do not plan to work on a hybrid app project, Expo is a good choice. Make sure you can implement all your requirements with the existing component libraries.
$ npm install --global expo-cli [1] install expo cli globally
$ expo init react-native-sandbox [1] create a project
The second command opens up an interactive menu to select from a template, with or without TypeScript.
Currently, the Expo team creates a project with Yarn as the package manager, so use the following command from the project’s root folder to start the Metro bundler:
$ yarn start
The Metro bundler should open up in your default browser.
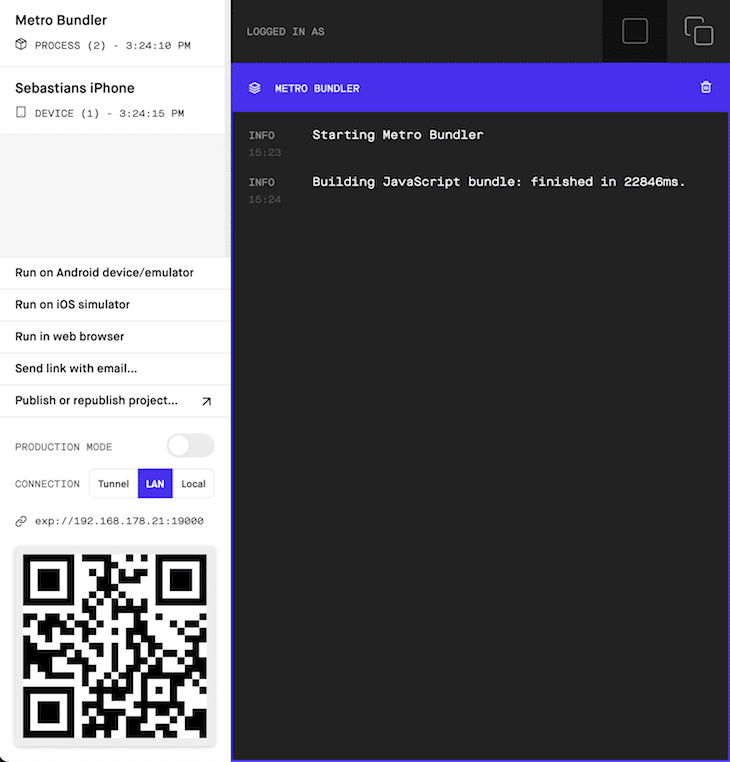
As you can see, Expo scores high marks with a good developer experience and an intuitive workflow. Just open your camera app on your mobile device and scan the QR code and, simsalabim, the app opens up on your device.
If Metro crashes, it might help to reinstall Watchman, which is used under the hood.
$ brew reinstall watchman
It’s fair to say that Expo’s managed approach might not fit your use case — say, if you wanted to incorporate native modules. Take a look Expo’s documentation on its limitations. The following video gives a good overview when to use Expo or the React Native CLI:
React Native CLI vs Expo
I go over my experience using Expo and compare it to using the React Native CLI.
Before you can create a project, you need to set up your dev environment for iOS and Android. You’ll need to invest more time in the initial setup compared to Expo, but once it’s complete, the following commands will produce a working initial project.
For Android, you either need to have an emulator up and running or connect a device. iOS is a little easier to cater for; the simulator opens automatically. The next section goes into more detail about how to set this up.
$ npx react-native init rnCliPlayground # init project
$ cd rnCliPlayground && npx react-native run-ios # start iOS app
$ cd rnCliPlayground && npx react-native run-android # start Android app
In contrast to Expo, my experience is that more can go wrong during setup, and it can take longer for iOS and Android to run. On the other hand, the documentation from the React Native team is helpful. That said, though, Expo works as well as always out of the box.
The examples in the remainder of the article always refer to a very simple Expo project; I just generated the project as described above. The only change is to override App.js with the following code, which fetches a JSON array of movies:
import { StatusBar } from 'expo-status-bar';
import React, { useEffect, useState } from 'react';
import { StyleSheet, Text, View } from 'react-native';
export default function App() {
  const [movies, setMovies] = useState([])
  const [loading, setLoading] = useState(false);
  useEffect(() => {
      setLoading(true);
      const getMoviesFromApi = () => {
        return fetch('https://reactnative.dev/movies.json')
          .then((response) => {
            if (response.status < 400) {
              return response.json()
            }
            else {
              return {
                movies: []
              };
            }
          })
          .then((json) => {
            return json.movies;
          })
          .catch((error) => {
            return {
              movies: []
            };
          });
      };
      getMoviesFromApi().then(response => {
        setMovies(response)
        setLoading(false);
      });
  }, [])
  return (
    <View style={styles.container}>
      <StatusBar style="auto" />
      {loading && <Text>Loading...</Text>}
      {!loading && movies.length > 0 && movies.map(movie =>
        <Text key={movie.id}>{movie.title}</Text>
      )}
      {!loading && movies.length === 0 && <Text>no movies found</Text>}
    </View>
  );
}
const styles = StyleSheet.create({
  container: {
    flex: 1,
    backgroundColor: '#fff',
    alignItems: 'center',
    justifyContent: 'center',
  },
});
For the purposes of this article, you’ll need to use either iOS Simulator/Android Emulator or real devices. Therefore, you need to set up Xcode and Android Studio, respectively. From the iOS perspective, you only need the capability to open Simulator, whereas with Android, you need to customize security configurations in code.
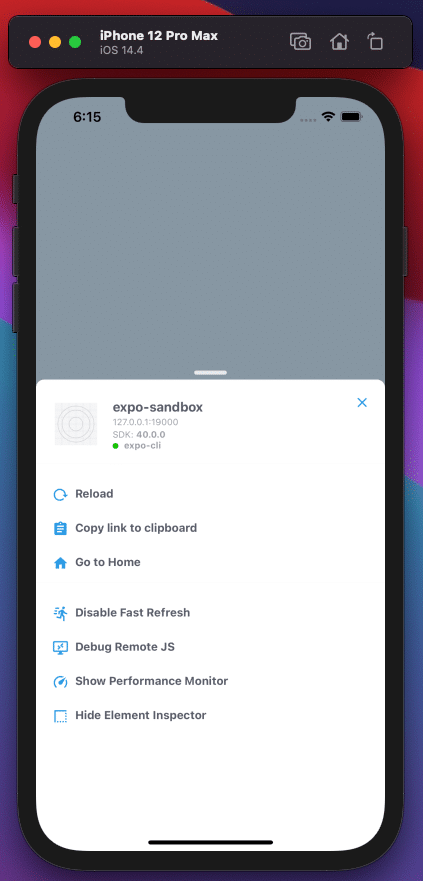
You can download and install Xcode either from developer.apple.com or the App Store. From the Expo CLI, you can press i or click the Run on iOS simulator link in the Expo browser interface. You can press ⌘ d in Simulator to open up the in-app developer menu.
After you’ve installed Android Studio, you have to properly configure it to open your React Native project in Android Emulator. Start the Metro bundler of your Expo project with the following command:
$ yarn start
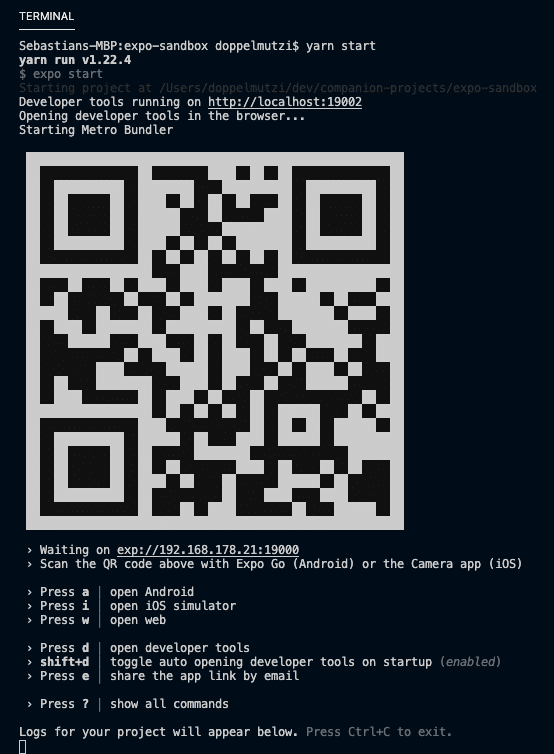
The managed workflow starts Metro and opens the developer tools inside the browser and in the terminal. In the terminal, you can press a to open up your Expo app in Android Emulator. You can do this either from the Expo CLI or from the browser view by clicking on Run on Android device/emulator.
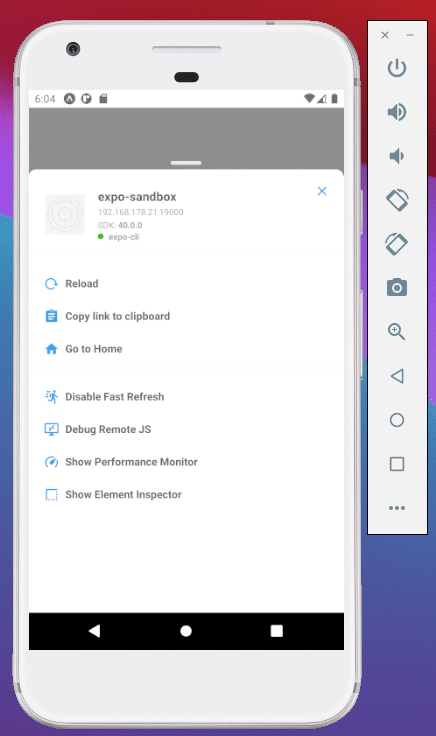
You can open the in-app developer menu with ⌘ m.
There are development use cases where working with the iOS Simulator or Android Emulator is not possible, e.g., debugging your iOS app with different network settings or airplane mode. Therefore, you need to work with your actual device.
This section presents handy tools to work with real devices to facilitate debugging real devices. There are also ways to mirror the screen of your actual device to your development machine, which improves the developer experience in remote pair programming scenarios.
scrcpy is an awesome utility for Android development that is available for all major operating systems. It mirrors the screen of a device connected via USB cable to the developer machine.
What’s especially great is that the mobile device can also be remote-controlled by the tool on your development machine instead of using gestures on a device. It’s especially handy if you share your screen in a video conference so that peers can see the mouse cursor to get an idea how you interact with the mirrored device.
Installation for macOS is straightforward with Homebrew. As a requirement, you need ADB (Android Debug Bridge) up and running. In addition, you have to enable USB debugging on your Android device.
$ brew install scrcpy
$ brew install --cask android-platform-tools [1] install adb
In order to get scrcpy to work with a React Native app running on your device, you need to establish a reverse proxy with adb reverse.
$ adb reverse tcp:8081 tcp:8081
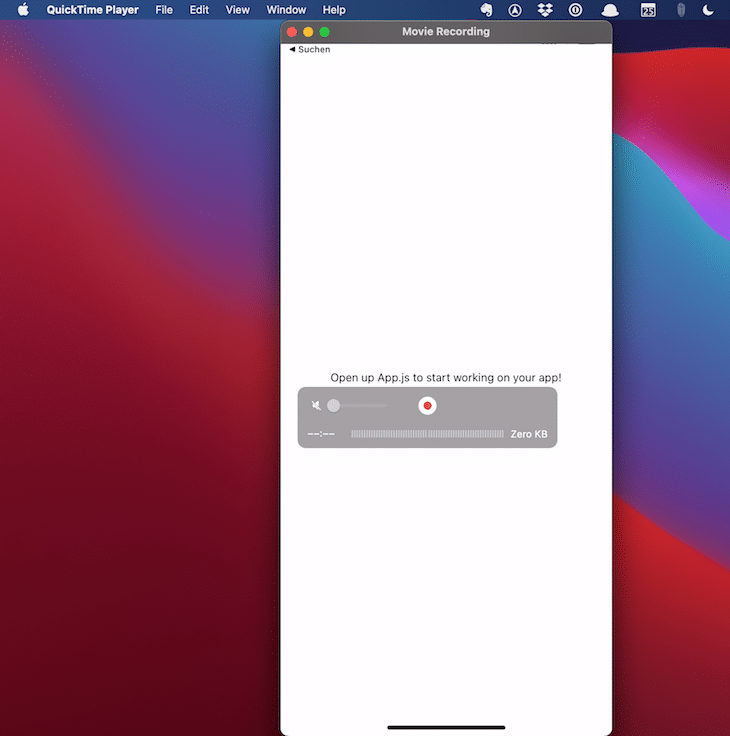
When you connect your iOS device via USB cable to your Mac, you can leverage QuickTime Player to mirror your device screen. You first have to trust your connected Mac, then open QuickTime Player and start a new movie recording (⌥ ⌘ N). Next to the red recording button, open the dropdown and select your connected device from the camera input. That’s it.
The screenshot below shows how I mirror my Expo app from my iPhone connected via USB cable to my MacBook.
Proxyman is a macOS-only proxy tool to intercept, view, debug, and rewrite the HTTP(S) network traffic of iOS and Android apps.
In order to inspect encrypted HTTPS messages, you have to install Proxyman CA Certificate on your machine. Then, just open the certificate dialog by selecting Certificate > Install Certificate on this Mac… from the main menu. Click on the install button in the Automatic tab.
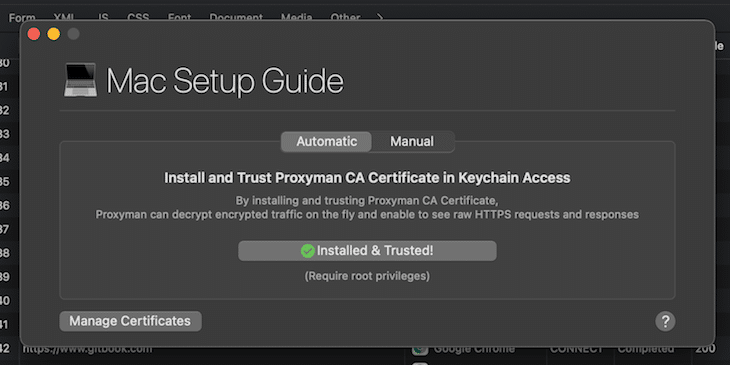
This is a prerequisite for using Proxyman with iOS simulators and devices.
You’ll need to perform a one-time setup to install and trust certificates on all iOS simulators. Therefore, select the setup dialog from the main menu by selecting Certificate > Install Certificate on iOS > Simulators…. Click on the buttons of step 2 and 3 and you’re good to go.
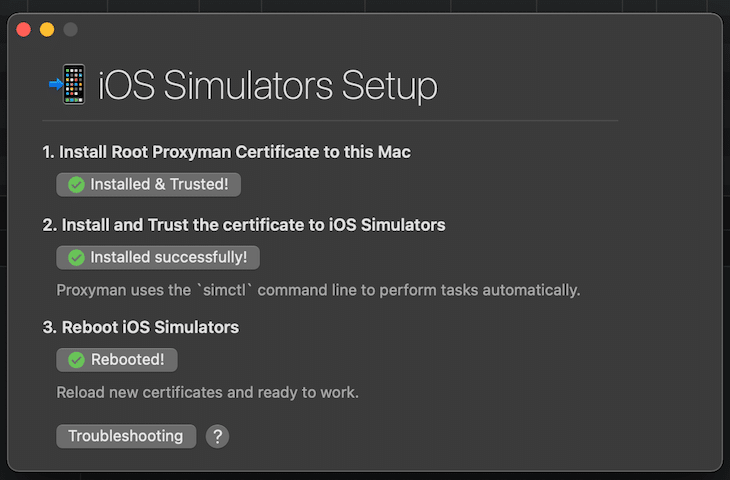
What I really admire is this tool’s usability, especially the very helpful interactive checklists for the different scenarios.
This step is similar but needs a little additional work on the actual device. You need to connect your iOS device to your Mac via USB cable. Make sure it appears in the Finder app before you proceed. Next, open the certificate dialog from the main menu (Certificate > Install Certificate on iOS > Physical Devices…).
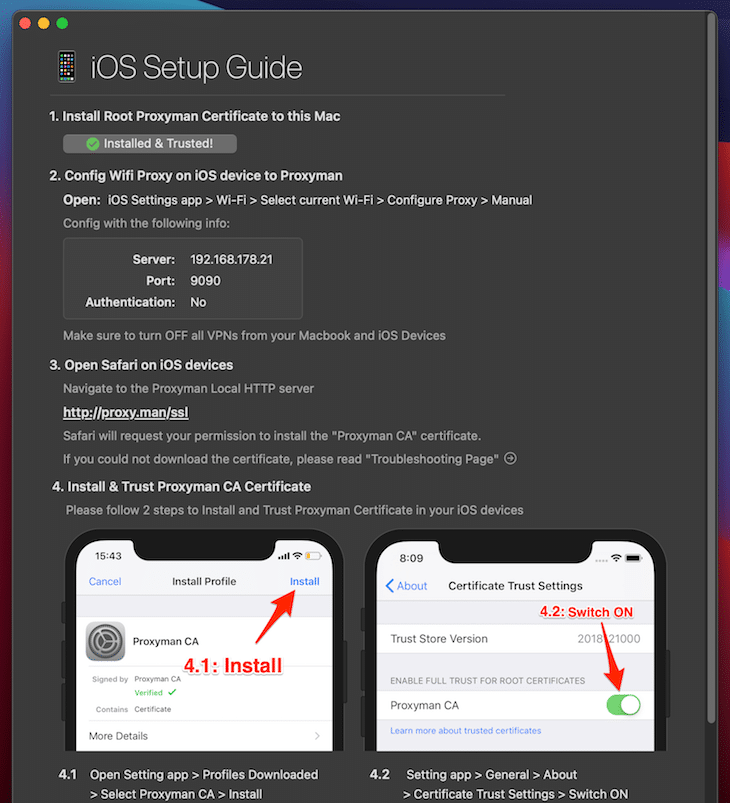
Just do what the dialog urges you to do. Proxyman uses port 9090.
Now, you can start to view the network traffic. Open up the Metro bundler of your Expo app and press i for a simulator or scan the QR code with the camera app on your iOS device connected by USB cable.
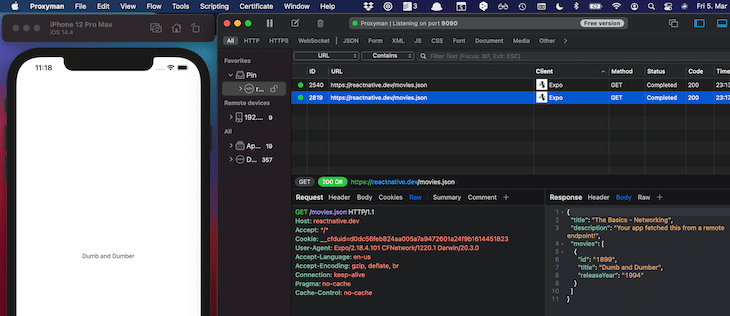
You should see the network traffic of the app, which invokes a GET request every time you reload from the Expo development menu by pressing ⌘ d on the iOS simulator or by shaking your iOS device.
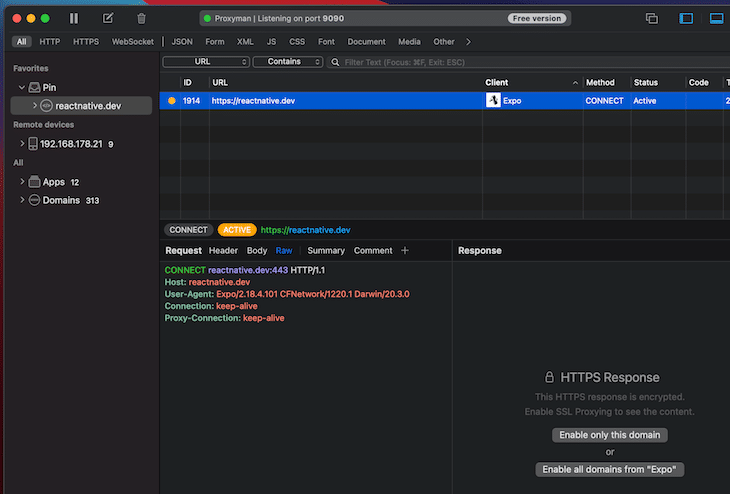
In order to inspect the response body, you need to enable SSL proxying by clicking on the button Enable all domains from “Expo”. The following screenshot shows the inspected response sent by the server after invoking a GET call from the iOS simulator.
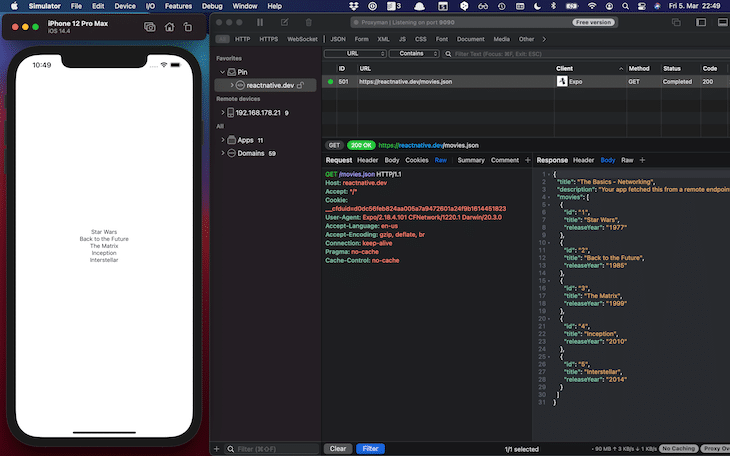
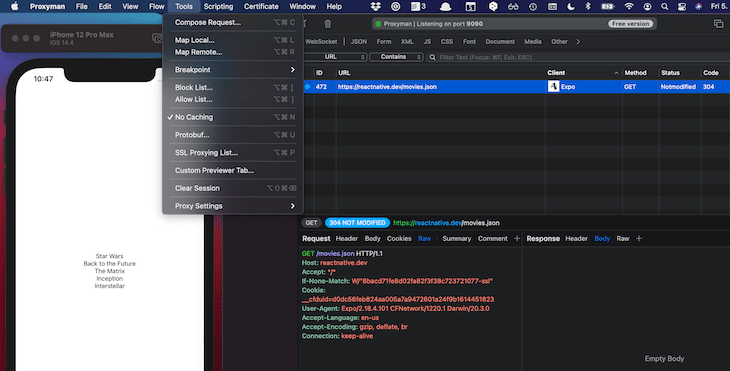
In the example request, the server answers with a 304 status code because the response has already been cached by the client. To change this behavior and get a 200 status code with the movie content, you can deactivate caching via Tools > No Caching.
In order to play out different use cases, it is useful to fake network calls by creating stubs. In this example, we’d like to change the response body to consist of one movie instead of four.
Proxyman provides different options for that. Load a local JSON file as a stub with the Map Local Tool whenever the route matches the concrete URL https://reactnative.de/movies.json. This is the file you want to load:
// stub.json
{
  "title": "The Basics - Networking",
  "description": "Your app fetched this from a remote endpoint!",
  "movies": [
    {
      "id": "1899",
      "title": "Dumb and Dumber",
      "releaseYear": "1994"
    }
  ]
}
You can define multiple stubs and enable or disable them as you like.
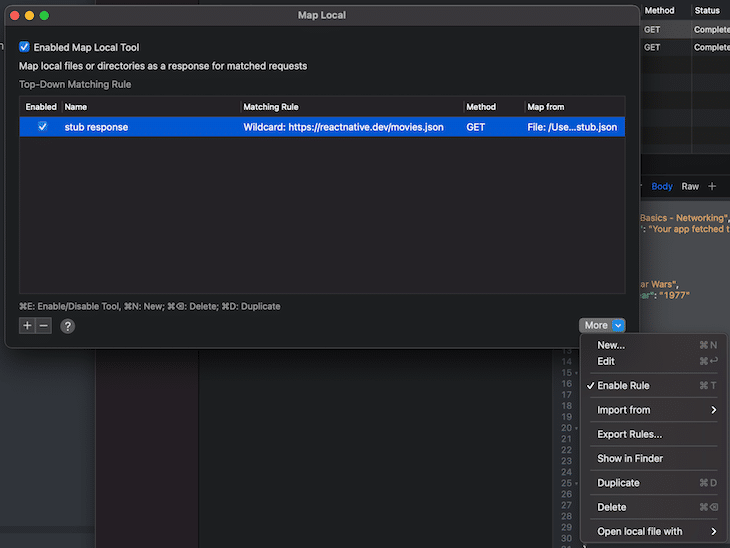
Whenever you press ⌘ r in the Expo CLI, a new request is invoked and the content of the JSON file is returned instead of the original server response.
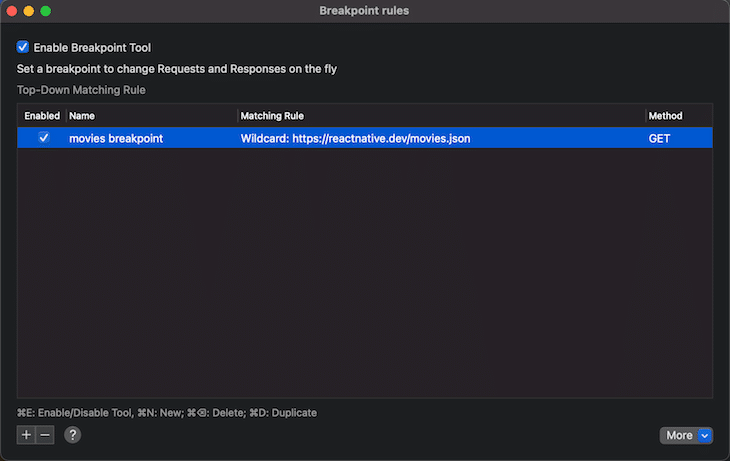
The concept of Breakpoints is a powerful tool to debug the correct behavior between your app and the server. The following example shows an example breakpoint for the concrete URL https://reactnative.de/movies.json.
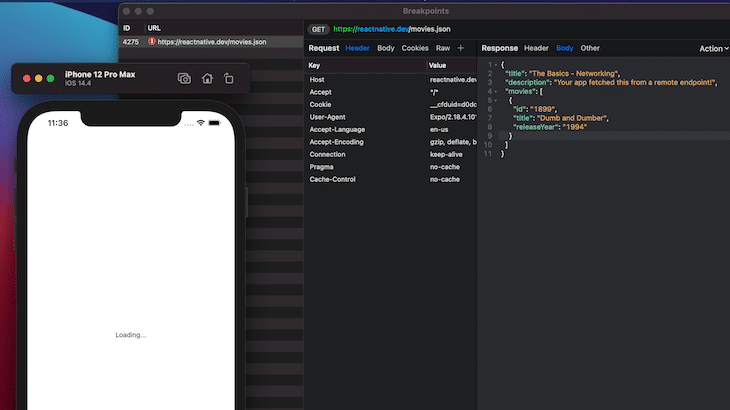
With that in place, every time this rule is matched, the network call is paused. As you can see in the next screenshot, you then have the ability to manually define the response body. In this case, you’d change the response body to consist only of one movie. By the way, you can see that the loading logic works correctly because the user sees the loading label during the loading process.
To use Proxyman with Android, you need to override the security settings in Android Studio, as explained in the official documentation.
The nice thing with Proxyman is the interactive documentation. To use it with Android, select Certificate Menu > Install Certificate on Android > Emulator… from the main menu. In the opening dialog, you get the code to use as a security setting to enable SSL proxying.
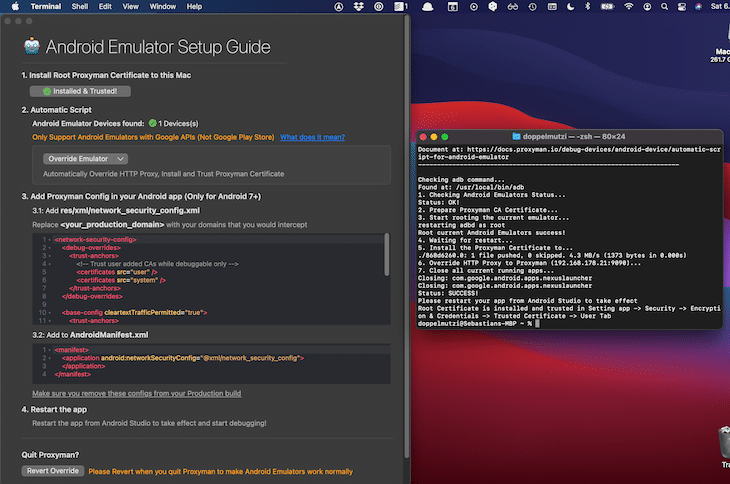
Because we have Expo’s managed workflow, we do not have the chance to insert the above provided config code. That’s why we have SSL handshake problems and cannot see the response body.
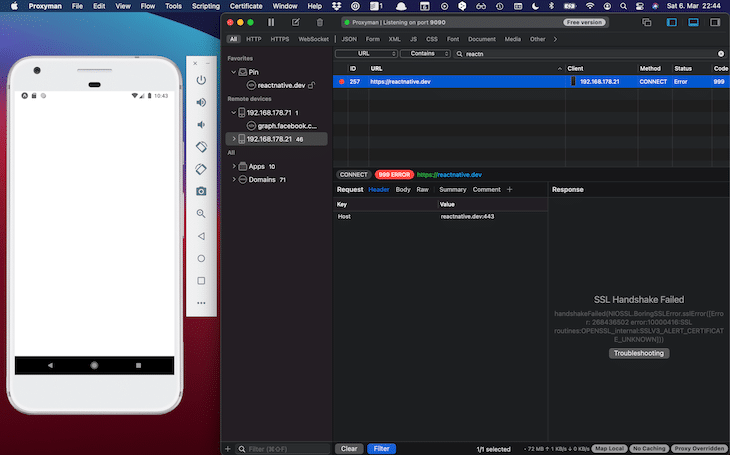
In order to change this, you need to eject from the managed workflow. If you want to stick to this workflow, you just can eject for the debugging session and revert your Git changes after that.
In my current work project, we are developing on a hybrid approach that consists of a natively developed framework with components partly written in React Native. The above security configuration is defined for non-production builds.
I have refrained from this in this article. I describe how to debug network calls for Android with the next tool.
HTTP Toolkit is a nice looking and intuitive tool to intercept, view, and debug HTTP(S) endpoints. You can stub requests and responses to rewrite or redirect your app’s network traffic with your server, or inject errors. It’s available for macOS, Windows, and Linux.
During the preparation of this article, HTTP Toolkit has been the tool working best out of the box — no configuration was necessary. The only restriction is that, at the time of writing, it doesn’t support iOS.
The first step is to open up an Android emulator from Android Studio. Next, start the Metro bundler of your Expo app. Press a to launch the React Native app in the emulator.
I experienced more problems with Android emulators than with iOS simulators. If you cannot get the Expo app running, the easiest way is to remove the Android emulator and create it again from the Android Virtual Device Manager.
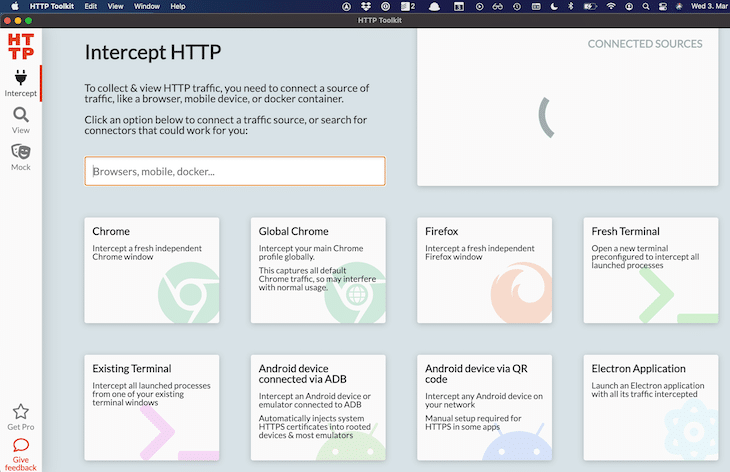
Next, start HTTP Toolkit and click on the option Android device connected via ADB within the Intercept section.
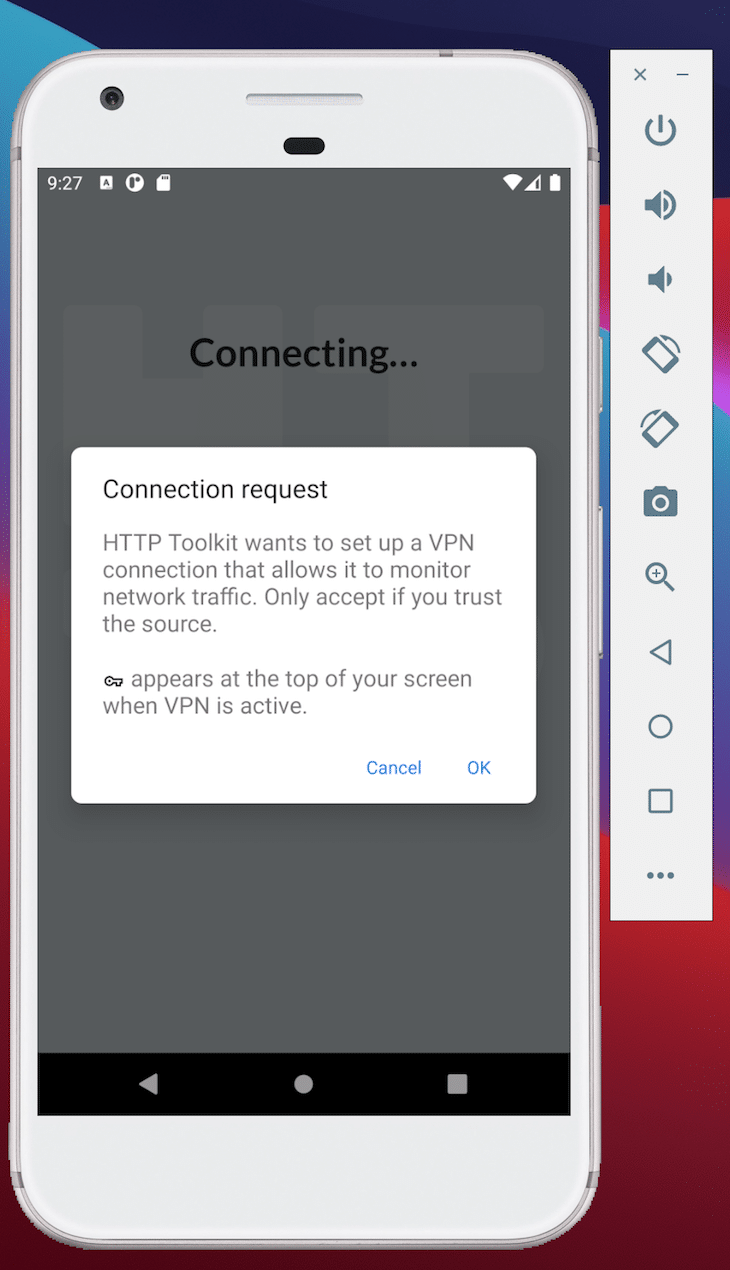
A dialog should pop up on your emulator to establish a VPN connection. Click on OK.
If everything worked out right, then you should see a success message.
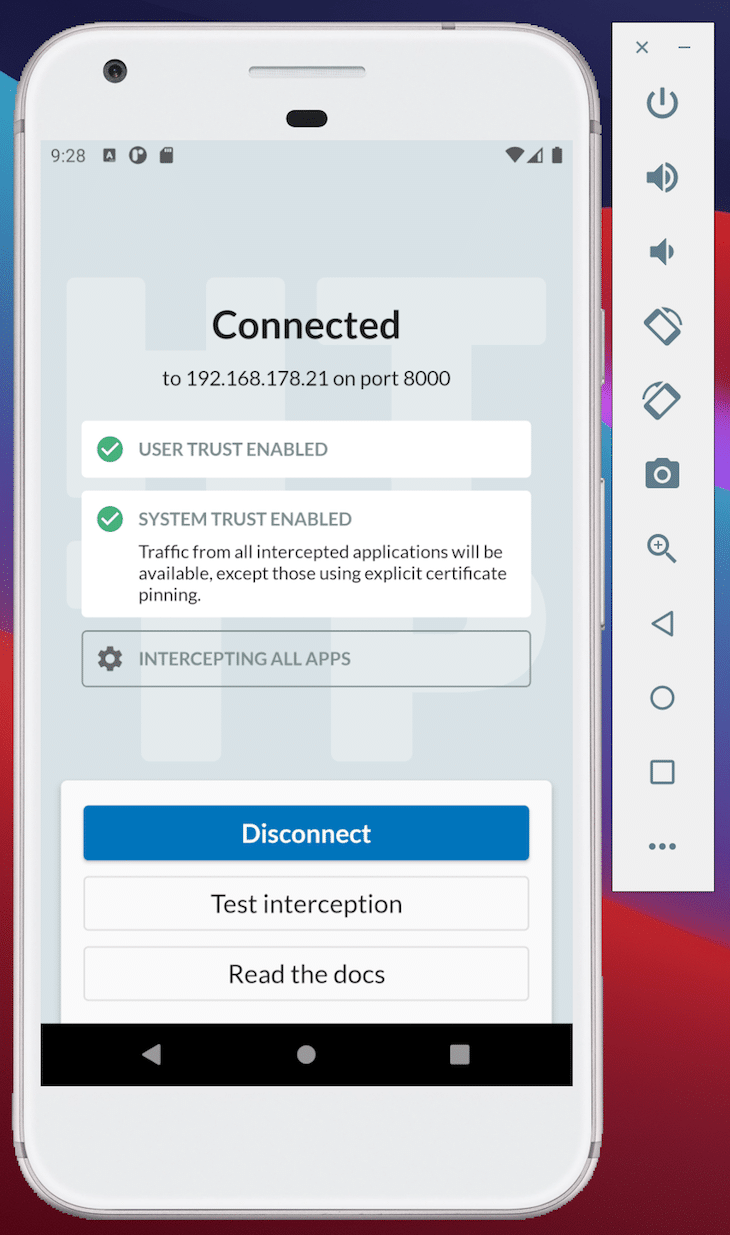
Now you should be up and running. As a first step, switch to the View section in order to monitor the network traffic of your Expo app with the server. In this case, you’re interested in the reactnative.dev endpoint, which you can filter for in the lower part of the UI.
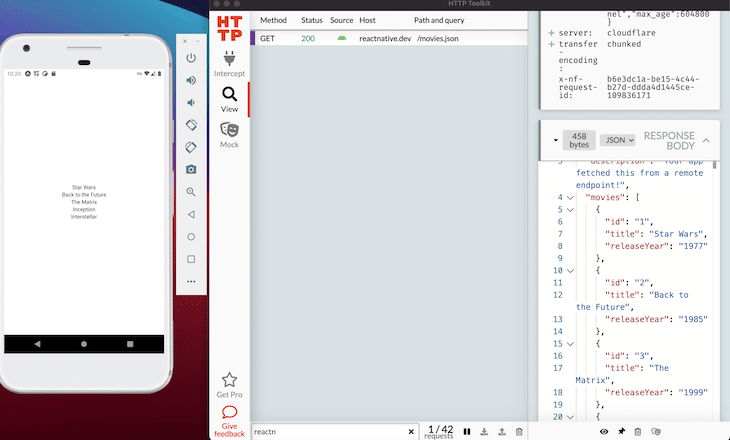
As you can see, without any intervention, the response body of the GET call is decrypted.
During the preparation of this article, I could reliably use HTTP Toolkit to view HTTPS messages with the managed Expo project.
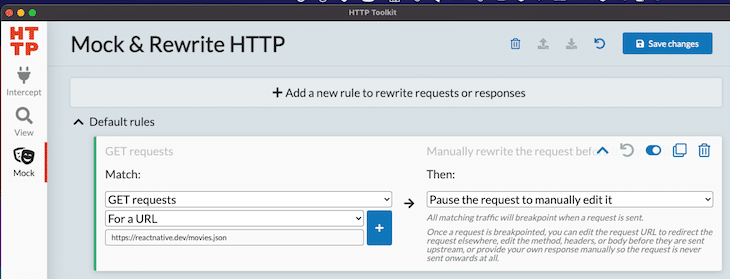
You can define rewrite rules in the Mock. Create a rule to intercept every GET request with the URL https://reactnative.dev/movies.json and create a custom response.
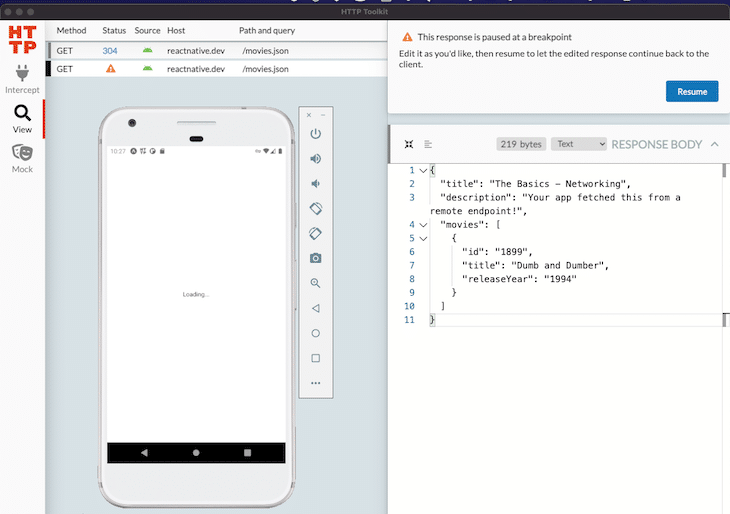
After reloading the app, you can see that the GET request (status code 304) has been paused, and you’ll have a chance to change the response body. While the response is paused, you can debug your app and check whether the loading state is working correct. Change the response to contain only one movie and a status code of 200.
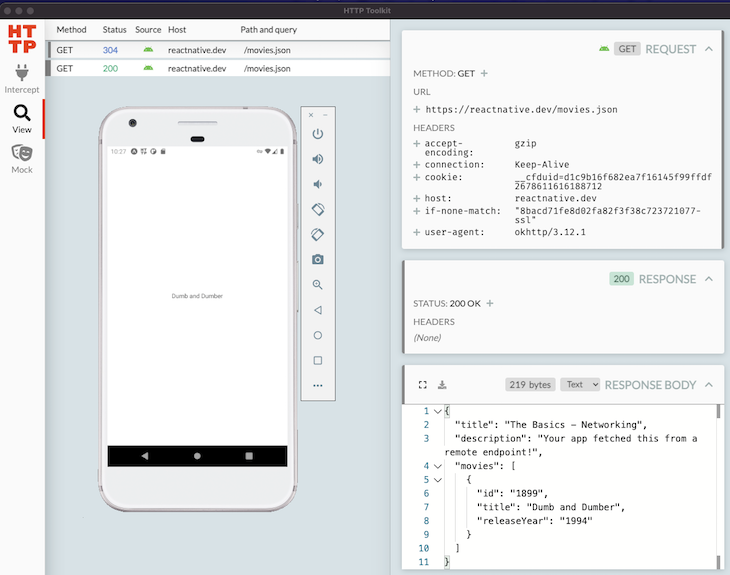
After a click on the Resume button, the app only shows one movie due to the fact that the mocked network call returned with status code 200 and the custom JSON object.
Charles Proxy is a widely used local proxy tool. It’s available for macOS, Windows, and Linux, and it supports iOS and Android. In this article, I describe how to set it up with iOS and skip the Android part since I describe another option with HTTP Toolkit for Android inspection later in this article.
You can use Charles Proxy to intercept, view, and manipulate HTTPS contents. This includes requests, responses, and the HTTP headers. It is especially useful for monitoring your React Native app’s network traffic in the simulator/emulator and on your connected physical device as well.
In my current project, it has allowed me to debug error handling due to server errors. As an example, you can block entire requests to force an error condition.
Charles Proxy is not exclusive for React Native development. There exist many installation guides. Here, I’ll describe how to set it up on a Mac for an Expo project.
After downloading and installing Charles Proxy, you have to grant privileges.

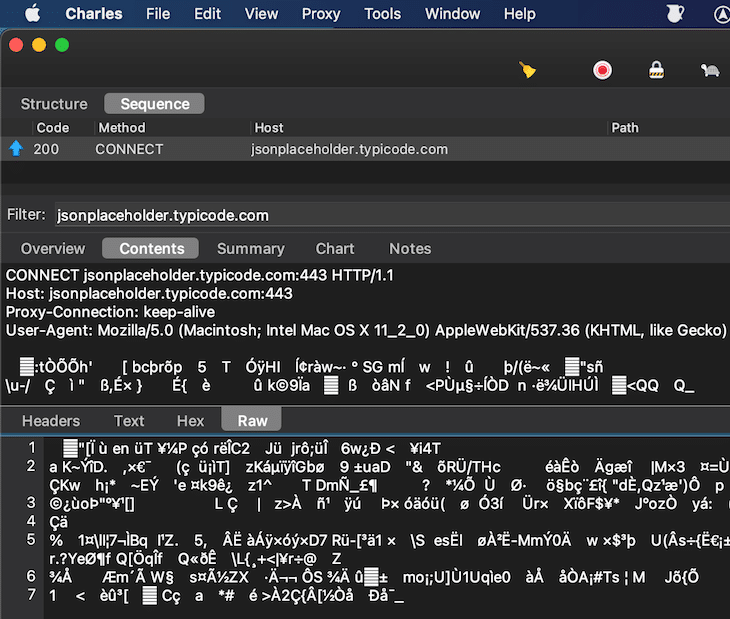
Open up Charles Proxy and you’ll see network traffic popping up in the sequence view. Open this in the browser and filter for jsonplaceholder.typicode.com. Click on the entry and select Contents and Raw. As you can see from the next screenshot, the network content cannot be displayed correctly because it is SSL-encrypted.
To change this, you have to open the Proxy Settings (Proxy > Proxy Settings…, or ⇧⌘L) and add an entry to the SSL entry section.
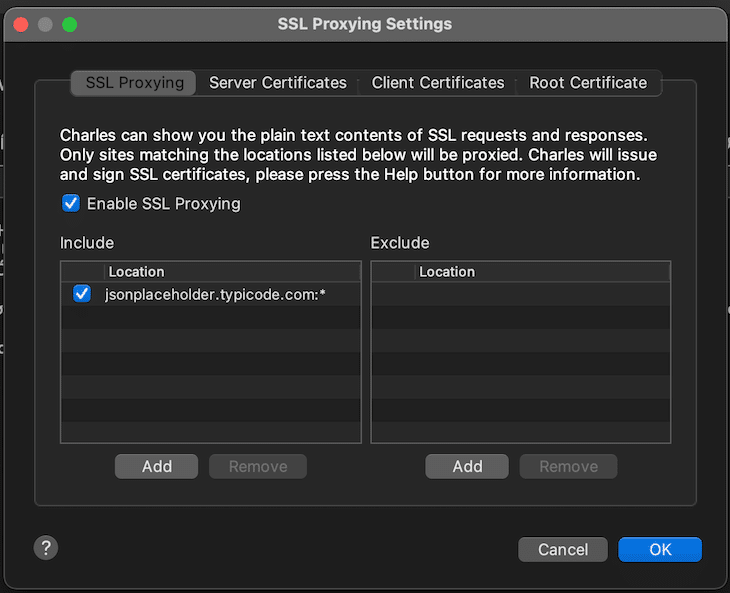
In this example, I only set it up for jsonplaceholder.typicode.com (host jsonplaceholder.typicode.com and port *), but you can also define host * and port *. After ticking the checkbox, reload your page and click on the new entry again.
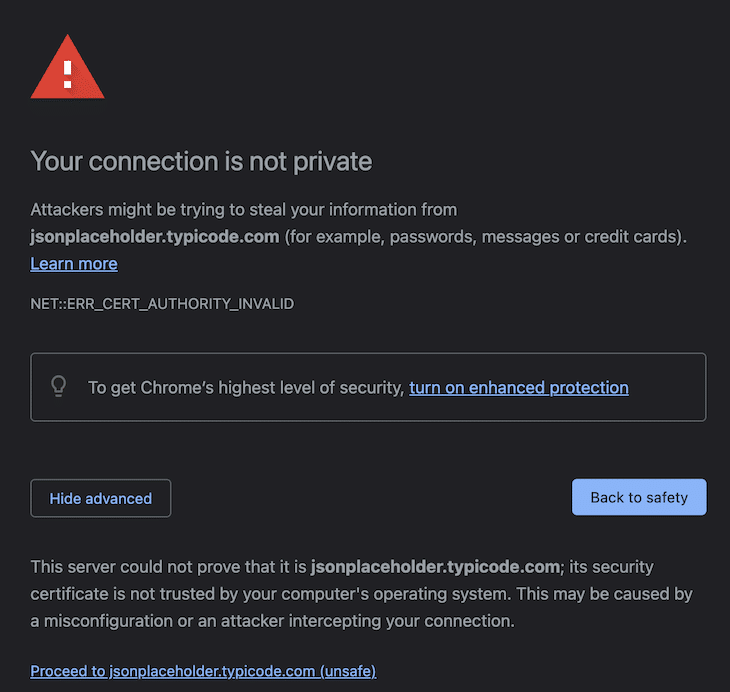
In Chrome, you’ll get a warning that your connection is not private. You need to proceed.
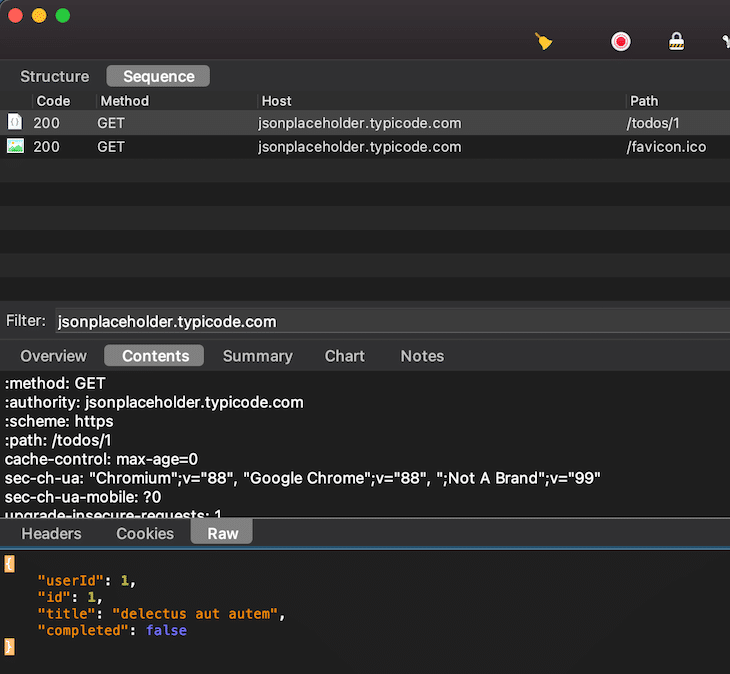
Reload your browser page again, click again on the request, and you can see the content unencrypted.
Right now, if you run your React Native app in the iOS simulator, Charles Proxy does not show the network traffic. We need to install Charles root certificates.
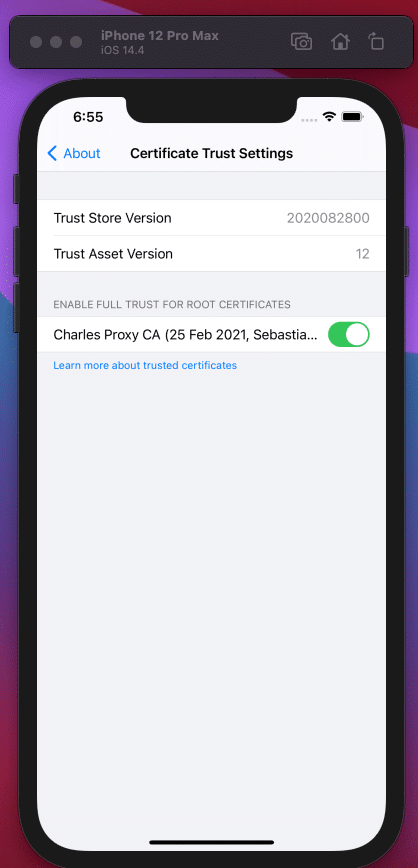
Install the certificate for iOS simulators (Help > SSL Proxying > Install Charles Root Certificate in iOS Simulators). Make sure the macOS proxy is selected as well (Proxy > MacOS proxy) and the certificate is trusted in the iOS simulator (Settings app > General > About > Certificate Trust Settings > Activate Charles Proxy CA).
For debugging error scenarios, it might be useful to add requests to a block list (right-click on Request > Block list).
In the simple example project, I have blocked the reactnative.dev GET call. As you can see from the screenshot, it showed that such errors are not handled correctly and the user has to make do with a blank page.
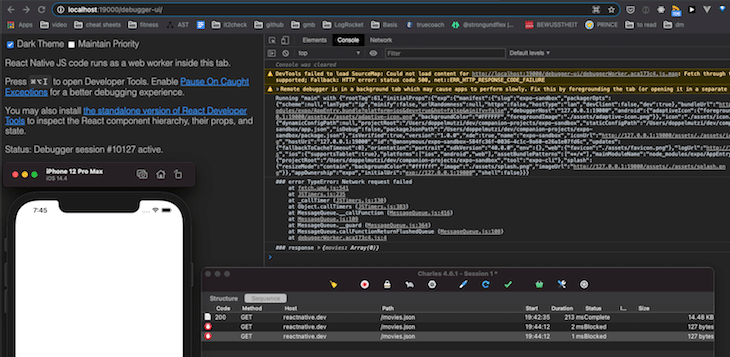
Charles Proxy is pretty powerful. There are many more features (rewriting network calls with map local/remote, breakpoints, or deactivating caching) that I skipped here because I have already showed it in the Proxyman section. It can also be used for debugging Android apps. As with Proxyman, you need to eject from the managed Expo workflow to establish the right security configuration.
There are powerful tools available to React Native developers that extend the shipped dev tools for inspecting and even rewriting network traffic. This is useful for debugging complex client-to-server interactions. This article gives an overview of proxy tools, and there are quite a few choices available — I haven’t even looked at Fiddler yet.
Using proxy tools for iOS development is much easier to configure and less error-prone. In contrast, I had to delete and recreate Android emulators a lot during the preparation of this article. For full-fledged Android debugging, you might not be able to use Expo’s managed workflow because you may need to override Android’s security settings in Android Studio.
From my experience, this is a required step for Proxyman and Charles. With HTTP Toolkit, however, I could view SSL-encrypted network calls out of the box without any extra configuration or ejection from Expo’s managed workflow.
But even if you have to eject from Expo’s workflow, then there’s a solution even for this use case. Revert your Git changes after your debug session is done, and you can continue with your development approach of choice. One last word: make sure you do not use the proxy setup for your production builds.
LogRocket's Galileo AI watches sessions for you and and surfaces the technical and usability issues holding back your React Native apps.
LogRocket also helps you increase conversion rates and product usage by showing you exactly how users are interacting with your app. LogRocket's product analytics features surface the reasons why users don't complete a particular flow or don't adopt a new feature.
Start proactively monitoring your React Native apps — try LogRocket for free.

Learn how AI-assisted development governance uses rules, agents, hooks, and protocols to help AI coding tools produce safer, more consistent code.

A step-by-step guide to building your first MCP server using Node.js, covering core concepts, tool design, and upgrading from file storage to MySQL.

Using security headers in your Next.js apps is a highly effective way to secure websites from common security threats.

A deep dive into May 2026’s AI model and tool rankings. We break down performance, usability, pricing, and real-world capabilities across 50+ features to help you pick the right tools for your development workflow.
Would you be interested in joining LogRocket's developer community?
Join LogRocket’s Content Advisory Board. You’ll help inform the type of content we create and get access to exclusive meetups, social accreditation, and swag.
Sign up now