Editor’s note: This post was updated on 15 December 2021 to reflect updates to Node.js and the Google API’s.

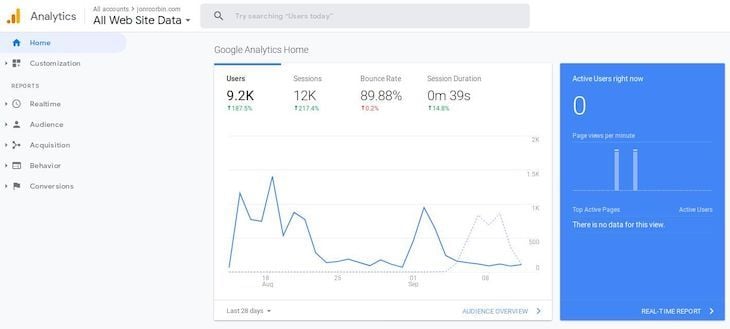
If you’ve ever used Google Analytics, you know it doesn’t provide the cleanest or most visually pleasing interface. Although it gets the job done, it doesn’t provide many options for customization or personalization. Luckily, as software developers, we can build our own version of Google Analytics that is up to our design standards.
In this tutorial, we’ll use several APIs from Google to build our own dashboard in a Node.js project. Let’s get started!
To see the complete source code for this project, check out the GitHub repo.
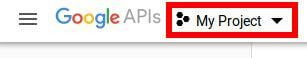
First, set up a Google Developer account if you don’t have one already. Create a new project by clicking on the My Project selection in the top lefthand corner of the page:
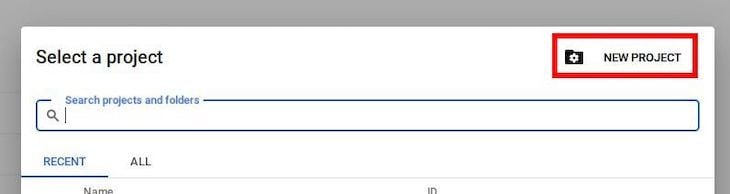
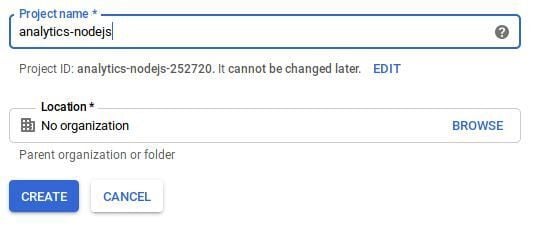
Then, click on NEW PROJECT to create a new project. You can name it whatever you’d like, but I’ll call mine analytics-nodejs:
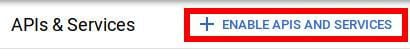
With our new project created, we’ll need to add some services that let us use the Google Analytics API. To do so, we’ll click the + ENABLE APIS AND SERVICES at the top of the page:
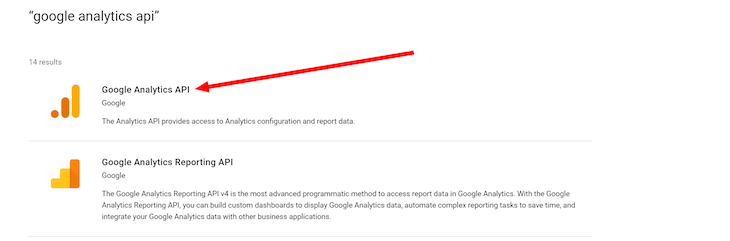
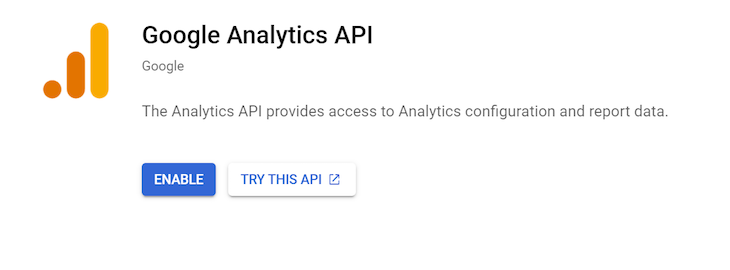
On the APIs & Services page, search for “google analytics api” and add it to your project. Be sure to select and enable the Google Analytics API and not the Google Analytics Reporting API, as demonstrated in the screenshots below:
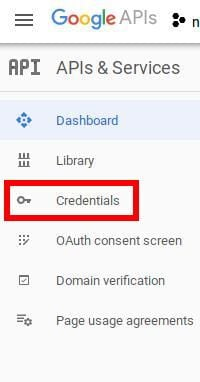
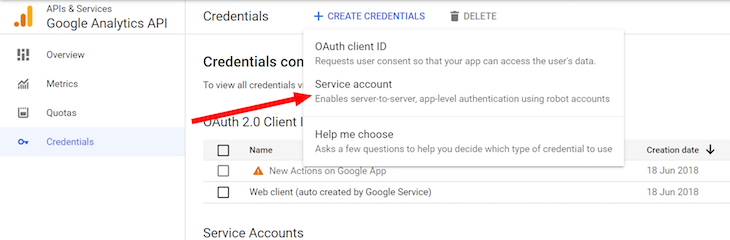
After adding the Analytics API, we need to create a service account so that our app can access the API. To do so, let’s head over to the credentials section from the console homescreen.
Click on the + CREATE CREDENTIALS dropdown and select the Service account key:
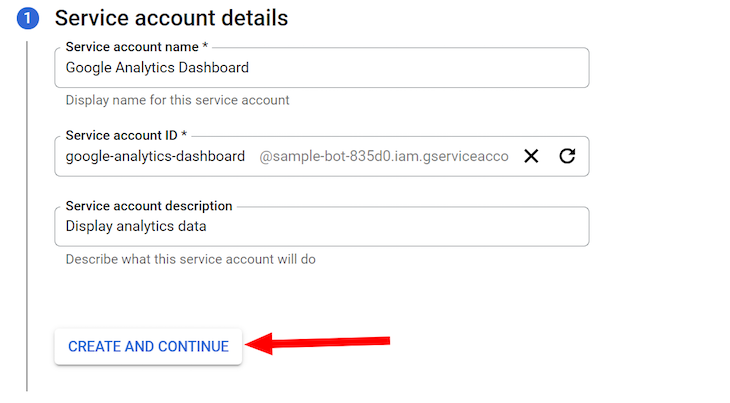
On the next screen, set the Service account name and description as shown below. The Service account ID is set automatically based on the account name. Afterwards, click CREATE AND CONTINUE. You can skip steps 2 and 3, which are optional, and click the DONE button to proceed:
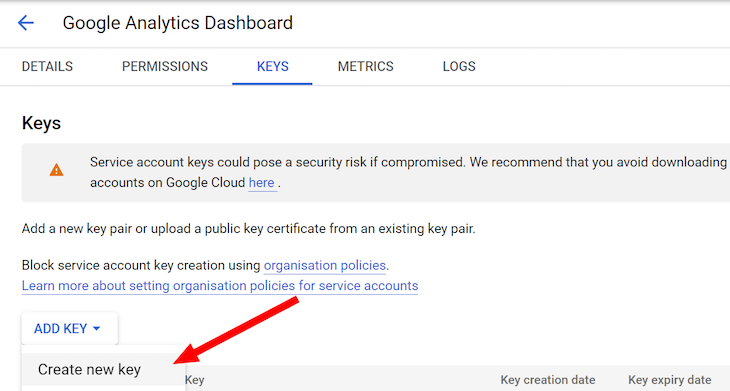
With the service account created, you’ll be redirected to the Credentials page. Click the newly created entry under the SERVICE ACCOUNTS section:

Head over to the KEYS tab and click on Create new key:
Select JSON in the resulting pop up and download the generated file to your computer by clicking the CREATE button:
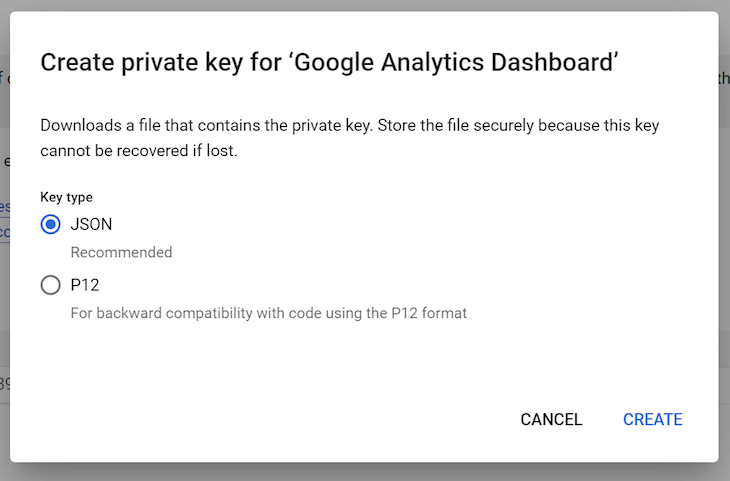
Once you click CREATE, a JSON file will be generated. Save it in a known location because we’ll need to access part of its contents later on.
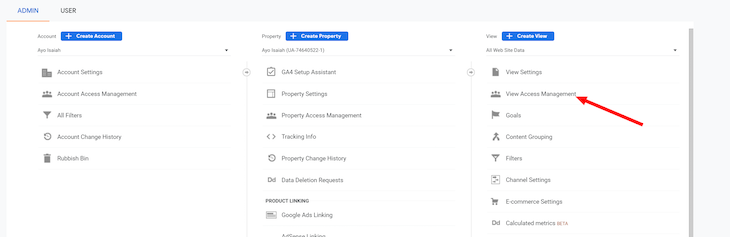
Next, we’ll add a new user to our view in Google Analytics. Click on the Admin option in the lower left-hand corner, then click View Access Management in the View section:
To add a new user, click the blue button with the white + symbol in the upper right-hand corner, then select Add users:

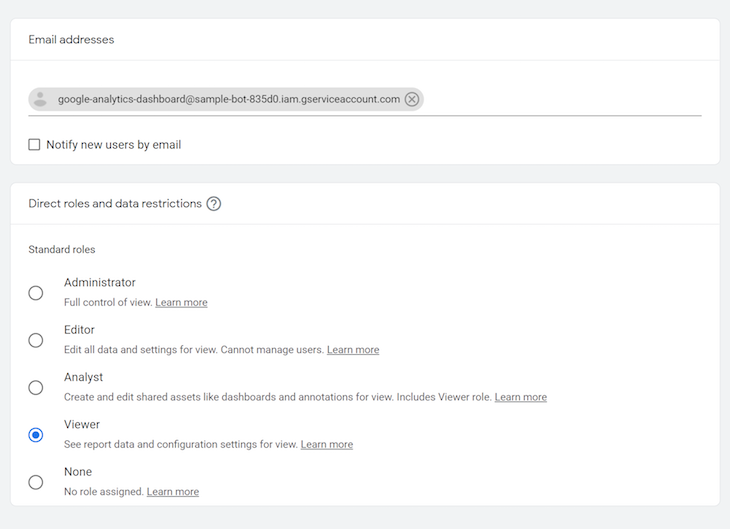
Paste in the value of the client_email field in your JSON file in the email address field, and make sure the role is set to Viewer. Click the Add button in the top right when you’re done:
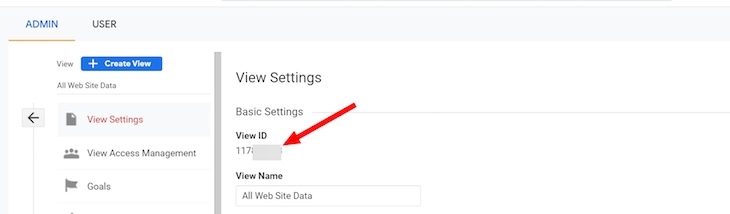
Finally, we need to get the Google Analytics View ID to use on the Node.js backend. From your admin settings, go to View Settings and copy the View ID for later. Better yet, just keep this page open in a separate tab:
Now, your Google APIs should be ready to go!
We’ll use Node.js to set up the server aspects of our application. Let’s start by setting up our project; for this step, I’ll be using the Yarn package manager, but npm should work fine as well.
First, create a new directory on your filesystem, navigate into it, and run yarn init -y to initialize the application with a package.json file. Next, run the command below to install the required dependencies:
$ yarn add cors dotenv express googleapis
We’ll also want to add concurrently and jest to our dev dependencies, which we’ll use in our scripts:
$ yarn add -D concurrently jest
Let’s set our scripts up now. In our package.json file, run the code below:
"scripts": {
    "test_server": "jest ./ --passWithNoTests",
    "test_client": "cd client && yarn test",
    "test": "concurrently \"yarn test_server\" \"yarn test_client\"",
    "start": "concurrently \"npm run server\" \"npm run client\"",
    "server": "node server.js",
    "client": "cd client && npm start",
    "build": "cd client && yarn build"
  },
Finally, create a .env file in the root of your project directory to store the application secrets and configuration:
CLIENT_EMAIL="<the client_email in your json file>"
PRIVATE_KEY="<the private_key in your json file>"
VIEW_ID="<The view id from google analytics you copied down earlier>"
SERVER_PORT=3001
NODE_ENV="dev"
Now, we’re basically ready to start developing our server.
First, create a new server file with touch server.js, then open it in your favorite editor. At the top of the file, we’ll want to define the following:
require('dotenv').config();

// Server
const express = require('express');
const cors = require('cors');
const app = express();
app.use(cors());
const server = require('http').createServer(app);

// Config
const port = process.env.SERVER_PORT;
if (process.env.NODE_ENV === 'production') {
  app.use(express.static('client/build'));
}
We’re going to load in our environmental variables using require('dotenv').config(), which handles the hard work for us, loading our variables from the .env file into process.env for later use.
Next, we define our server using the express package. We add the cors middleware to our Express app so that we can access it from our frontend later. Then, we wrap our app in require('http').createServer so we can add Socket.IO later on.
Finally, we’ll add some configuration by setting a global constant port as a shorthand. We’ll change our static path based on our NODE_ENV variable.
Now, let’s make our server listen to our port by adding the code below to the bottom of our server.js file:
server.listen(port, () => {
  console.log(`Server running at localhost:${port}`);
});
Back in our terminal, let’s create a new directory called libraries/ using mkdir libraries and create our analytics handler, which I’ll call gAnalytics.js. To create our analytics handler, we’ll use touch libraries/gAnalytics.js and then switch back to the editor.
In gAnalytics.js, let’s define the configuration as follows:
// gAnalytics.js
const clientEmail = process.env.CLIENT_EMAIL;
const privateKey = process.env.PRIVATE_KEY.replace(new RegExp('\\\\n'), '\n');
const scopes = ['https://www.googleapis.com/auth/analytics.readonly'];
We need to pull in our client email and private key, which was pulled from the JSON credential file provided by the Google API Console, from the process.env file. We need to replace \\n in our private key, which is how dotenv will read it in, with \n. Finally, we’ll define some scopes for Google APIs. There are quite a few different options here, like the following:
https://www.googleapis.com/auth/analytics to view and manage the data
https://www.googleapis.com/auth/analytics.edit to edit the management entities
https://www.googleapis.com/auth/analytics.manage.users to manage the account users and permissions
Next, let’s set up Google Analytics using those variables:
// gAnalytics.js
const { google } = require('googleapis');
const analytics = google.analytics('v3');
const viewId = process.env.VIEW_ID;
const jwt = new google.auth.JWT({
  email: clientEmail,
  key: privateKey,
  scopes,
});
Here, we required the google module to create analytics and jwt. We also pulled out the analytics viewId from process.env. Subsequently, a JWT is created for authorization purposes when we attempt to retrieve some data.
Now, we need to create functions to actually retrieve the data; let’s start by writing a function that fetches the data from Google Analytics:
// gAnalytics.js
async function getMetric(metric, startDate, endDate) {
  await setTimeout[Object.getOwnPropertySymbols(setTimeout)[0]](
    Math.trunc(1000 * Math.random()),
  );

  const result = await analytics.data.ga.get({
    auth: jwt,
    ids: `ga:${viewId}`,
    'start-date': startDate,
    'end-date': endDate,
    metrics: metric,
  });

  const res = {};
  res[metric] = {
    value: parseInt(result.data.totalsForAllResults[metric], 10),
    start: startDate,
    end: endDate,
  };
  return res;
}
First, we make our code async so that we can fetch many metrics at once. There’s a quota imposed by Google, so we need to add a random wait to it:
await setTimeout[Object.getOwnPropertySymbols(setTimeout)[0]](
  Math.trunc(1000 * Math.random()),
);
If you have many users trying to load data, you could run into scalability issues. However, we’re developing our application for a single user, so this approach will work for now.
We fetch the data using analytics.data.ga.get, which will return a rather large object with a ton of data. We’ll take out the important part, result.data.totalsForAlResults[metric], which is a string that is first converted to an integer before being returned in an object along with the start and end dates.
Next, let’s add a way to get metrics in batches:
// gAnalytics.js
function parseMetric(metric) {
  let cleanMetric = metric;
  if (!cleanMetric.startsWith('ga:')) {
    cleanMetric = `ga:${cleanMetric}`;
  }
  return cleanMetric;
}

function getData(metrics = ['ga:users'], startDate = '30daysAgo', endDate = 'today') {
  // ensure all metrics have ga:
  const results = [];
  for (let i = 0; i < metrics.length; i += 1) {
    const metric = parseMetric(metrics[i]);
    results.push(getMetric(metric, startDate, endDate));
  }

  return results;
}
With the code above, we can easily request multiple metrics at once, returning just a list of getMetric promises. We also add a way to clean up the metric names passed to the function using parseMetric, adding ga: to the front of the metric if it wasn’t there already.
Finally, export getData at the bottom, and our library is good to go:
// gAnalytics.js
module.exports = { getData };
Now, we’ll utilize our library in the application by adding some routes. Open up server.js in your editor and add the following snippet:
// gAnalytics.js
app.get('/api', (req, res) => {
  const { metrics, startDate, endDate } = req.query;
  console.log(`Requested metrics: ${metrics}`);
  console.log(`Requested start-date: ${startDate}`);
  console.log(`Requested end-date: ${endDate}`);

  Promise.all(getData(metrics ? metrics.split(',') : metrics, startDate, endDate))
    .then((data) => {
      // flatten list of objects into one object
      const body = {};
      Object.values(data).forEach((value) => {
        Object.keys(value).forEach((key) => {
          body[key] = value[key];
        });
      });
      res.send({ data: body });
      console.log('Done');
    })
    .catch((err) => {
      console.log('Error:');
      console.log(err);
      res.send({ status: 'Error getting a metric', message: `${err}` });
      console.log('Done');
    });
});
The route allows our client to request a single or a list of metrics, then returns all the data once it’s retrieved, as observed by Promise.all, which waits until either all promises in the given list are completed or until one fails.
We can add a .then method that takes a data param, which is a list of data objects that we created in gAnalytics.getData. In the method, we iterate through all of the objects and combine them into a single body object. The object is sent back to the client in the form res.send({data: body});. We’ve also added a .catch method, which will send back any error message and log the error.
Now let’s add the api/graph/ route, which we’ll use to graph; it will be very similar to our /api path but with its own nuances:
// gAnalytics.js
app.get('/api/graph', (req, res) => {
  const { metric } = req.query;
  console.log(`Requested graph of metric: ${metric}`);
  // 1 week time frame
  let promises = [];
  for (let i = 7; i >= 0; i -= 1) {
    promises.push(getData([metric], `${i}daysAgo`, `${i}daysAgo`));
  }
  promises = [].concat(...promises);
  Promise.all(promises)
    .then((data) => {
      // flatten list of objects into one object
      const body = {};
      body[metric] = [];
      Object.values(data).forEach((value) => {
        body[metric].push(value[metric.startsWith('ga:') ? metric : `ga:${metric}`]);
      });
      console.log(body);
      res.send({ data: body });
      console.log('Done');
    })
    .catch((err) => {
      console.log('Error:');
      console.log(err);
      res.send({ status: 'Error', message: `${err}` });
      console.log('Done');
    });
});
As you can see, we still rely on gAnalytics.getData and Promise.all, but instead, we get the data for the last seven days and compile it into one list to send back in the body.
That’s it for our server! Now, we’ll tackle building the frontend.
Building the frontend is fun but can be quite challenging to develop and design. To build our frontend, we’ll use React.
First, we need to create our boilerplate. We’re going to use the Create React App boilerplate; run npx create-react-app client in the root of your project directory. Once it’s finished, we’ll install our dependencies. Make sure you cd into the client/ folder and then run the command below:
$ yarn add@material-ui/core prop-types recharts
Next, we’ll clean up src/App.js before moving on to the structure. Open up src/App.js and remove everything, leaving behind only the code below:
// client/src/App.js

import React from 'react';
import './App.css';
function App() {
  return (
    <div className="App">
    </div>
  );
}
export default App;
You also need to delete serviceWorker.js and remove it from src/index.js. Afterwards, start the server by running the command below:
$ yarn start
If you’re using Node.js ≥v17, you should edit the start script in your client/package.json file to point to the react-scripts --openssl-legacy-provider start command, avoiding errors.
For our application structure, we’ll set up everything right away and develop afterwards. Our src folder will use the following structure:
├── App.css
├── App.js
├── App.test.js
├── components
│   ├── Dashboard
│   │   ├── DashboardItem
│   │   │   ├── DashboardItem.js
│   │   │   └── DataItems
│   │   │       ├── index.js
│   │   │       ├── ChartItem
│   │   │       │   └── ChartItem.js
│   │   │       └── TextItem
│   │   │           └── TextItem.js
│   │   └── Dashboard.js
│   └── Header
│       └── Header.js
├── index.css
├── index.js
├── theme
│   ├── index.js
│   └── palette.js
└── utils.js
From here on, every file reference will be relative to the src/ folder.
Head back to App.js and edit the folder to look like the code below:
// App.js
import React from 'react';
import './App.css';
import Dashboard from './components/Dashboard/Dashboard';
import { ThemeProvider } from '@material-ui/styles';
import theme from './theme';
import Header from './components/Header/Header';

function App() {
  return (
    <ThemeProvider theme={theme}>
      <div className="App">
        <Header text={"Analytics Dashboard"}/>
        <br/>
        <Dashboard />
      </div>
    </ThemeProvider>
  );
}

export default App;
The code above will pull in the necessary components and create our theme provider. Next, let’s edit that theme by adding the following code to theme/index.js:
import { createMuiTheme } from '@material-ui/core';
import palette from './palette';

const theme = createMuiTheme({
  palette,
});

export default theme;
Open up theme/palette.js and add the following:
import { colors } from '@material-ui/core';

const white = '#FFFFFF';
const black = '#000000';

export default {
  black,
  white,
  primary: {
    contrastText: white,
    dark: colors.indigo[900],
    main: colors.indigo[500],
    light: colors.indigo[100]
  },
  secondary: {
    contrastText: white,
    dark: colors.blue[900],
    main: colors.blue['A400'],
    light: colors.blue['A400']
  },
  text: {
    primary: colors.blueGrey[900],
    secondary: colors.blueGrey[600],
    link: colors.blue[600]
  },
  background: {
    primary: '#f2e1b7',
    secondary: '#ffb3b1',
    tertiary: '#9ac48d',
    quaternary: '#fdae03',
    quinary: '#e7140d',
  },
};
With the code above, we’ve added themes to our components for different styling options. We also defined our theme colors, which you can change for your desired outcome. I went for a pastel theme.
Next, let’s create our header. Open up components/Header/header.js and change it to look like the following:
// components/Header/header.js

import React from 'react';
import PropTypes from 'prop-types';
import { withStyles } from '@material-ui/core/styles';
import Paper from '@material-ui/core/Paper';
import AppBar from '@material-ui/core/AppBar';

const styles = (theme) => ({
  header: {
    padding: theme.spacing(3),
    textAlign: 'center',
    color: theme.palette.text.primary,
    background: theme.palette.background.primary,
  },
});

export const Header = (props) => {
  const { classes, text } = props;
  return (
    <AppBar position="static">
      <Paper className={classes.header}>{text}</Paper>
    </AppBar>
  );
};

Header.propTypes = {
  classes: PropTypes.object.isRequired,
  text: PropTypes.string.isRequired,
};

export default withStyles(styles)(Header);
The code above will create a horizontal bar at the top of our page with the text being whatever we set the prop to. It also pulls in our styling, providing a visually pleasing outcome.
Now, let’s work on components/Dashboard/Dashboard.js, a much simpler component:
// components/Dashboard/Dashboard.js

import React from 'react';
import PropTypes from 'prop-types';
import { withStyles } from '@material-ui/core/styles';
import Grid from '@material-ui/core/Grid';
import DashboardItem from './DashboardItem/DashboardItem';
import { isMobile } from '../../utils';

const styles = () => ({
  root: {
    flexGrow: 1,
    overflow: 'hidden',
  },
});

const Dashboard = (props) => {
  const { classes } = props;

  return (
    <div className={classes.root}>
      <Grid container direction={isMobile ? 'column' : 'row'} spacing={3} justify="center" alignItems="center">
        <DashboardItem size={9} priority="primary" metric="Users" visual="chart" type="line" />
        <DashboardItem size={3} priority="secondary" metric="Sessions"/>
        <DashboardItem size={3} priority="primary" metric="Page Views"/>
        <DashboardItem size={9} metric="Total Events" visual="chart" type="line"/>
      </Grid>
    </div>
  );
};

Dashboard.propTypes = {
  classes: PropTypes.object.isRequired,
};

export default withStyles(styles)(Dashboard);
We add a few Dashboard Items as examples with different metrics from the Google Analytics API. We also need to create a utils.js file containing the following:
// utils.js
export function numberWithCommas(x) {
  return x.toString().replace(/\B(?=(\d{3})+(?!\d))/g, ',');
}

export const isMobile = window.innerWidth <= 500;
The code above will tell us if the user is on mobile or not. We want a responsive app, so we need to know whether the user is on mobile.
We have the DashboardItem component, which we will create by editing components/Dashboard/DashboardItem/DashboardItem.js. Go ahead and add the following code:
// components/Dashboard/DashboardItem/DashboardItem.js

import React, { Component } from 'react';
import PropTypes from 'prop-types';
import { withStyles } from '@material-ui/core/styles';
import Paper from '@material-ui/core/Paper';
import Grid from '@material-ui/core/Grid';
import { TextItem, ChartItem, RealTimeItem } from './DataItems';
import { numberWithCommas, isMobile } from '../../../utils';

const styles = (theme) => ({
  paper: {
    marginLeft: theme.spacing(1),
    marginRight: theme.spacing(1),
    paddingTop: theme.spacing(10),
    textAlign: 'center',
    color: theme.palette.text.primary,
    height: 200,
    minWidth: 300,
  },
  chartItem: {
    paddingTop: theme.spacing(1),
    height: 272,
  },
  mainMetric: {
    background: theme.palette.background.quaternary,
  },
  secondaryMetric: {
    background: theme.palette.background.secondary,
  },
  defaultMetric: {
    background: theme.palette.background.tertiary,
  },
});

class DashboardItem extends Component {
  constructor(props) {
    super(props);
    const {
      classes,
      size,
      metric,
      priority,
      visual,
      type,
    } = this.props;
    this.state = {
      classNames: classes,
      size,
      metric,
      priority,
      visual,
      type,
      data: 'No data',
    };
  }

  componentDidMount() {
    this.getMetricData();
    this.getClassNames();
  }

  getMetricData() {
    const { visual, metric } = this.state;
    const strippedMetric = metric.replace(' ', '');

    let url;
    if (visual === 'chart') {
      url = `http://localhost:3001/api/graph?metric=${strippedMetric}`;
    } else {
      url = `http://localhost:3001/api?metrics=${strippedMetric}`;
    }

    fetch(url, {
      method: 'GET',
      mode: 'cors',
    })
      .then((res) => (res.json()))
      .then((data) => {
        let value;
        let formattedValue;
        if (visual === 'chart') {
          value = data.data[strippedMetric];
          formattedValue = value;
        } else {
          try {
            value = strippedMetric.startsWith('ga:') ? data.data[strippedMetric] : data.data[`ga:${strippedMetric}`];
            formattedValue = numberWithCommas(parseInt(value.value, 10));
          } catch (exp) {
            console.log(exp);
            formattedValue = "Error Retrieving Value"
          }
        }
        this.setState({ data: formattedValue });
      });
  }

  getClassNames() {
    const { priority, visual } = this.state;
    const { classes } = this.props;
    let classNames = classes.paper;
    switch (priority) {
      case 'primary':
        classNames = `${classNames} ${classes.mainMetric}`;
        break;
      case 'secondary':
        classNames = `${classNames} ${classes.secondaryMetric}`;
        break;
      default:
        classNames = `${classNames} ${classes.defaultMetric}`;
        break;
    }
    if (visual === 'chart') {
      classNames = `${classNames} ${classes.chartItem}`;
    }
    this.setState({ classNames });
  }

  getVisualComponent() {
    const { data, visual, type } = this.state;
    let component;
    if (data === 'No data') {
      component = <TextItem data={data} />;
    } else {
      switch (visual) {
        case 'chart':
          component = <ChartItem data={data} xKey='start' valKey='value' type={type} />;
          break;
        default:
          component = <TextItem data={data} />;
          break;
      }
    }
    return component;
  }

  render() {
    const {
      classNames,
      metric,
      size,
    } = this.state;
    const visualComponent = this.getVisualComponent();
    return (
      <Grid item xs={(isMobile || !size) ? 'auto' : size} zeroMinWidth>
        <Paper className={`${classNames}`}>
          <h2>{ metric }</h2>
          {visualComponent}
        </Paper>
      </Grid>
    );
  }
}

DashboardItem.propTypes = {
  size: PropTypes.number,
  priority: PropTypes.string,
  visual: PropTypes.string,
  type: PropTypes.string,
  classes: PropTypes.object.isRequired,
  metric: PropTypes.string.isRequired,
};

DashboardItem.defaultProps = {
  size: null,
  priority: null,
  visual: 'text',
  type: null,
};

export default withStyles(styles)(DashboardItem);
The component is pretty massive, but it’s the bread and butter of our application, allowing us to have a highly customizable interface. Depending on the props passed, we can change the size, color, and type of visual. The DashboardItem component also fetches the data for itself, then passes it to its visual component. Let’s create those now!
DataItemsFor our DashboardItem to render properly, we need to create both the ChartItem and TextItem. Open up components/Dashboard/DashboardItem/DataItems/TextItem/TextItem.js and add the following to it:
// components/Dashboard/DashboardItem/DataItems/TextItem/TextItem.js

import React from 'react';
import PropTypes from 'prop-types';

export const TextItem = (props) => {
  const { data } = props;
  let view;

  if (data === 'No data') {
    view = data;
  } else {
    view = `${data} over the past 30 days`
  }

  return (
    <p>
      {view}
    </p>
  );
};

TextItem.propTypes = {
  data: PropTypes.string.isRequired,
};

export default TextItem;
The code above basically displays the text passed to it as the data prop. Now, let’s do the ChartItem by opening up components/Dashboard/DashboardItem/DataItems/ChartItem/ChartItem.js and adding the following code into it:
// components/Dashboard/DashboardItem/DataItems/ChartItem/ChartItem.js

import React from 'react';
import PropTypes from 'prop-types';
import {
  ResponsiveContainer, LineChart, XAxis, YAxis, CartesianGrid, Line, Tooltip,
} from 'recharts';

export const ChartItem = (props) => {
  const { data, xKey, valKey } = props;

  return (
    <ResponsiveContainer height="75%" width="90%">
      <LineChart data={data}>
        <XAxis dataKey={xKey} />
        <YAxis type="number" domain={[0, 'dataMax + 100']} />
        <Tooltip />
        <CartesianGrid stroke="#eee" strokeDasharray="5 5" />
        <Line type="monotone" dataKey={valKey} stroke="#8884d8" />
      </LineChart>
    </ResponsiveContainer>
  );
};

ChartItem.propTypes = {
  data: PropTypes.array.isRequired,
  xKey: PropTypes.string,
  valKey: PropTypes.string,
};

ChartItem.defaultProps = {
  xKey: 'end',
  valKey: 'value',
};

export default ChartItem;
The code above will do exactly what it sounds like it does, render a chart. It uses the api/graph/ route that we added to our server earlier. Now, you need to run yarn start from the topmost directory and everything should boot up just fine.
One of the best parts of Google Analytics is the ability to see who is using your site in real time. We can do that in our application, too.
Sadly, at the time of writing, Google APIs has the Realtime API as a closed beta, but again, we’re software developers! Let’s make our own.
We’ll use Socket.IO because it allows for real-time communications between machines. First, add Socket.IO to your dependencies with yarn add socket.io. Now, open up your server.js file and add the following to the top of it:
const io = require('socket.io').listen(server);
You can add this just below the server definition. At the bottom of the file above server.listen, add the following snippet:
io.sockets.on('connection', (socket) => {
  socket.on('message', (message) => {
    console.log('Received message:');
    console.log(message);
    console.log(Object.keys(io.sockets.connected).length);
    io.sockets.emit('pageview', { connections: Object.keys(io.sockets.connected).length - 1 });
  });
});
The code above will allow our server to listen for sockets connecting to it and sending it a message. When it receives a message, it will then emit a 'pageview' event to all the sockets. Note that doing so isn’t usually best practice on account of safety concerns, but we’re only sending out the number of connections, which isn’t important information.
For our clients to send our server a message, they need a script! Let’s create a script in client/public called realTimeScripts.js, which will contain the following:
const socket = io.connect();

socket.on('connect', function() {
  socket.send(window.location);
});
We need to reference these two scripts in any of our webpages, and the connection will be tracked:
<script src="/socket.io/socket.io.js"></script>
<script src="realTimeScripts.js"></script>
The /socket.io/socket.io.js is handled by the installation of socket.io, so there is no need to create this.
To view these connections, we need a new component. Let’s first edit DashboardItem.js by adding the following to getMetricData:
    //...
    const strippedMetric = metric.replace(' ', '');
    // Do not need to retrieve metric data if metric is real time, handled in component
    if (metric.toUpperCase() === "REAL TIME") {
      this.setState({ data: "Real Time" })
      return;
    }
    //...
The code above will set our state and return us out of the getMetricData function because we don’t need to fetch anything. Next, let’s add the following to getVisualComponent:
    //...
      component = <TextItem data={data} />;
    } else if (data === 'Real Time') {
      component = <RealTimeItem />
    } else {
      switch (visual) {
    //...
Now our visual component will be set to our RealTimeItem when the metric prop is "Real Time".
We need to create the RealTimeItem component. Create the components/``Dashboard/DashboardItem/DataItems/RealTimeItem/RealTimeItem.js path and file. Now, add the following to it:
// components/Dashboard/DashboardItem/DataItems/RealTimeItem/RealTimeItem.js

import React, { useState } from 'react';
import openSocket from 'socket.io-client';
const socket = openSocket('http://localhost:3001');
const getConnections = (cb) => {
  socket.on('pageview', (connections) => cb(connections.connections))
}

export const RealTimeItem = () => {
  const [connections, setConnections] = useState(0);
  getConnections((conns) => {
    console.log(conns);
    setConnections(conns);
  });

  return (
    <p>
      {connections}
    </p>
  );
};

export default RealTimeItem;
Doing so will add a real-time card to our dashboard. At this point, you should now have a fully functional dashboard that looks like this:
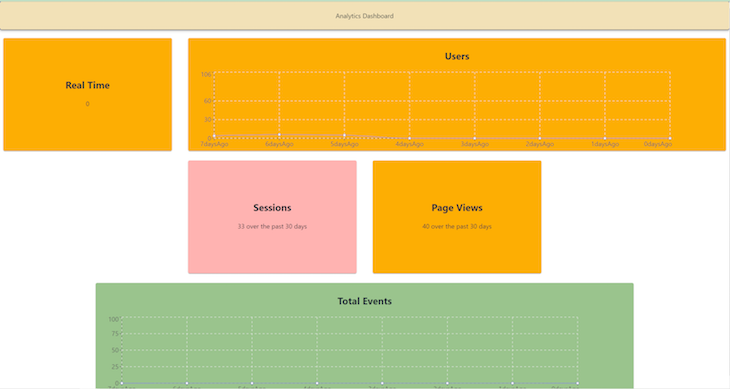
This is meant to be a highly extendable dashboard where you can add new data items in a similar way to how we added the real-time component.
In this tutorial, we built our own replica of the Google Analytics API using Node.js, adding our own customizations and personalizations. You can continue to develop our dashboard further by adding the ability to change sizes, switch between different chart types, and more!
Would you be interested in joining LogRocket's developer community?
Join LogRocket’s Content Advisory Board. You’ll help inform the type of content we create and get access to exclusive meetups, social accreditation, and swag.
Sign up now
Learn how OpenAPI can automate API client generation to save time, reduce bugs, and streamline how your frontend app talks to backend APIs.

Discover how the Interface Segregation Principle (ISP) keeps your code lean, modular, and maintainable using real-world analogies and practical examples.

<selectedcontent> element improves dropdowns

Learn how to implement an advanced caching layer in a Node.js app using Valkey, a high-performance, Redis-compatible in-memory datastore.


3 Replies to "Build a Google Analytics dashboard clone in Node.js"
I have to say this is a great work well written and I learnt a lot please continue
where are the codes for DataItems/index.js ????
Just wanted to say this is a fantastic guide to get started thank you! Really helped me identify some data i need to start building my own api