Today’s users expect fast, smooth experiences by default. Performance is no longer just a “nice to have”; it’s a real product advantage that directly impacts retention, conversions, and revenue.
The challenge is that debugging performance issues can feel overwhelming because there are so many reasons an app might be slow.
In this guide, I’ll share a step-by-step framework for optimizing React apps from bundle analysis all the way to server-side rendering. Following these four phases can help you cut LCP from 28 seconds to about one second (that’s over 93%!), without sacrificing code quality or developer experience.
We’ll use a video player app as our example and improve its performance phase by phase. You can grab the code repo here. This guide is also available as a video:
The Replay is a weekly newsletter for dev and engineering leaders.
Delivered once a week, it's your curated guide to the most important conversations around frontend dev, emerging AI tools, and the state of modern software.
Before we change anything, we need to know what we’re working with.
Start by getting baseline numbers in Chrome DevTools → Performance. Throttle the network to Slow 4G and disable cache so the results actually reflect real user conditions.
Record a normal user flow in your app and watch the key metrics:
These numbers make it easy to spot what’s slowing things down. Here’s what we’re starting with: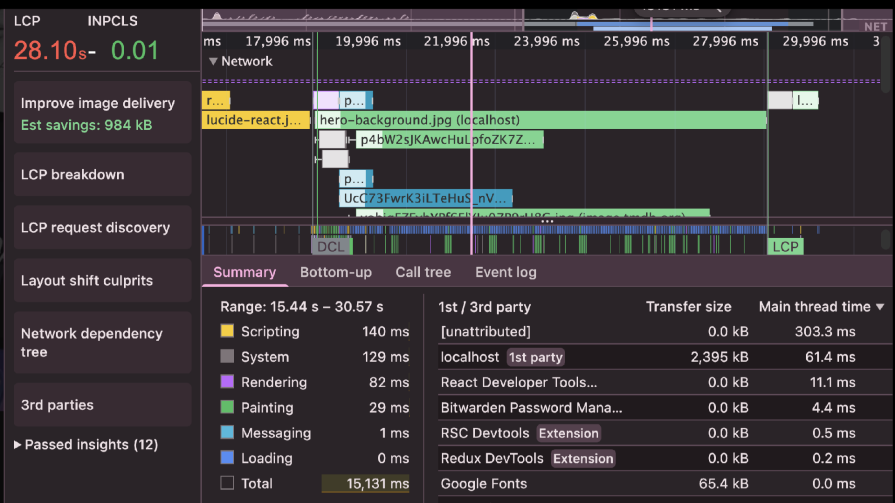
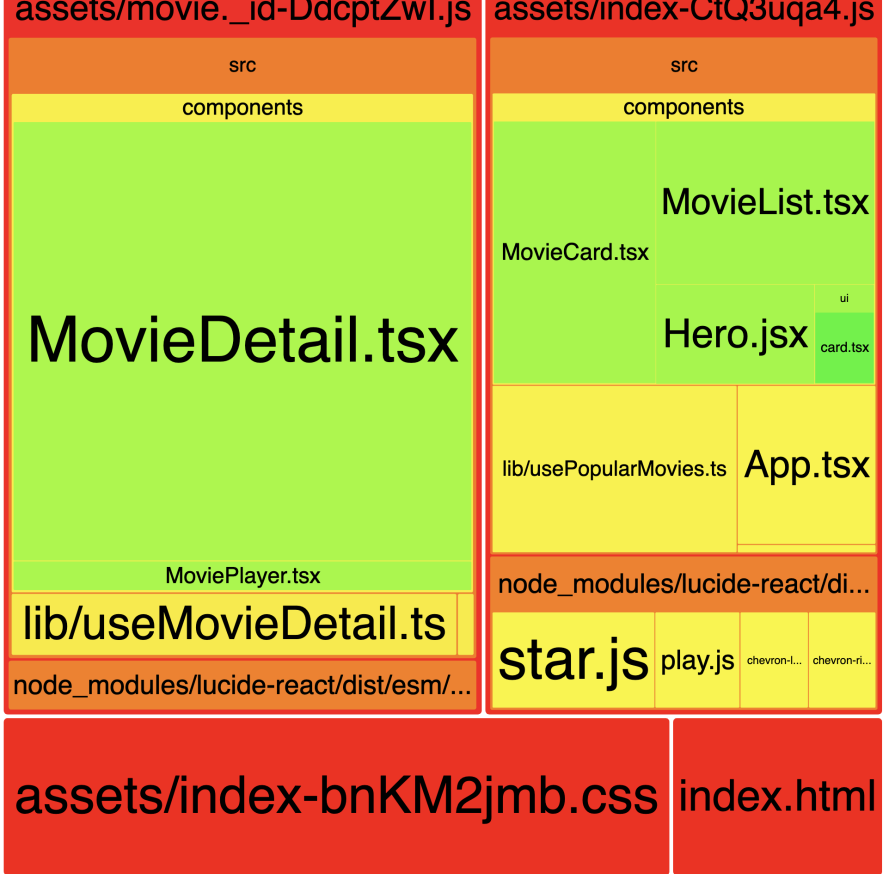
The first step in optimization is knowing what you’re actually shipping to users. Before changing code, look at your bundle to analyze areas that need improvement:
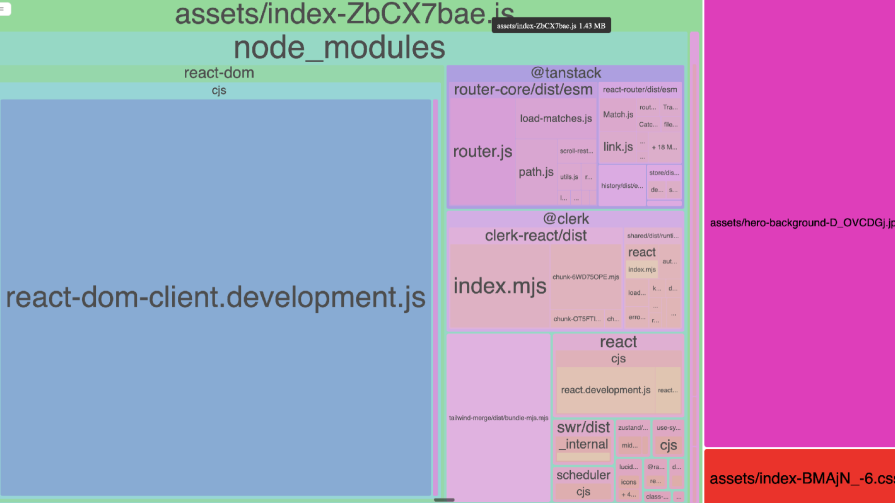
 Looking at this, we know that some node modules are taking a large chunk, along with our hero image. Thankfully, our source folder is a tiny sliver.
//vite.config.ts

  build: {
    outDir: "dist",
    emptyOutDir: true,
    sourcemap: true,
    minify: true,
    cssMinify: true,
    terserOptions: { compress: false, mangle: false },
  },
  // ...
   tanstackRouter({
      target: 'react',
      autoCodeSplitting: false,
    }),
   // …
When we zoom into the bundle analyzer into the source components, we might notice that some components take up a lot of bundle size. We can optimize the performance by lazy loading these components to ensure that they only get imported if they are actually navigated to:
//MovieList.tsx

import { lazy } from "react";
const MovieCard = lazy(() => import('@/components/MovieCard'))
npx depcheck to identify unused node modules in your package.json. Depcheck scans your codebase and reports packages that aren’t actually imported anywhere, allowing you to safely remove them and reduce your bundle size: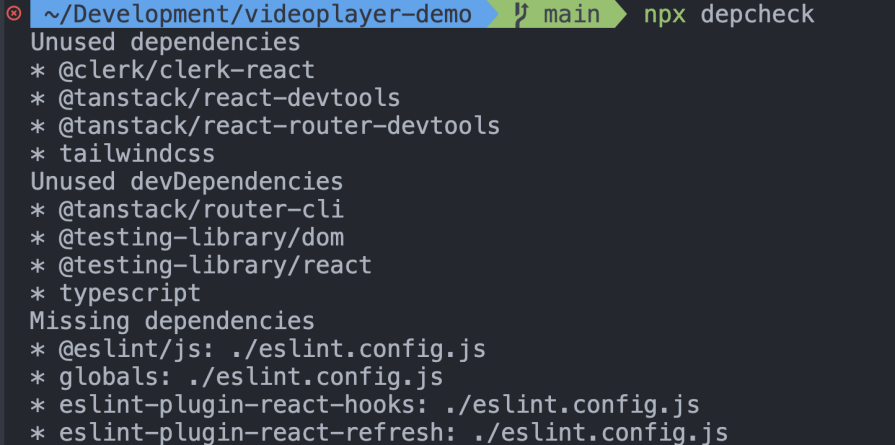
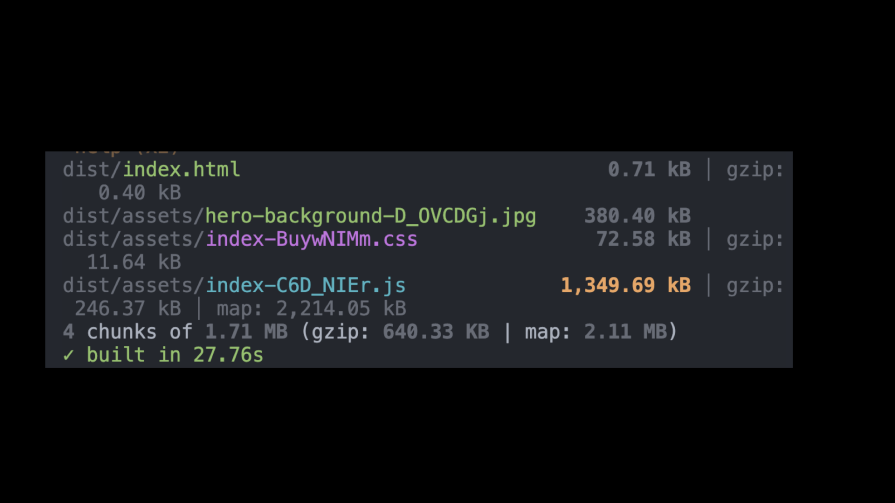
To check if the changes we have made have actually helped, we must measure again. We can check this by rebuilding using npm run build: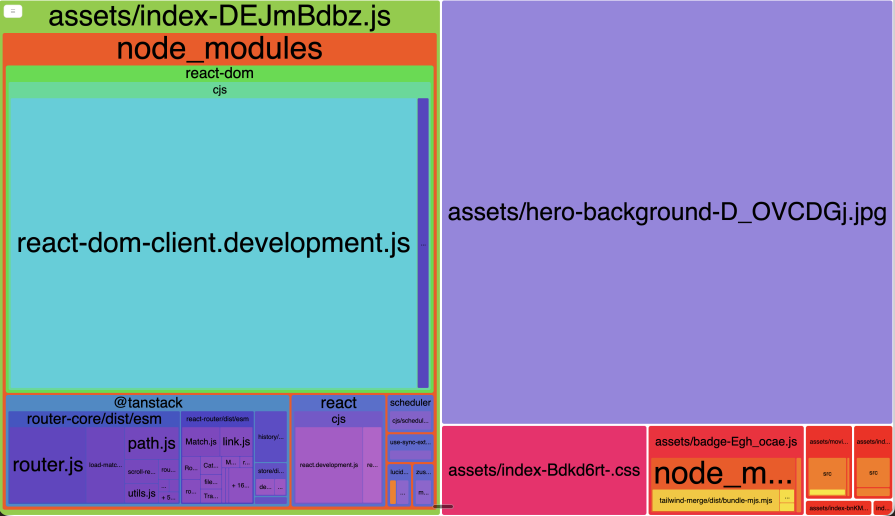
 Impact: Just by code splitting, removing unnecessary node modules, and minifying files, we are able to get the bundle size down from 1.71MB to 890KB! The LCP also went down from 28.10 seconds to 21.56 seconds!:
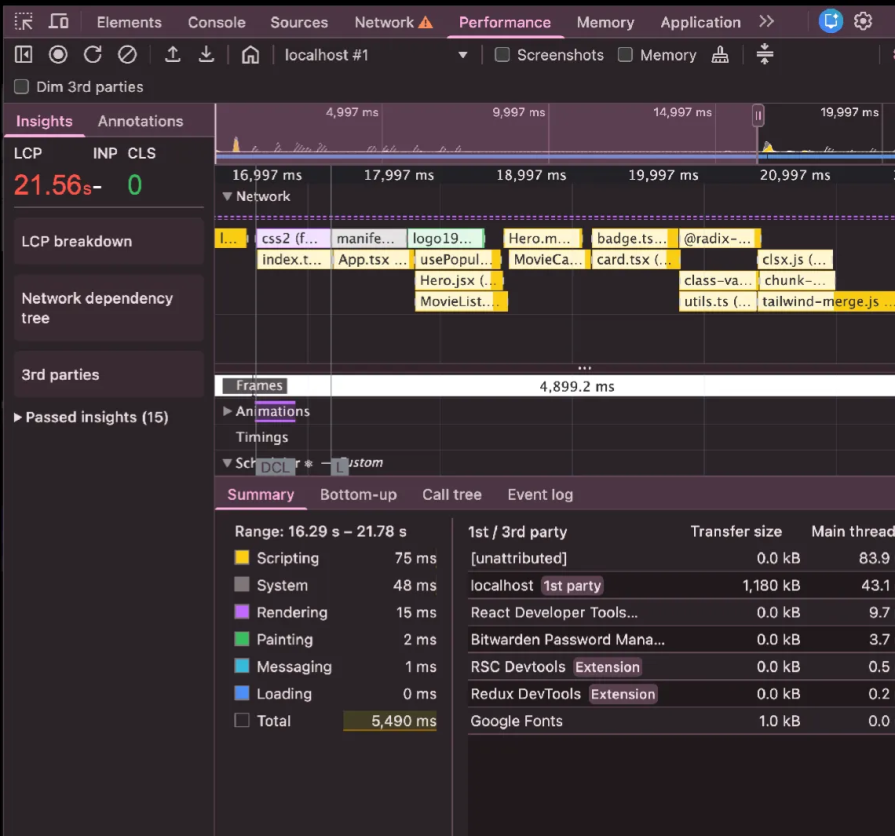
Now let’s get to the fun part, where we optimize the React components.
Before the React Compiler, you had to manually find performance bottlenecks and optimize your components by adding memoization with useMemo and useCallback.
But modern React development indeed gives us React Compiler, which can handle many performance optimizations automatically.
On top of that, newer performance monitoring tools like the custom React Performance tracks make it much easier to understand what’s happening and identify what’s actually causing slow renders.
Before we start optimizing, let’s first look at the tools we have available today –
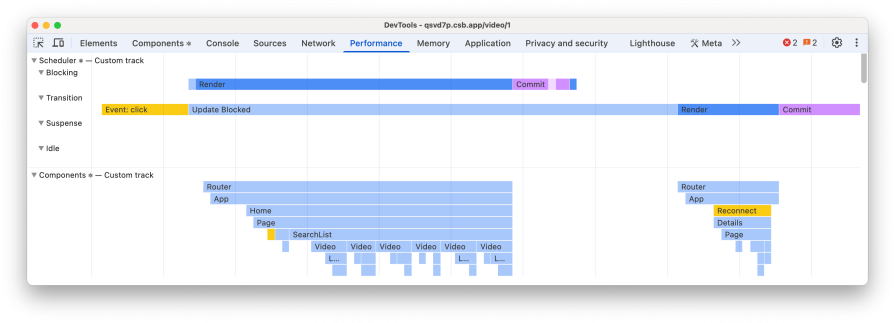
React 19 introduces custom Performance tracks that level up performance profiling by integrating right within the Chrome DevTools Performance panel, so you can debug real render-time bottlenecks instead of guessing which components are taking longer.
It shows how much time each component spends in the four phases of the React component life cycle:
The trace helps you correlate those long tasks back to the specific component work and hook logic responsible, so you can quickly isolate expensive render paths, unnecessary recomputation, and avoidable re-renders:
React Compiler changes how we approach memoization today. Pre-React-Compiler, developers manually wrapped components in React.memo and callbacks in useMemo and useCallback to prevent unnecessary re-renders.
This approach was error-prone and required a lot of manual effort to identify which components actually needed memoization. Even with manual memoization, it was easy to miss components and parts of the app that were slow.
The React Compiler, added as a Babel plugin to your build pipeline, automatically analyzes your components and applies memoization based on the Rules of React. It understands React’s rendering behavior and can make smarter decisions than manual optimization, often outperforming hand-optimized code.
To get started, install the compiler and add it to your Babel configuration:
npm install -D babel-plugin-react-compiler@latest
and then update Vite config:
// vite.config.js
import { defineConfig } from 'vite';
import react from '@vitejs/plugin-react';

export default defineConfig({
  plugins: [
    react({
      babel: {
        plugins: ['babel-plugin-react-compiler'],
      },
    }),
  ],
});
Now, when you open your components in the React profiler, you will notice a ✨ next to components that are memoized by the compiler: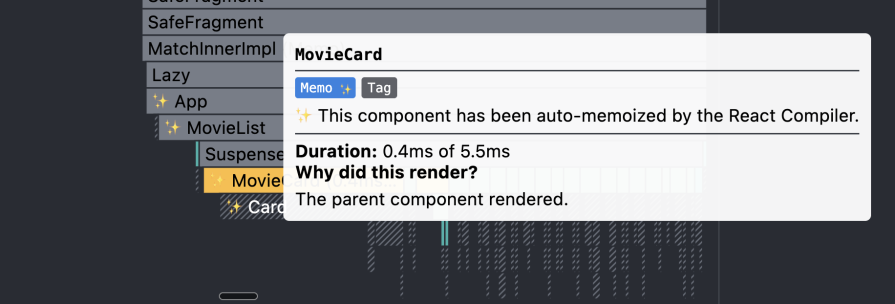
Although this was introduced a long time ago, it is still really helpful in understanding how many times the component re-renders and which components are re-rendering. We’ll also be using this in addition to the React Compiler and performance tracks to find out the slow components
While using React Profiler, we are going to measure the most common UX a user would go through. Here’s the flow we will measure:
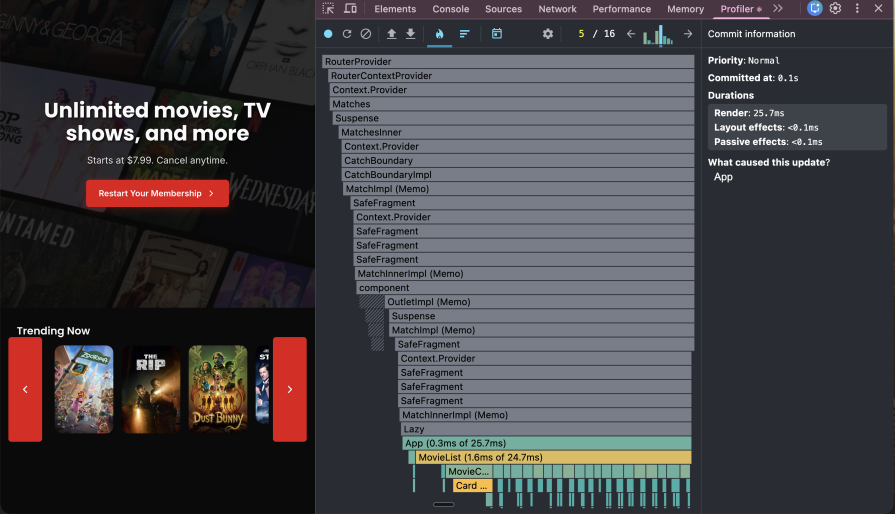
You can see at the top right corner that the app re-rendered 16 times in this UX flow: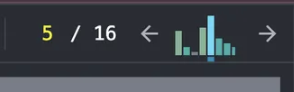
The highest bar is for the movie list component that took 25 milliseconds to render. This gives us insight into which component is the slowest and re-renders the most.
With React Compiler, you don’t have to manually add useMemo / useCallback. It can automatically reduce unnecessary re-renders and recomputation, so you can focus on fixing the code issues.
useEffectuseEffects can cause a lot of unnecessary re-renders. When possible, avoid using useEffect, and ensure that useEffects are cleaned up properly and do not cause infinite state updates. I dive deeper into the most common useEffect mistakes in this blog post, and the video below:
A common mistake is defining functions inside component bodies that don’t belong there, such as a utility component. The problem is that every time the component renders, these functions are recreated from scratch, even though their implementation never changes. This creates unnecessary work for the JavaScript engine.
Move utility functions outside the component or into a separate utilities file:
    const formatRuntime = (minutes: number) => {
        const hours = Math.floor(minutes / 60);
        const mins = minutes % 60;
        return `${hours}h ${mins}m`;
    };
Big components that users don’t see right away are great candidates for lazy loading. Things like video players, charts, or rich text editors can add a lot to your initial bundle, even if most users never use them.
React makes this easy with React.lazy and Suspense:
React.lazy() instead of a normal import to load the component only when needed.<Suspense> with a fallback UI (like a spinner or skeleton) while it loads.This works especially well with route-based code splitting, where each page loads only when the user visits it:
import { lazy, Suspense } from "react";
const MovieCard = lazy(() => import('@/components/MovieCard'))
Rendering big lists with tons of DOM nodes is a common performance problem. Most users won’t even scroll through the entire list, so you end up doing a lot of work for nothing.
List virtualization fixes this by only rendering what’s visible on screen (plus a small buffer). As the user scrolls, items get added and removed from the DOM, so the list feels complete but stays fast.
Libraries like react-window (lightweight) or react-virtualized (more feature-rich) make this easy to implement.
Impact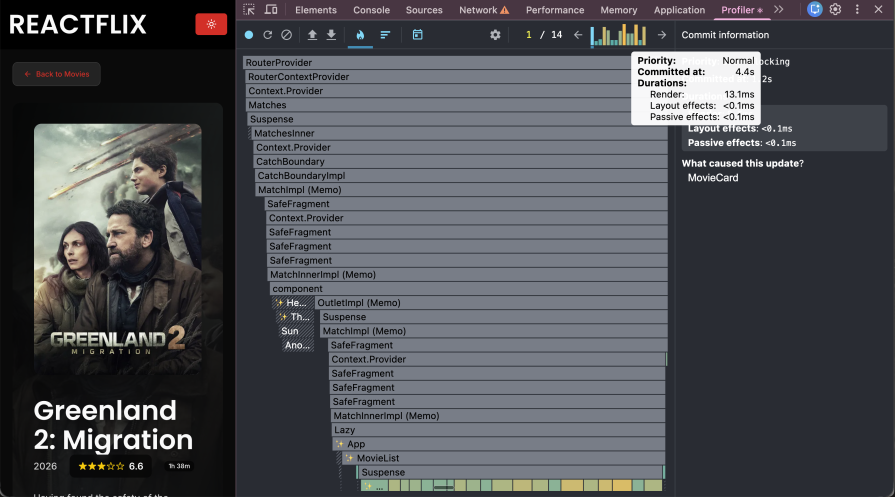
You can see that the number of times the app re-rendered has gone down. The peaks have also lowered in height, with the maximum one being 13.1ms: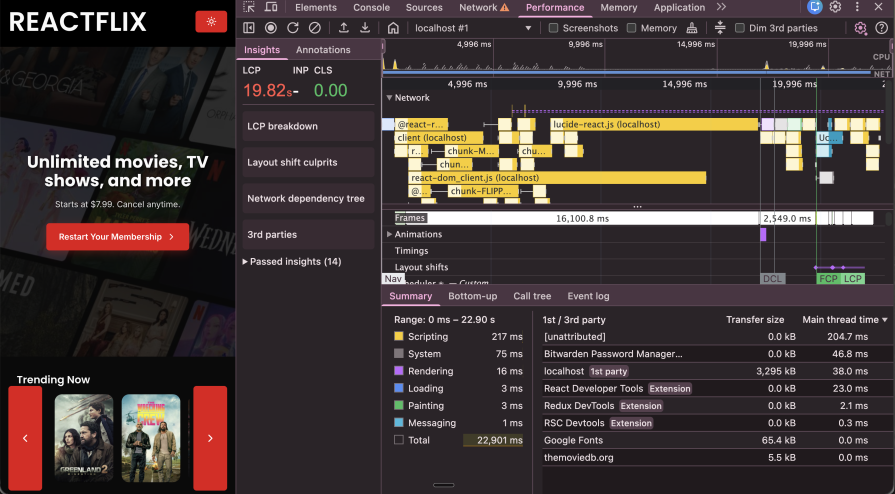
LCP also went down by 2 seconds. Even though this is not a big change in LCP, it is still encouraging because it is a step in the right direction.
Client-side rendering can be slow because users often see a blank screen or spinner while the browser downloads and runs JavaScript and fetches data. This delay is a big reason for poor LCP scores, causing “element render delay.”
Server-side rendering (SSR) fixes this by fetching the data on the server, generating the HTML on the server, and sending a page that can show content right away. Users see real content immediately, while JavaScript loads and hydrates in the background.
You can build SSR yourself, but frameworks like Next.js, Remix, or TanStack Start make it much easier and production-ready. TanStack Start also supports streaming SSR, which means the server can start sending HTML to the browser as it’s being generated instead of waiting for the full page to finish.
Switching to a framework usually means changing how routing and data fetching work, but the performance gains are huge. You’re not just tweaking client-side code; you’re changing when and where the page renders. Data fetching happens on the server before the component even renders, ensuring data is ready immediately when the page loads. This dramatically reduces LCP.
In TanStack Start, you can fetch data on the server using a server function. We are going to move our client-side data fetching to server side by creating a server function:
//Before: data-fetching in useEffect

  useEffect(() => {
    async function fetchPopularMovies() {
      const token = import.meta.env.VITE_TMDB_AUTH_TOKEN;
      if (!token) {
        setError('Missing TMDB_AUTH_TOKEN environment variable');
        setLoading(false);
        return;
      }
      setLoading(true);
      setError(null);
      try {
        const response = await fetch(
          API_URL,
          {
            headers: {
              'accept': 'application/json',
              'Authorization': `Bearer ${token}`,
            },
          }
        );
        if (!response.ok) {
          throw new Error(`Failed to fetch movies: ${response.statusText}`);
        }
        const data = (await response.json()) as TMDBResponse;
        setMovies(data.results);
      } catch (error) {
        setError((error as Error).message);
      } finally {
        setLoading(false);
      }
    }
    fetchPopularMovies();
  }, []);

//After: Data-fetching in TanStack Start Server Function

export const getMovies = createServerFn({
  method: 'GET',
}).handler(async () => {
  try {
    const response = await fetch(`${API_URL}/popular`, {
      headers: {
        accept: "application/json",
        Authorization: `Bearer ${token}`,
      },
    });

    if (!response.ok) {
      throw new Error(`Failed to fetch movies: ${response.statusText}`);
    }

    const movies = await response.json();
    return { movies };
  } catch (error) {
    const errorMessage = error instanceof Error ? error.message : 'Unknown error occurred';
    throw new Error(`Movies fetch failed: ${errorMessage}`);
  }
})
LCP went down to 13.43s!: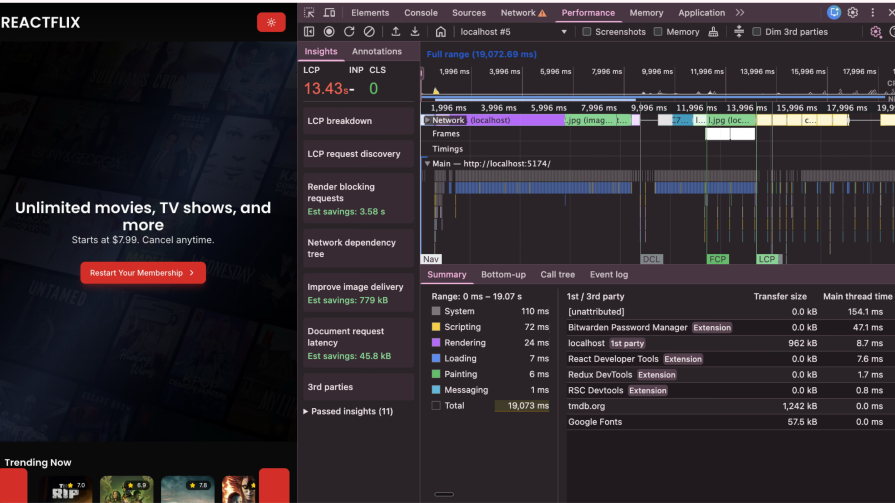
Images are often the biggest contributors to a slow LCP. A few techniques can be used to optimize image and video asset delivery:
Move large local assets (like hero backgrounds) to a CDN (e.g., Cloudinary or Cloudflare) to reduce the load on your server. CDN services also provides automatic image optimization, delivering modern formats like WebP or AVIF to browsers that support them while falling back to JPEG or PNG for older browsers. Moving large assets to a CDN also reduces load on your application server and decreases bundle size.
Not all images are equally important. The browser can’t know which images are critical for the initial view and which are below the fold or in tabs users might never open. You need to provide this information explicitly. Use fetchpriority="high" for critical above-the-fold images and loading="lazy" for everything else:
//Hero banner has highest priority therefore fetchPriority is high
<img
src={"<https://res.cloudinary.com/dubc3wnbv/image/upload/v1760360925/hero-background_ksbmpq.jpg>" }
fetchPriority='high'
alt=""
 />


 //Lazy load Movie Card images
 <img
   src={movie?.poster_path ? TMDB_IMAGES_ASSET_URL + movie?.poster_path : "/placeholder.svg"}
   alt={movie?.title}
   loading='lazy'
   />
Modern frameworks like TanStack Router can preload routes automatically. For example, when a user hovers over a link, it can start loading the next page’s code and data before they click. That makes navigation feel instant:
//router.tsx


    const router = createTanStackRouter({
        routeTree,
        scrollRestoration: true,
        defaultPreload: 'intent',
    })
You can also preload important CSS and fonts so they start downloading right away instead of being discovered later. This helps avoid layout shifts and prevents flashes of unstyled content:
//__root.tsx

links: [
      { rel: 'preload', href: appCss, as: 'style' },
]
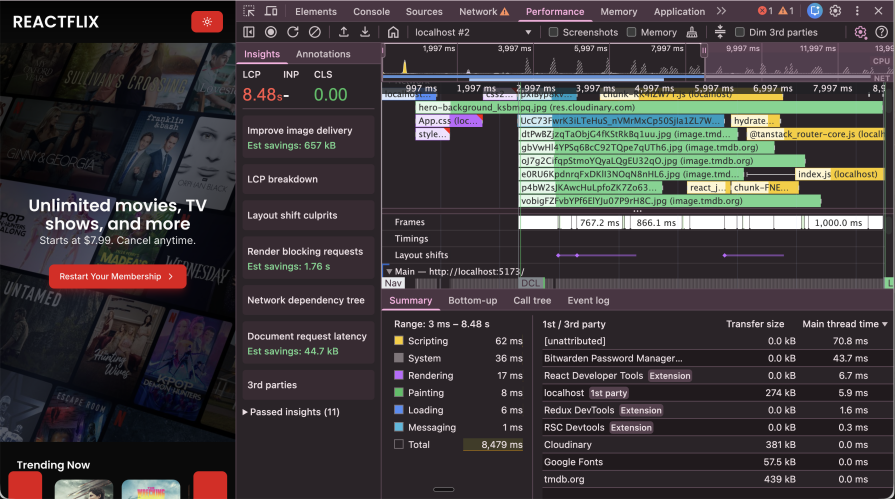 The LCP dropped down to 8.48s.
Now let’s uncheck Disable Cache to let the browser and build tools to do their job. Give the browser a hard reload by emptying the cache.
We notice a significant drop in LCP – down to 1.27s!: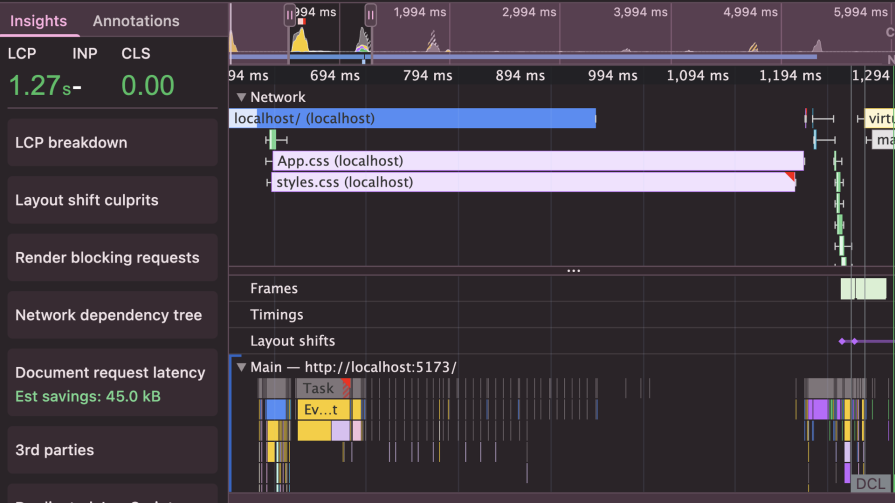
Note that since we emptied the cache and hard reloaded, the assets are still being loaded from the network and not pulled from cache: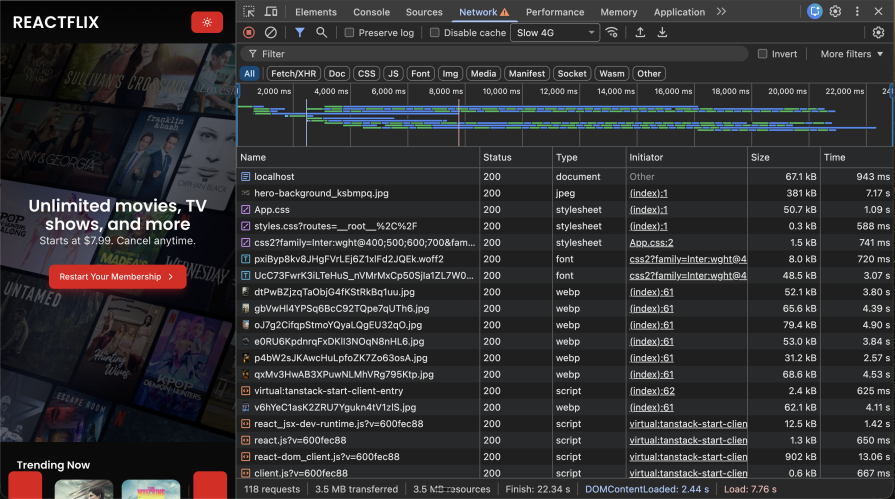
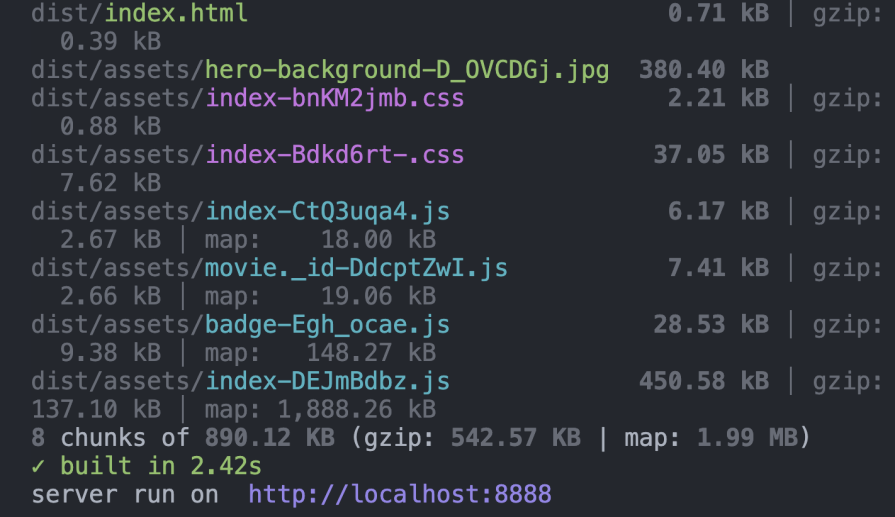
Bundle size has reduced to 454KB and gzip of 164KB! DAMN!: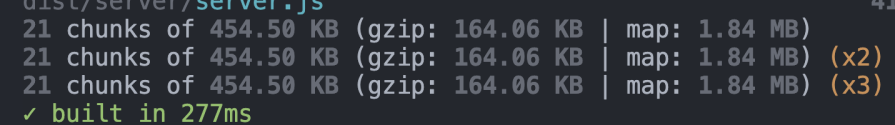
Big performance gains like going from a 28-second LCP to under 2 seconds come from stacking multiple optimizations, not one magic fix. Some changes (like code splitting or using a CDN) are quick wins, while bigger upgrades (like SSR or virtualization) take more work but can give major speed boosts.
webpack-bundle-analyzer to spot large dependencies and split code.Optimizing the performance of a React app is incredibly important. Not just from an engineering standpoint, but from a business perspective, too. A slow React app causes users to drop off mid-flow, which directly leads to lost revenue.
Performance isn’t a one-time task. As your app grows, new bottlenecks will show up, so keep optimizing the performance of your components as you build them.
Install LogRocket via npm or script tag. LogRocket.init() must be called client-side, not
server-side
$ npm i --save logrocket

// Code:

import LogRocket from 'logrocket';
LogRocket.init('app/id');
// Add to your HTML:

<script src="https://cdn.lr-ingest.com/LogRocket.min.js"></script>
<script>window.LogRocket && window.LogRocket.init('app/id');</script>

AI-generated tests can speed up React testing, but they also create hidden risks. Here’s what broke in a real app.re

Why the future of DX might come from the web platform itself, not more tools or frameworks.

A hands-on test of Claude Code Review across real PRs, breaking down what it flagged, what slipped through, and how the pipeline actually performs in practice.

CSS art once made frontend feel playful and accessible. Here’s why it faded as the web became more practical and prestige-driven.
Hey there, want to help make our blog better?
Join LogRocket’s Content Advisory Board. You’ll help inform the type of content we create and get access to exclusive meetups, social accreditation, and swag.
Sign up now