
Editor’s note: This React DevTools tutorial was last updated on 5 August 2022 to include sections about installing the React DevTools browser extension, addressing a common problem with the extension showing up on the browser, and new features that shipped with recent, minor updates.

React DevTools is a highly valuable asset when you’re working on a React project. Though it has its standard use cases, there are a lot of subtle features within DevTools that go unnoticed or unused.
In this article, we’ll demonstrate how you can use React DevTools’s various features that you might not have tried yet (or didn’t even know existed). We’ll also go over how to install the browser extension and highlight some features that shipped with React DevTools v4 and in the subsequent minor releases.
The Replay is a weekly newsletter for dev and engineering leaders.
Delivered once a week, it's your curated guide to the most important conversations around frontend dev, emerging AI tools, and the state of modern software.
React DevTools is an open source, MIT-licensed tool developed and maintained by Meta. It adds React debugging capabilities to the browser DevTools. Though it is primarily a browser extension, React DevTools also comes as a standalone package.
Though the browser extension is for debugging browser-based React applications, you can use the standalone package for debugging non-browser-based applications, such as React Native and mobile browsers.
The React DevTools browser extension for debugging web-based React applications is available on some popular web browsers. You can install it from the corresponding web browser’s add-on stores below:
It’s also possible to build and install React DevTools from the source directly. You can check the documentation for instructions on how to do so.
To use the standalone React DevTools package, you need to install it from the npm package registry as seen below:
yarn global add react-devtools
npm install -g react-devtools
React DevTools should appear in the browser’s DevTools when you point to a site built with React. However, it’s pretty common to experience issues while using the extension.
One of the common problems is React DevTools not showing up in the browser DevTools, even after installation.
The following are some of the possible causes and solutions to this problem:
file:), be sure to provide the extension access to the file URLs. It’s important to give the extension access to the projectThe FAQ section of the React DevTools documentation has a list of the mentioned problems and how to troubleshoot them.
New features are added to React DevTools all the time. React DevTools 4 was officially released in August 2019, bringing significant performance improvements, a revamped navigation experience, and full support for React Hooks. Since then, the React team has continuously refined DevTools with regular updates and improvements.
Now, we’ll go over five ways to use React DevTools. Let’s jump into it!
In September 2018, the React team introduced an incredibly powerful feature for debugging performance-related issues called the React Profiler. When used with React v16.5 or later, React DevTools provides you with a profiling feature that shows you a summary of how your application rerenders.
Just like the regular JavaScript profiler found in your dev tools of choice, you’ll have to “record” a set of interactions. Once you’ve done that, you’ll see a visualization of each rerender your application goes through with accurate timing information and color-coded flame graphs. As of April 2019, it even captures screenshots of every DOM update.

For a deeper dive into the React Profiler, I recommend watching Brian Vaughn’s recorded live stream in which he demonstrates how to use the Profiler to locate and squash pesky performance bugs.
Are you one of those people that likes to spend a ton of time making your development environment look just right? If so, you’ll be happy to learn that React DevTools is themable. You can find theming options in the General tab of the React DevTools settings:
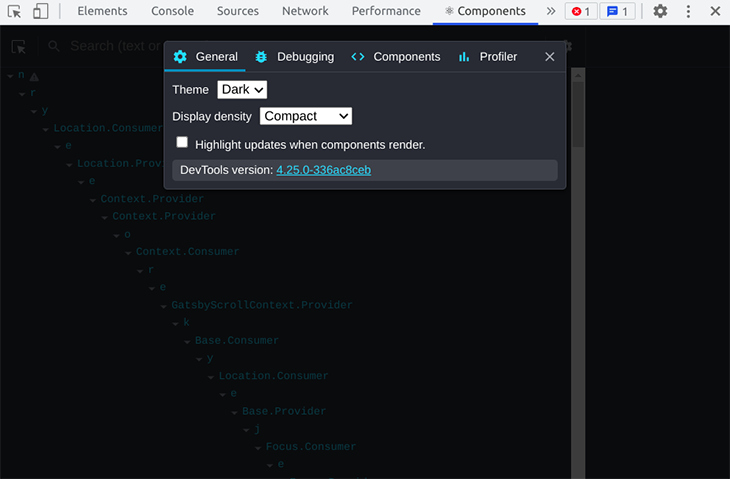
It will use your browser theme by default. You can also switch between the light and dark themes whenever you like. To start playing around with themes, click the cog icon on the right side of the main panel and then click the General settings tab.
Although you can find and fix most issues directly in React DevTools, there’s some debugging that just works better with a good old console.log. One of my favorite features is that DevTools actually gives you the option to interact with the component instances via the console itself.
Select a component in React DevTools and pop open the console (hitting the Esc key lets you see both at once). Type in $r and you’ll have access to the instance of that React component from the console.
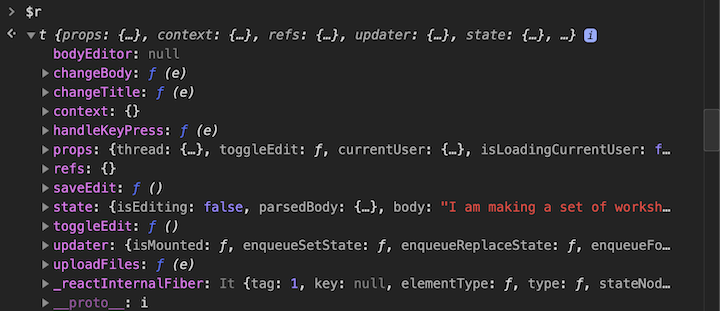
This gives you a lot of debugging power. With DevTools, you can access React state from the console, trigger callback methods, and even augment functionality.
If you’re interested in a particular function, such as a click handler or callback function, React DevTools also provides a nice little convenience feature. If you right-click a function in the props or state overview, you can make it available as a global variable. This way, you can call it whenever you want with different arguments and contexts.
The debugging tools in modern browsers are much more powerful than most people are aware of. You can set breakpoints, inspect state and props as your app changes, and step through code execution line by line. However, code compiled with Babel tends to be hard to read and a pain to follow. Wouldn’t it be great if you could actually view the source the way you wrote it?
Babel provides a plugin that adds a __source prop to all JSX elements. This lets the React DevTools link directly to the source code of the component you’re inspecting. It slows down your application a bit, but it works great in development mode.
To use this feature, install babel-plugin-transform-react-jsx-source, apply it to your .babelrc file, and restart your dev server. When you right-click a component in the component tree, you’ll see a new option : “Show <component name> source”:
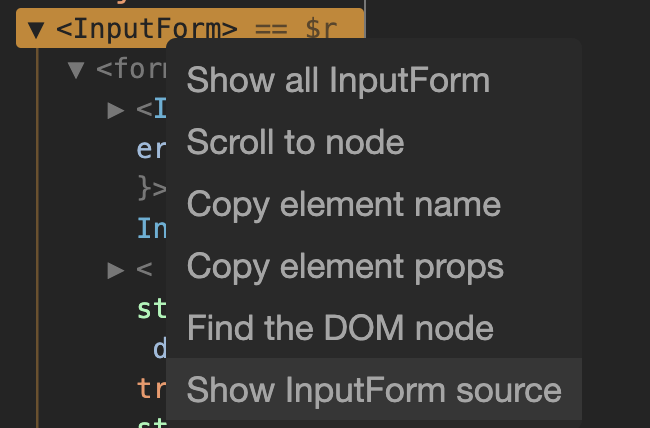
This enables you to jump into the browser’s source view, where you can inspect, set breakpoints and alter the code altogether.
If you use the popular bootstrap tool Create React App, you’ll find that this works out of the box. No config, no plugins, no nothing. Just jump straight to the source!
Did you know there are a few top-level exports from React made specifically for interacting with React DevTools? You probably won’t need them very often, but they come in incredibly handy when you do.
useDebugValueWhen you’re creating custom React Hooks that are shared with other developers, it’s often a good idea to use the useDebugValue hook. This hook adds an informative label to the hook that shows up in the React DevTools.
In some situations, understanding why a particular commit or rerender took longer than expected can be a bit complicated. That’s why the React DevTools supports so-called interaction tracking. This is a programmatic API that lets you place labels on different events in your app and trace their performance.
To get started, install the scheduler package and import the unstable_trace method. This method accepts a label (“login button clicked,” for example), a timestamp, and a callback. What happens in the callback is traced at a much more detailed level than previously possible.
If you’re experiencing a performance regression that’s only present in the production build of your application, you might want to try profiling your application. Unfortunately, React doesn’t include profiling support for the production build of React — at least, not by default.
Luckily, you can still opt into having profiling available in your production app. You might not want to ship it to your customers, but testing it out locally or in a QA environment will help you out quite a bit.
As previously mentioned, React DevTools is constantly under heavy development. React DevTools v4 was released in August 2019 and the subsequent minor updates have introduced a host of major and minor improvements, a few of which we’ll list below. The React DevTools changelog has a comprehensive list of recent updates and improvements in React DevTools, but we’ll go over a few now.
The earlier version of React DevTools only supports React v16 and up. React DevTools v4, however, supports React v0.13, 14, and 15 as well. This is great news for anyone stuck maintaining or bug fixing a legacy React codebase.
I guess it’s worth mentioning this explicitly in the thread as well: The new DevTools will support older React versions (probably v13+)
To be transparent, I had initially hoped to avoid this, but it feels like the “right thing to do” for the community, etc. — Brian Vaughn (@briandvaughn) 18 April 2019
When you open React DevTools, you can now decide whether you want the tree view of your components to be collapsed or expanded by default. You can change your preference from the new and improved settings panel found behind the cog icon.
React DevTools features a slightly simplified tree view in v4. No inline props are shown (except the key, if applicable), and pure DOM nodes (like <div /> ) are shown.
This is a fairly controversial change that was met with some backlash from the community. On the plus side, the simplified tree leads to better performance and a more manageable tree-view UI.
That being said, I expect that a few of the changes will be controversial.
For example: 1. The new DevTools does not show inline props, only the name and key (if there is one). 2. The new DevTools does not show DOM elements in the Components tree. — Brian Vaughn (@briandvaughn) 18 April 2019
Did you know that React DevTools has explanatory tooltips for most of its controls? Neither did most users. The native tooltips had a long delay and led many users to assume there weren’t any tooltips at all. There are now improved tooltips in React DevToos v4, courtesy of Ryan Florence and his Reach UI library!
The React DevTools v4.22.0 minor release adds functionality for searching the timeline by component name. Searching for the component name zooms the component measure. You can then step through using the next and previous arrows.
The features listed above are just a few of many that shipped with React DevTools v4 and subsequent minor releases.
As you might have noticed, Brian Vaughn’s name pops up a lot when speaking about the React DevTools. Brian was the main developer of the React DevTools and has done a tremendous effort on creating helpful tooling for the average React developer. If you want to become a DevTools expert, I recommend you check out a few of his talks on the subject. Brian has also done a few podcast interviews that are worth checking out.
React DevTools has made it a lot easier to build, ship and debug React applications than ever before. Thanks to the Profiler API, you can even squash most performance hiccups in no time! It’s an incredibly important tool to learn how to use and master, for novices and pros alike.
What are your favorite features in React DevTools?
Install LogRocket via npm or script tag. LogRocket.init() must be called client-side, not
server-side
$ npm i --save logrocket

// Code:

import LogRocket from 'logrocket';
LogRocket.init('app/id');
// Add to your HTML:

<script src="https://cdn.lr-ingest.com/LogRocket.min.js"></script>
<script>window.LogRocket && window.LogRocket.init('app/id');</script>
When should you move API logic out of Next.js? Learn when Route Handlers stop scaling and how ElysiaJS helps.

Explore how Dokploy streamlines app deployment with Docker, automated builds, and simpler infrastructure compared to traditional CI/CD workflows.
A side-by-side look at Astro and Next.js for content-heavy sites, breaking down performance, JavaScript payload, and when each framework actually makes sense.
AI-generated tests can speed up React testing, but they also create hidden risks. Here’s what broke in a real app.re
Hey there, want to help make our blog better?
Join LogRocket’s Content Advisory Board. You’ll help inform the type of content we create and get access to exclusive meetups, social accreditation, and swag.
Sign up now