There’s no doubt DevTools is one of the most useful tools we could use when developing and testing web applications. In Chrome 85, DevTools added several improvements, such as:

respondWith events, which record the time before the service worker fetch event handler runs to the time when the promise is settled (issue #1066579)These are helpful changes, but in this post, I’m going to review the changes related to style editing and new JavaScript features, as well as changes in the Source and Performance panels.
Most likely, by the time you read this, Chrome 85 will be the mainstream, stable version. At the time of this writing (July 2020), you can only get Chrome 85 by downloading the development version of Chrome. You can learn more about Chrome’s release versions on the page about Chrome release channels.
The Replay is a weekly newsletter for dev and engineering leaders.
Delivered once a week, it's your curated guide to the most important conversations around frontend dev, emerging AI tools, and the state of modern software.
Editing code or styles in place to see the changes in real time is one of the most useful features of DevTools.
When working with CSS styles, you have the option to manipulate CSS rules programmatically using the CSS Object Model (CSSOM) API:
const style = document.createElement('style');
document.head.appendChild(style);
style.sheet.insertRule('#myDiv {background-color: blue; color: yellow}');
However, DevTools didn’t allow you to edit styles created this way.
This has changed in Chrome 85. Starting from this version, you can edit styles built with the CSSOM API, in particular, when using CSSStyleSheet.insertRule, CSSStyleSheet.deleteRule, CSSStyleDeclaration.setProperty, and CSSStyleDeclaration.removeProperty.
This also works for libraries such as LitElement (try it with this example) or React Native for web (try it with this example).
The styles are editable even if they were inserted after DevTools are opened, and this also works with Constructable Stylesheets (at this time, only available in Chrome).
Constructable Stylesheets allows you to create stylesheets by invoking the CSSStyleSheet() constructor, adding and updating stylesheet rules with replace() and replaceSync():
const sheet = new CSSStyleSheet();
sheet.replaceSync('#myDiv {background-color: blue; color: yellow}');
document.adoptedStyleSheets = [sheet];
Chrome uses Acorn to parse JavaScript in the DevTools console.
In Chrome 85, Acorn was updated to version 7.3.0 which, among other improvements, adds support for the syntax of the optional chaining operator (?.).
Using the optional chaining operator, instead of having a piece of code like the following:
if (user && user.name && user.name.last)
 lastName = user.name.last.toUpperCase();
You can have just this:
lastName = user?.name?.last?.toUpperCase();
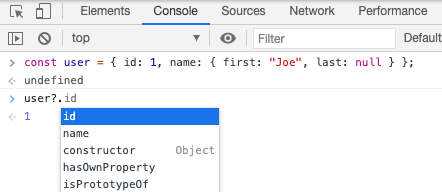
But until Chrome 84, auto-completion for this operator was broken:
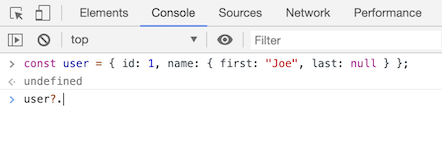
Now, property auto-completion in the console works with this operator (user?.), just like if you were using user. or user[:
The other two changes are related to syntax highlighting in the sources panel.
Until Chrome 84, private fields and methods were displayed as white text. In some cases, even the rest of the line was also displayed as white:
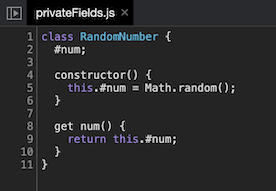
The sources panel uses CodeMirror to show the code.
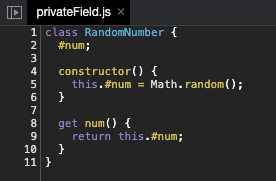
In Chrome 85, CodeMirror was updated to version 5.54.0. This version improves the parsing of private properties and class fields:
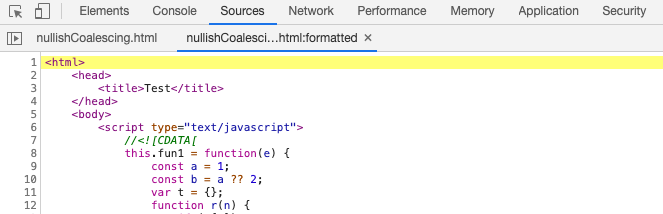
The last change about new JavaScript features is about the nullish coalescing operator.
Before Chrome 85, pretty-print formatting was broken when the code contained this operator:

But now it’s fixed and the formatting works properly:
There are other helpful changes to the Sources panel.
Now we have the ability to copy or cut the current line in the editor even if you select nothing.
For this, position the cursor at the end of the line you want to copy or cut and press the appropriated keyboard shortcut:
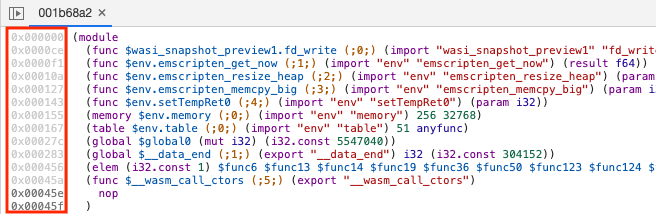
Another improvement is that if you work with WebAssembly files, the editor now displays bytecode (hexadecimal) offsets to display source locations in Wasm modules instead of the line-based locations used for other formats:
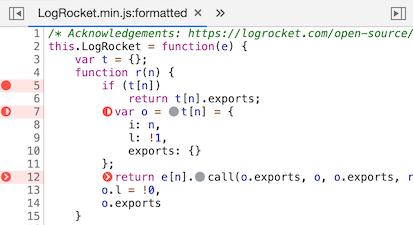
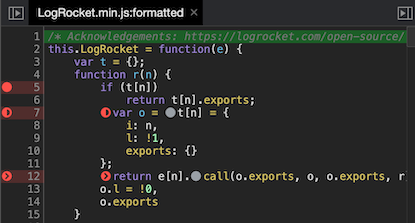
Finally, there are new icons for breakpoints, conditional breakpoints, and log points.
Here’s how they looked before:
Likewise, this is how they looked in dark mode:
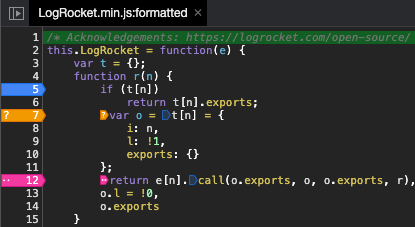
Now they are more colorful:
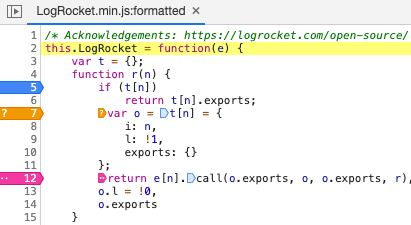
In my opinion, this improves the readability of the breakpoint icons, especially when dark mode is enabled:
There are two important changes in the Performance panel of DevTools.
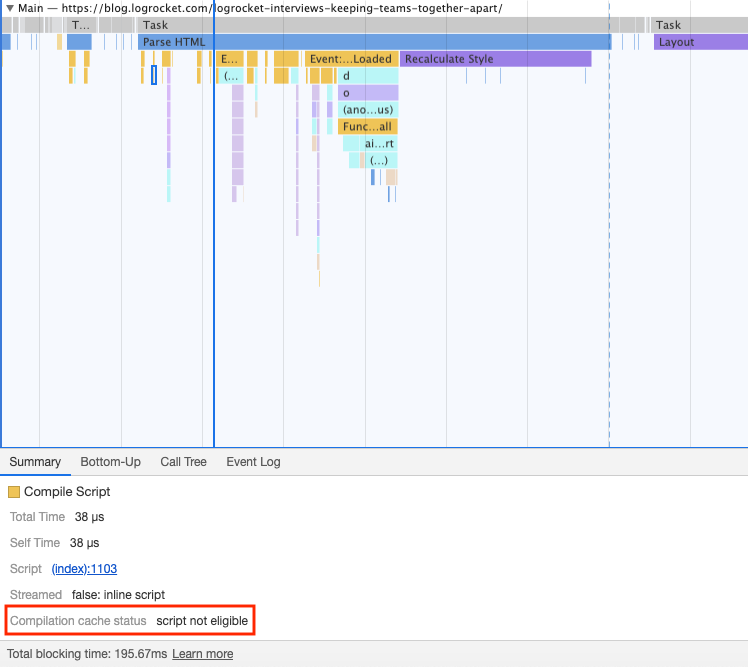
About the first one, until Chrome 84, DevTools didn’t show the caching information if a given script was not cached:
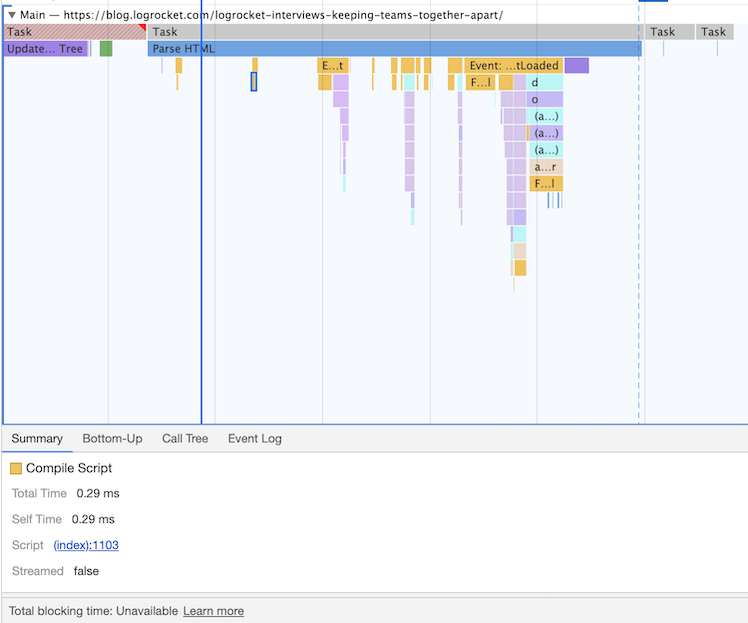
Now the caching information is always displayed in the summary tab, showing a reason why the caching didn’t happen:
The second change has to do with the times shown in the rules of the recordings.
In previous versions, times were shown based on when the recording started:
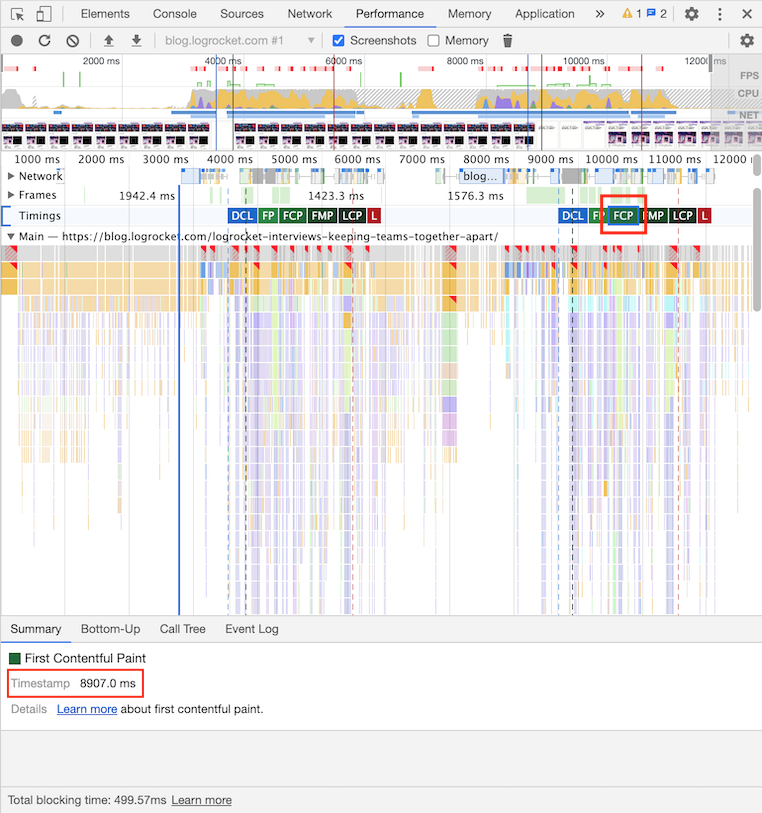
Notice the timestamp shown for the FCP of the second page, 8907 milliseconds. This is the time when the event happened since the recording was started.
Now, times are relative to where the users navigate:
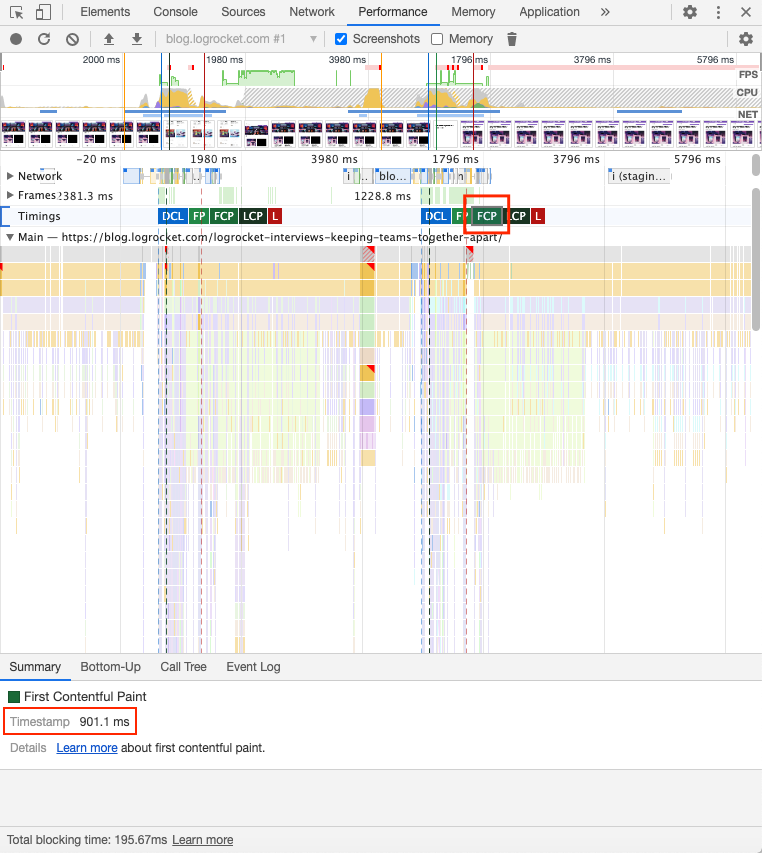
In the above example, the timestamp for the FCP of the second page is 901.1 milliseconds, the time when the event happened after the page was loaded.
In this post, we have reviewed the most important changes of DevTools in Chrome 85. I didn’t review in depth the four changes mentioned at the beginning of the post, but you can learn more about them on this post (feedback to the dev team is also welcomed).
The post also mentions that the Lighthouse panel was updated to use Lighthouse 6.0 in Chrome 85. Luckily, Lighthouse 6.0 was introduced in Chrome 84, we didn’t have to wait until the next version. Check out this post or the release notes for a summary of all the changes that version 6.0 brought.
Finally, remember that you can download Chrome Canary or Chrome’s development version to access the latest DevTools features.
Install LogRocket via npm or script tag. LogRocket.init() must be called client-side, not
server-side
$ npm i --save logrocket

// Code:

import LogRocket from 'logrocket';
LogRocket.init('app/id');
// Add to your HTML:

<script src="https://cdn.lr-ingest.com/LogRocket.min.js"></script>
<script>window.LogRocket && window.LogRocket.init('app/id');</script>
Learn how AI-assisted development governance uses rules, agents, hooks, and protocols to help AI coding tools produce safer, more consistent code.

A step-by-step guide to building your first MCP server using Node.js, covering core concepts, tool design, and upgrading from file storage to MySQL.

Using security headers in your Next.js apps is a highly effective way to secure websites from common security threats.

A deep dive into May 2026’s AI model and tool rankings. We break down performance, usability, pricing, and real-world capabilities across 50+ features to help you pick the right tools for your development workflow.
Would you be interested in joining LogRocket's developer community?
Join LogRocket’s Content Advisory Board. You’ll help inform the type of content we create and get access to exclusive meetups, social accreditation, and swag.
Sign up now
