Visualization is essential these days and how you present information matters. With an excess of data at our fingertips, this data can often be tedious to sort through and understand, especially when not presented well.

To make data more digestible, charts are a great way to organize and visualize data. For React apps, developers can use Recharts, an open source “composable charting library built on React components” based in JavaScript.
In this tutorial, we’ll learn how to use Recharts by building a small React application that fetches data from a Sanity content lake to summarize an extensive dataset in a visually appealing way.
To follow along with this tutorial, you must have the following:
To begin our project, we must first install Sanity CLI on our machine, which can be done by running the following command:
yarn install -g @sanity/cli
This installs the command-line tool globally to set up new projects, manage datasets, import data, and more. We will use it to get our project up and running.
For much more information on this, read the Sanity documentation.
Next, we must start our Sanity project. To do that, run the following command:
sanity init
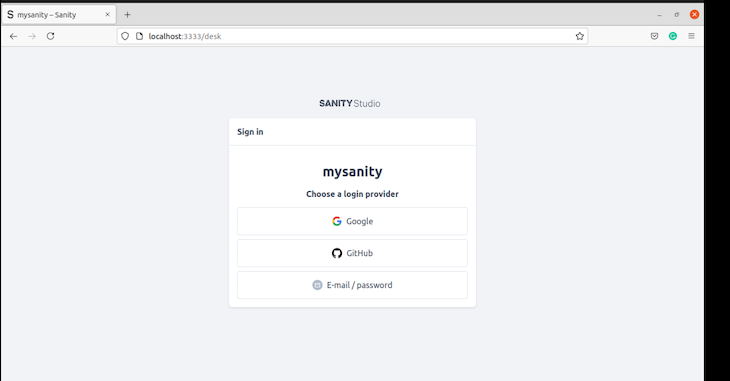
The above command will ask you to select your login type: either Google, GitHub, Email/password.
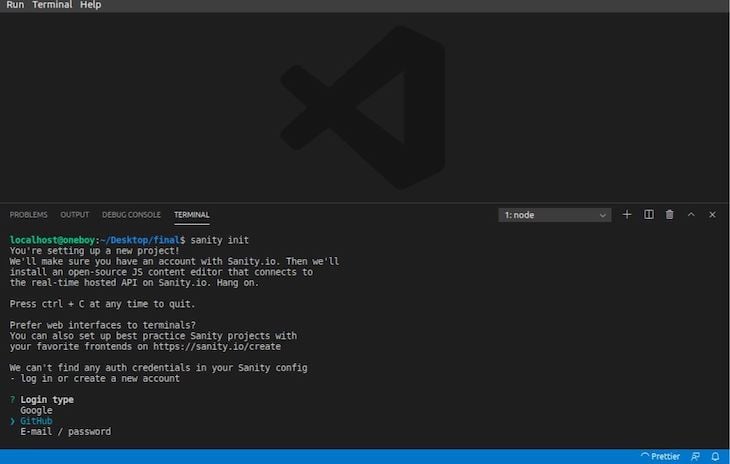
You can select the most convenient one for your project, which will immediately open your default browser and complete the sign-up/login process.
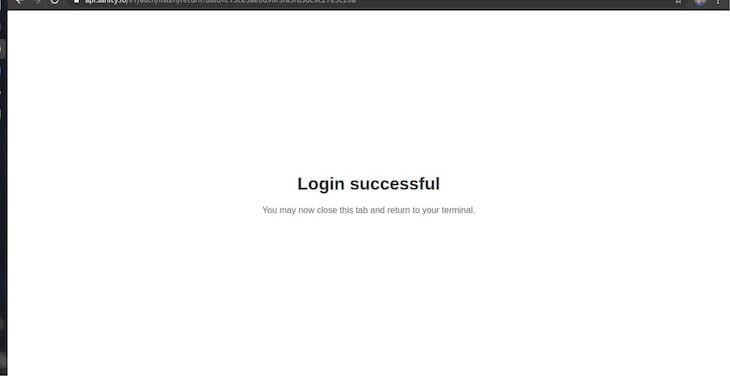
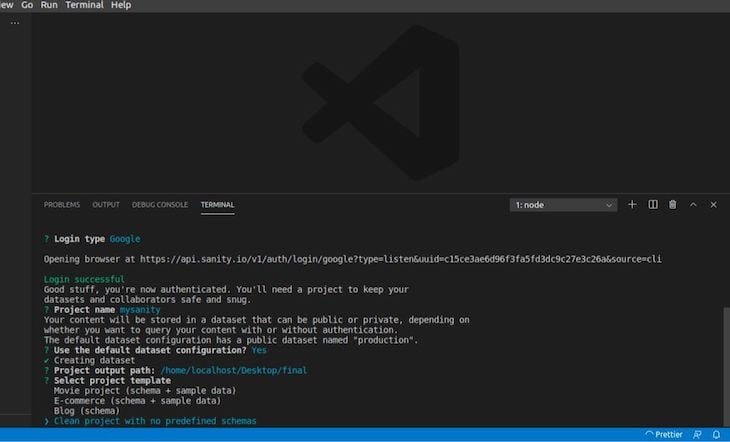
Going back to your terminal, you will be prompted to:
As of posting this article, Sanity only provides three out-of-the-box, already populated schemas: Movie project (schema + sample data), E-commerce (Schema + sample data), and Blog(schema + empty data).
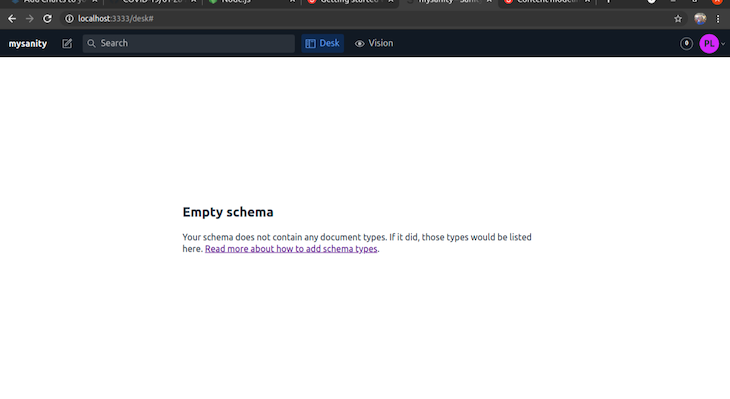
However, for this project, we must choose the Clean project with no predefined schemas option because we must define our schema by ourselves.
After the installation completes, we can see the files and folders created within our project folder. To start Sanity, run the following command:
sanity start
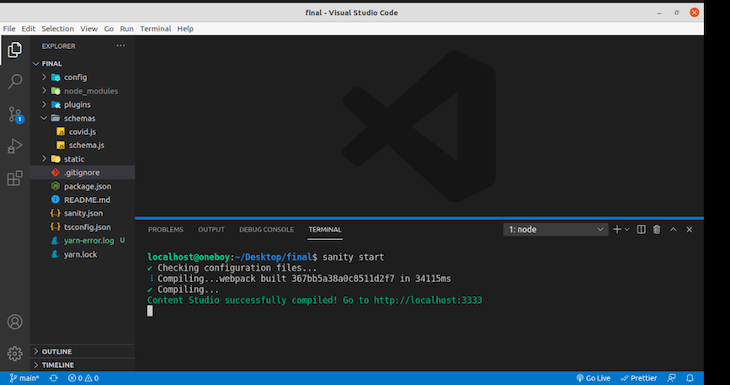
Next, we must install the necessary node modules, compile, and start the project at http://localhost:3333. While logging in, make sure you select the same provider you used when creating the project.
Now, let’s add our schema code; this is simply content modeling, the process of identifying, collating, and relating all of the contents into a centralized structure so we can build efficient workflows and data structures.
You can find more information about content modeling in Sanity here.
The data we will use in this project comes from the John Hopkins GitHub page, which provides a daily report of Covid cases, including the fields we are interested in: province/state, confirmed cases, and the number of deaths.
We’ll specifically use the 01/01/2021 data to be represented in our chart. To do this, first, create a file within the schemas folder called covid.js, and copy and paste the code below.
This file defines the structure of the particular schema:
// schemas/covid.js

export default{
    name: "covid",
    type : "document",
    title: "Covid19Data",
    fields: [
      {
      name: "title",
      type: "string",
      title: "States"
      },
      {
        name: "confirmed",
        type: "number",
        title: "Confirmed"
      },
        {
          name: "death",
          type: "number",
          title: "Death"
          },
    ],
  }
Now, we must import the covid.js into our schema.js file within our schemas folder, like so:
// schemas/schema.js
// First, we must import the schema creator
import createSchema from 'part:@sanity/base/schema-creator'
// Then import schema types from any plugins that might expose them
import schemaTypes from 'all:part:@sanity/base/schema-type'
import covid from './covid'
// Then we give our schema to the builder and provide the result to Sanity
export default createSchema({
  // We name our schema
  name: 'default',
  // Then proceed to concatenate our document type
  // to the ones provided by any plugins that are installed
  types: schemaTypes.concat([
    /* Your types here! */
    covid,

  ]),
}
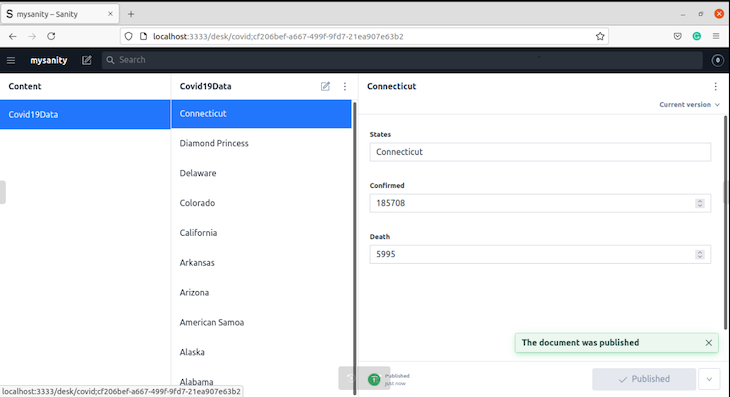
Now, going back to http://localhost:3333, we will see this:
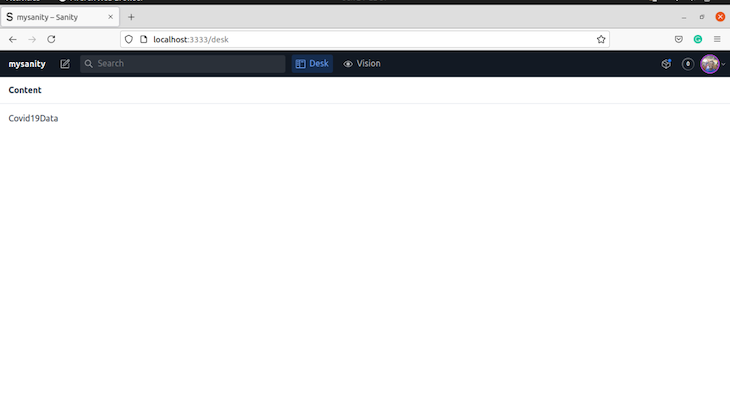
Covid19Data is the title of the document we created in the schema that has States, Confirmed, and Death within it.
States showcases the places of the Covid cases, Confirmed shows the number of people who tested positive for Covid, and Death shows the number of people who died from Covid in that particular state.
We can now populate our project with data from the 01/01/2021 dataset.
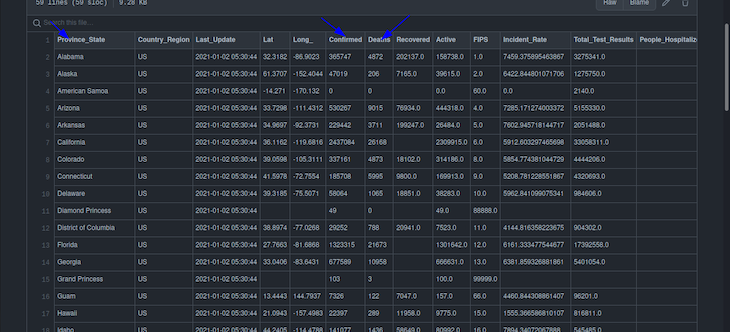
Note that we must only copy Province_State, Confirmed, and Deaths columns from the following:
Now that our Sanity project is up and running, it is time to set up our frontend application with React.
First, create an empty folder and run this command:
npx create-react-app frontendfinal
frontendfinal is the name I decided to call my project, but remember, yours can be anything.
After installing React, it is time to install Recharts. First, cd into frontendfinal
cd frontendfinal
Then, we can install recharts:
npm install recharts
Open it up in your text editor and navigate to package.json, which opens the following:
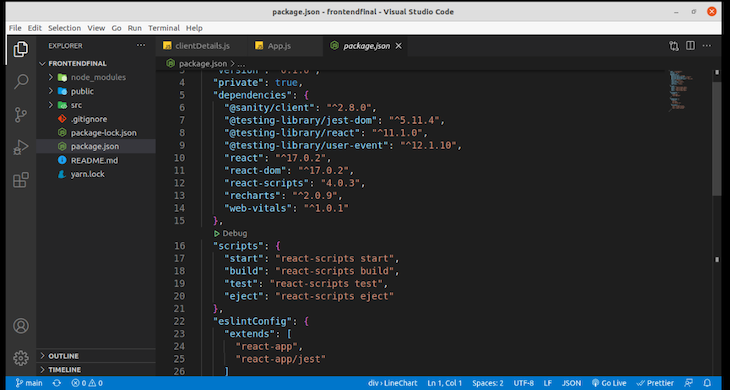
Now, Recharts is installed in our React app!
The create react app command bootstraps a React application quickly; now, we just need to make some modifications for it to fit our use case because we don’t need everything create react app comes with.
For this particular use case, we do not need to use App.css or logo.svg inside the src folder; simply delete all the code inside App.js.
For your React application to connect to your Sanity instance running, you must install sanity/client by running this command:
npm install --save @sanity/client
Next, create a file inside the src folder. I decided to use clientDetail.js, so inside clientDetail.js, copy and paste the following code and replace details appropriately:
// src/clientDetails.js
const sanityClient = require('@sanity/client')
const client = sanityClient({
  projectId: 'xxxxxxx',
  dataset: 'production',
  apiVersion: '2021-03-25', // use a UTC date string
  useCdn: false, // `false` if you want to ensure fresh data
})
export default client;
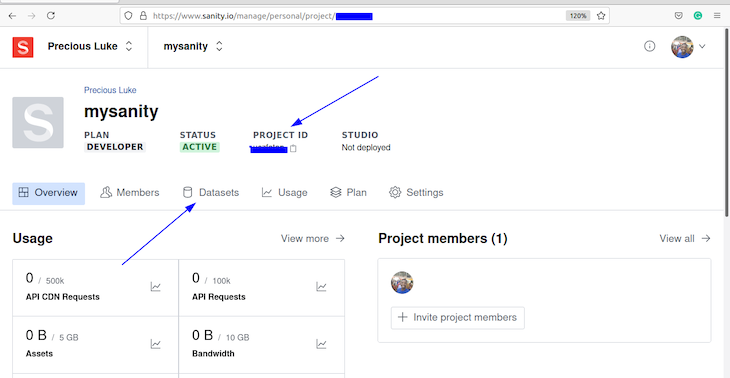
You can get your projectId by logging into your Sanity account and selecting your project. Other information like datasets is there as well.
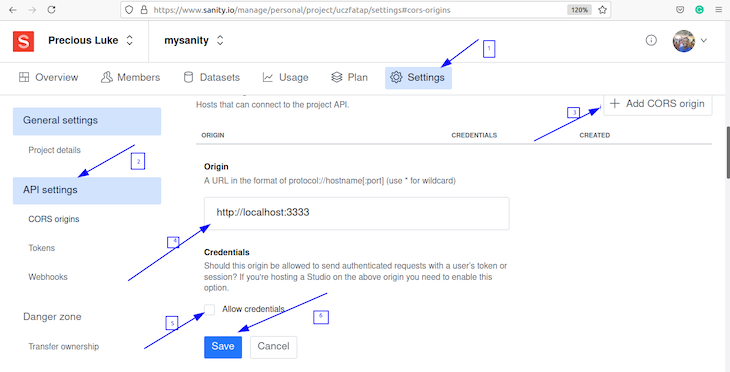
Again, to avoid CORS issues, Sanity lets you add the origin where your request will come from. To add a new origin, follow the steps below:
The steps have been numbered visually in the screenshot below:
Back in our App.js file, we must import the following: useState, useEffect from react, client from clientDetails.js file, and import some components from Recharts (LineChart, Line, XAxis, YAxis, CartesianGrid, Tooltip, and Legend) to represent the data.
Our App.js file will look like so:
// src/App.js
import React, { useState, useEffect } from "react";
import client from "./clientDetails";
import {
  LineChart,
  Line,
  XAxis,
  YAxis,
  CartesianGrid,
  Tooltip,
  Legend,
} from "recharts";
Then, we can create a functional component named App that will use useState, useEffect, and fetch data from our Sanity instance using GROQ:
// src/App.js
import React, { useState, useEffect } from "react";
import client from "./clientDetails";
import {
  LineChart,
  Line,
  XAxis,
  YAxis,
  CartesianGrid,
  Tooltip,
  Legend,
} from "recharts";
export default function App() {
  const [covidData, setcovidData] = useState(null);
  useEffect(() => {
    client
      .fetch(
        `*[_type == 'covid']{
      confirmed,
      title,
      death
      }`
      )
      .then((data) => {
        setcovidData(data);
      })
      .catch(console.error);
  }, []);
We must then return a div tag containing all the imported Recharts components and some defined properties.
Our App.js full code should be as follows:
// src/App.js
import React, { useState, useEffect } from "react";
import client from "./clientDetails";
import {
  LineChart,
  Line,
  XAxis,
  YAxis,
  CartesianGrid,
  Tooltip,
  Legend,
} from "recharts";
export default function App() {
  const [covidData, setcovidData] = useState(null);
  useEffect(() => {
    client
      .fetch(
        `*[_type == 'covid']{
      confirmed,
      title,
      death
      }`
      )
      .then((data) => {
        setcovidData(data);
      })
      .catch(console.error);
  }, []);
  return (
    <div>
      {!covidData && <div>Loading</div>}
      {covidData && (
        <LineChart
          width={1000}
          height={400}
          data={covidData}
          margin={{
            top: 10,
            right: 30,
            left: 0,
            bottom: 0,
          }}
        >

          <CartesianGrid strokeDasharray="3 3" />
          <XAxis dataKey="title" />
          <YAxis />
          <Tooltip />
          <Legend />
          <Line
            type="monotone"
            dataKey="death"
            stroke="#8884d8"
            fill="#8884d8"
          />
           <Line
            type="monotone"
            dataKey="confirmed"
            stroke="#8884d8"
            fill="#8884d8"
          />
        </LineChart>
      )}
    </div>
  );
}
To run our finalized code, we can run our React application with the following:
npm run start
Then, we can start it up at http://localhost:3000/:
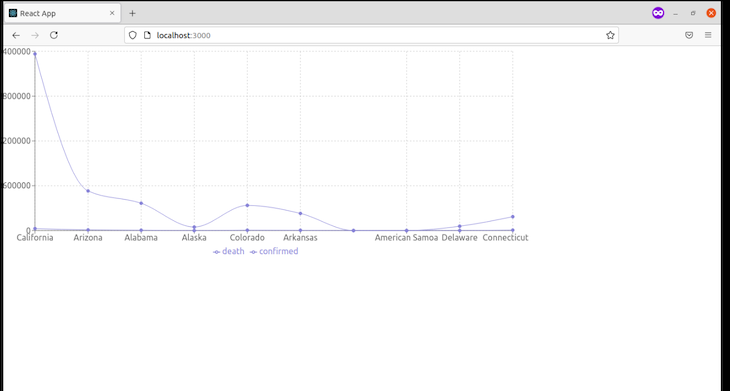
Congratulations, you were able to see this through!
Visualization is essential to organize data, and it is paramount that we present it intelligently and concisely. We were able to fetch data from Sanity to our React application and display it using Recharts.
You can find the source code for this project for the React app and the Sanity codebase here.
Install LogRocket via npm or script tag. LogRocket.init() must be called client-side, not
server-side
$ npm i --save logrocket

// Code:

import LogRocket from 'logrocket';
LogRocket.init('app/id');
// Add to your HTML:

<script src="https://cdn.lr-ingest.com/LogRocket.min.js"></script>
<script>window.LogRocket && window.LogRocket.init('app/id');</script>

Discover how React Fiber works under the hood. Learn how React builds the DOM, handles concurrent rendering, and works alongside React 19 features and the new React Compiler.

Learn how to use Skybridge, an open-source React framework, to build and deploy cross-platform AI apps and interactive UI widgets for ChatGPT, Claude, and MCP clients from a single codebase.

Learn how to set up Meilisearch, index documents, and build keyword, semantic, and hybrid search with AI-powered retrieval.
Compare pnpm and npm across security defaults, disk usage, dependency strictness, and workspace policy to decide which package manager fits your project.
Would you be interested in joining LogRocket's developer community?
Join LogRocket’s Content Advisory Board. You’ll help inform the type of content we create and get access to exclusive meetups, social accreditation, and swag.
Sign up now