Editor’s note: This React Chart.js tutorial was last updated by Abhinav Anshul on 17 July 2024 to add information about how to create a dynamic chart using React Hooks and strategies for ensuring a smooth experience when working with large-scale data in your React charts.

Data visualization has always been an important part of software engineering and frontend development. It’s important to be able to offer users data visualization to help them better understand what is going on in our application.
Chart.js is a popular JavaScript library used to create flexible charts on websites. In this tutorial, we will cover how to use Chart.js in a React environment.
The Replay is a weekly newsletter for dev and engineering leaders.
Delivered once a week, it's your curated guide to the most important conversations around frontend dev, emerging AI tools, and the state of modern software.
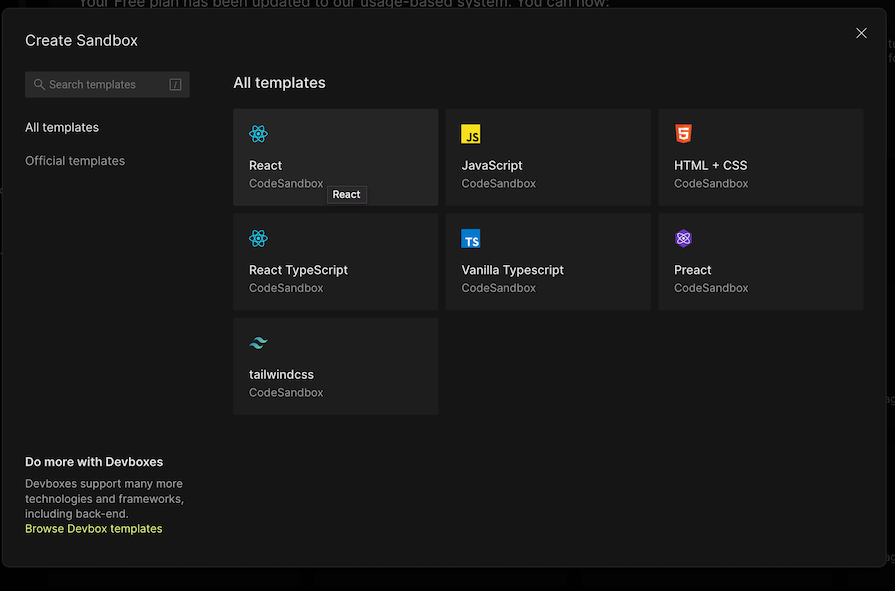
I’ll be using CodeSandbox to set up a new React app but you can set up a React application with whichever tool you’re comfortable with. The project’s Sandbox is available here.
To create a fresh React template in CodeSandbox, open a new tab in your browser and type in react.new or just head over to the CodeSandbox and create a new React project:
Next, in the dependencies section, add these two libraries:
If you’re working from the terminal, you can install these libraries with the following command:
npm install chart.js react-chartjs-2
react-chartjs-2 is a React wrapper for Chart.js 2.0 and 3.0, letting us use Chart.js elements as React components.
In this tutorial, we will create three charts that show the number of users gained in a company using sample data.
From the file tree, create a utils folder and add a Data.js file. Here, we’ll store the data and export it to a separate component for rendering the chart. Ideally, in a production app, this data would come up from an API, but to keep things simple, we’ll use static data for now.
Input the contents of Data.js with the code below:
// utils/Data.js
export const Data = [
  {
    id: 1,
    year: 2016,
    userGain: 80000,
    userLost: 823
  },
  {
    id: 2,
    year: 2017,
    userGain: 45677,
    userLost: 345
  },
  {
    id: 3,
    year: 2018,
    userGain: 78888,
    userLost: 555
  },
  {
    id: 4,
    year: 2019,
    userGain: 90000,
    userLost: 4555
  },
  {
    id: 5,
    year: 2020,
    userGain: 4300,
    userLost: 234
  }
];
You can now import this data and feed it to a Chart.js component to present it. But before we do so, let’s understand the API of the component in the react-chartjs-2 package.
react-chartjs-2 offers a variety of chart types to select from. These include bar, radial, pie, and more. The React components from this package accept several props, the two main ones being data and options.
The data prop takes in an object similar to the one below:
const data = {
        labels: ['Red', 'Orange', 'Blue'],
        // datasets is an array of objects where each object represents a set of data to display corresponding to the labels above. for brevity, we'll keep it at one object
        datasets: [
            {
              label: 'Popularity of colours'
              data: [55, 23, 96],
              // you can set indiviual colors for each bar
              backgroundColor: [
                'rgba(255, 255, 255, 0.6)'
                'rgba(255, 255, 255, 0.6)'
                'rgba(255, 255, 255, 0.6)'
              ],
              borderWidth: 1,
            }
        ]
}
backgroundColor and borderWidth are just some of the properties that can be added to the datasets array. View the full list of acceptable proprieties here.
Now that we know how the data object is set up, you can populate it with data from the Data.js file.
In App.js, we will replicate the schema for the data prop in a chartData variable created using the useState Hook.
The labels and dataset array can be populated with our makeshift data by using the JavaScript map method. Edit App.js with the following code:
// App.js
import Chart from "chart.js/auto";
import { CategoryScale } from "chart.js";
import { useState } from "react";
import { Data } from "./Data";
import "./styles.css";

Chart.register(CategoryScale);

export default function App() {
  const [chartData, setChartData] = useState({
    labels: Data.map((data) => data.year),
    datasets: [
      {
        label: "Users Gained ",
        data: Data.map((data) => data.userGain),
        backgroundColor: [
          "rgba(75,192,192,1)",
          "#ecf0f1",
          "#50AF95",
          "#f3ba2f",
          "#2a71d0"
        ],
        borderColor: "black",
        borderWidth: 2
      }
    ]
  });

  return (
    <div className="App">
      <p>Using Chart.js in React</p>
    </div>
  );
}
What we’ve done above is prepare the data we want to represent on different charts in an object named chartData. This state can then be passed to a PieChart component, which will render a pie chart.
Create a components folder in src and create an empty PieChart.js that you will import:
// App.js
import Chart from "chart.js/auto";
import { CategoryScale } from "chart.js";
import { useState } from "react";
import { Data } from "./Data";
import PieChart from "../components/PieChart";
import "./styles.css";

Chart.register(CategoryScale);

export default function App() {
  const [chartData, setChartData] = useState({
    // ...chart data
  });

  return (
    <div className="App">
      <PieChart chartData={chartData} />
    </div>
  );
The contents of PieChart.js will look like this:
// src/components/PieChart.js
import React from "react";
import { Pie } from "react-chartjs-2";

function PieChart({ chartData }) {
  return (
    <div className="chart-container">
      <h2 style={{ textAlign: "center" }}>Pie Chart</h2>
      <Pie
        data={chartData}
        options={{
          plugins: {
            title: {
              display: true,
              text: "Users Gained between 2016-2020"
            }
          }
        }}
      />
    </div>
  );
}
export default PieChart;
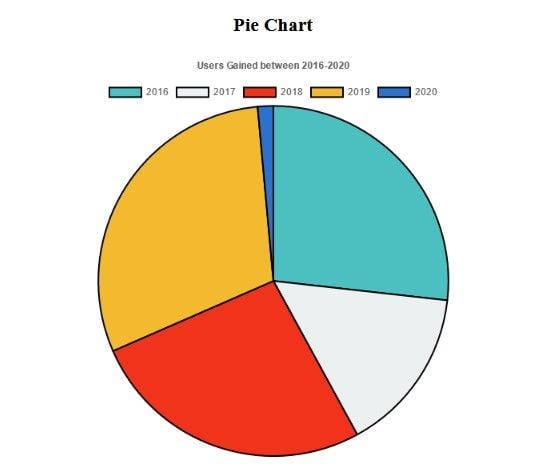
Here, we’ve imported the Pie React component from react-chartjs-2. The chartData is destructured and passed Pie’s data prop. I’ve also used the options object to tweak certain aspects of the chart, like the chart title and legend. Check out all the configurable options.
This should render the following chart:
To create a bar chart using Chart.js, first create a BarChat component and input the following code:
// components/BarChart.js
import { Bar } from "react-chartjs-2";
export const BarChart = ({ chartData }) => {
  return (
    <div className="chart-container">
      <h2 style={{ textAlign: "center" }}>Bar Chart</h2>
      <Bar
        data={chartData}
        options={{
          plugins: {
            title: {
              display: true,
              text: "Users Gained between 2016-2020"
            },
            legend: {
              display: false
            }
          }
        }}
      />
    </div>
  );
};
Now import this component into App.js:
// App.js
import Chart from "chart.js/auto";
import { CategoryScale } from "chart.js";
import { useState } from "react";
import { Data } from "./Data";
import PieChart from "../components/PieChart";
import BarChart from "../components/BarChart";
import "./styles.css";

Chart.register(CategoryScale);

export default function App() {
  const [chartData, setChartData] = useState({
    // ...chart data
  });

  return (
    <div className="App">
      <PieChart chartData={chartData} />
      <BarChart chartData={chartData} />
    </div>
  );
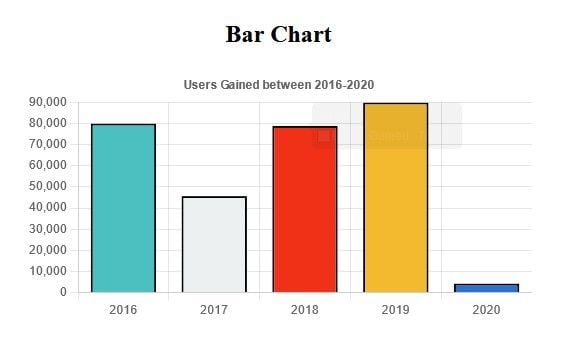
This will render the bar chart below:
For a line chart, create a LineChart component, just as we did for the previous two cases, and edit it with the following content:
// components/LineChart.js
import React from "react";
import { Line } from "react-chartjs-2";
function LineChart({ chartData }) {
  return (
    <div className="chart-container">
      <h2 style={{ textAlign: "center" }}>Line Chart</h2>
      <Line
        data={chartData}
        options={{
          plugins: {
            title: {
              display: true,
              text: "Users Gained between 2016-2020"
            },
            legend: {
              display: false
            }
          }
        }}
      />
    </div>
  );
}
export default LineChart;
Next, import this component into App.js:
// App.js
import Chart from "chart.js/auto";
import { CategoryScale } from "chart.js";
import { useState } from "react";
import { Data } from "./Data";
import PieChart from "../components/PieChart";
import BarChart from "../components/BarChart";
import LineChart from "../components/LineChart";
import "./styles.css";

Chart.register(CategoryScale);

export default function App() {
  const [chartData, setChartData] = useState({
    // ...chart data
  });

  return (
    <div className="App">
      <PieChart chartData={chartData} />
      <BarChart chartData={chartData} />
      <LineChart chartData={chartData} />
    </div>
  );
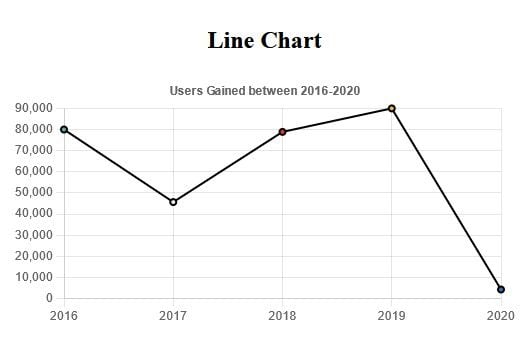
And that wraps up our project! The above configurations will render the line chart below:
Often, we need to update charts based on dynamic data. In those cases, a refresh button can be used to re-render the chart based on the new data.
In the pie chart example above, add a handler as follows:
<div className="App">
  <PieChart chartData={chartData} />
  <button onClick={refreshChartData}>Refresh Chart</button>
</div>
Now, create the refreshChartData function that will reset the state, based on the new data:
const refreshChartData = () => {
  setChartData({
    labels: Data.map((data) => data.year),
    datasets: [
      {
        label: "Users Gained",
        data: Data.map((data) => data.userGain * Math.random()),
        backgroundColor: ["rgba(75,192,192,1)", "#ecf0f1", "#50AF95", "#f3ba2f", "#2a71d0"],
        borderColor: "black",
        borderWidth: 2,
      },
    ],
  })
}
You can see this function is fetching the same static makeshift data that you defined earlier. However, in production apps, you will likely fetch data from an API that will provide the updated data, which is then passed to the setChartData Hook. According to the rules of the React useState Hook, whenever this state changes, the corresponding component, such as the <PieChart chartData={chartData} /> component, will rerender.
Let’s modify the logic based on a fetch call. First, the refreshChartData will do the fetch call that will pull the latest data from an API:
const refreshChartData = async () => {
    try {
      const data = await fetchChartData();
      setChartData(data);
    } catch (error) {
      console.error("Error fetching chart data:", error);
    }
  };

  const fetchChartData = async () => {
    const response = await fetch("https://example-api/chart-data");
    const data = await response.json();

    return {
      labels: data.map((item) => item.year),
      datasets: [
        {
          label: "Users Gained",
          data: data.map((item) => item.userGain),
          backgroundColor: [
            "rgba(75,192,192,1)",
            "#ecf0f1",
            "#50AF95",
            "#f3ba2f",
            "#2a71d0"
          ],
          borderColor: "black",
          borderWidth: 2,
        },
      ],
    };
  };
By combining everything together, you will have a dynamic pie chart that re-renders whenever you fetch fresh data:
import React, { useState } from "react";
import { CategoryScale } from "chart.js";
import { Pie } from "react-chartjs-2";
import "./styles.css";
// registration
Chart.register(CategoryScale);
const fetchChartData = async () => {
  const response = await fetch("https://api.example.com/chart-data");
  const data = await response.json();
  return {
    labels: data.map((item) => item.year),
    datasets: [
      {
        label: "Users Gained",
        data: data.map((item) => item.userGain),
        backgroundColor: [
          "rgba(75,192,192,1)",
          "#ecf0f1",
          "#50AF95",
          "#f3ba2f",
          "#2a71d0"
        ],
        borderColor: "black",
        borderWidth: 2
      }
    ]
  };
};
function PieChart({ chartData }) {
  return (
    <div className="chart-container">
      <h2 style={{ textAlign: "center" }}>Pie Chart</h2>
      <Pie
        data={chartData}
        options={{
          plugins: {
            title: {
              display: true,
              text: "Users Gained between 2016-2020"
            }
          }
        }}
      />
    </div>
  );
}
export default function App() {
  const [chartData, setChartData] = useState({
    labels: [],
    datasets: [
      {
        label: "Users Gained",
        data: [],
        backgroundColor: [],
        borderColor: "black",
        borderWidth: 2
      }
    ]
  });
  const refreshChartData = async () => {
    try {
      const data = await fetchChartData();
      setChartData(data);
    } catch (error) {
      console.error("Error fetching chart data:", error);
    }
  };
  return (
    <div className="App">
      <PieChart chartData={chartData} />
      <button onClick={refreshChartData}>Refresh Chart</button>
    </div>
  );
}
You can further improve this by removing the refreshChartData handler button and instead calling the API in intervals. For example, you can refresh the data every five minutes using the setInterval Web API.
While building large-scale apps in production, performance plays a crucial role in having a smooth experience that increases user retention. This is especially important while working with third-party libraries like Chart.js, which can have a significant impact on load time and overall app performance.
The following are some strategies to make sure you are on the right page and that the JavaScript bundle is as small as it can be while improving the load time:
react-chartjs-2 supports tree shaking out of the box. If you are using say, a pie chart, then make sure to have named imports like the following code snippet. This ensures you have no dead JavaScript code in the final code that is being served:
import { Pie } from "react-chartjs-2"
Always lazy load your chart components. As chart components are built on top of web canvas, it takes a little while to load its bundle. When you lazy load these components, it won’t block the main thread, and the rest of your application will download the bundle on the main JavaScript thread:
import React, { lazy } from "react";
const PieChart = lazy(() => import("./components/PieChart"));
If you are using the latest version of React, make use of the Suspense API, which will put your UI in a pending state until the chart has been loaded:
import React, { Suspense, lazy } from "react";
const PieChart = lazy(() => import("./components/PieChart"));
function App() {
  return (
     <div className="App">
       <Suspense fallback={<div>Loading...</div>}>
         <PieChart />
       </Suspense>
     </div>
  );
}
Using debounce and throttling techniques is a standard practice when calling an API. In the case of Chart.js, if you have frequent changes and updates, these techniques can be very useful. When a user is applying too many filters to your chart, debouncing and throttling will ensure that the final API call only happens after the user has finished making changes. This will prevent you from making multiple unnecessary API calls:
// you can also wrap this up in useCallback hook that will eliminate the repeat
// network calls
const fetchData = useCallback(
    // create your own debounce method or use a library
    debounce(async () => {
      // Fetch data here
    }, 300),
    []
);
Chart.js is a powerful tool for creating different types of charts in web applications. You’ve also seen how helpful the react-chartjs-2 package is for rendering these charts in React. I encourage you to visit the Chart.js documentation to learn more about the library and delve into the options object to see more ways to configure your charts.
Install LogRocket via npm or script tag. LogRocket.init() must be called client-side, not
server-side
$ npm i --save logrocket

// Code:

import LogRocket from 'logrocket';
LogRocket.init('app/id');
// Add to your HTML:

<script src="https://cdn.lr-ingest.com/LogRocket.min.js"></script>
<script>window.LogRocket && window.LogRocket.init('app/id');</script>

Understand best practices for structuring Node.js projects, such as separating roles using folder structures and practicing modular code.

How senior engineers run TypeScript effectively at scale in modern codebases.

Discover what’s new in The Replay, LogRocket’s newsletter for dev and engineering leaders, in the March 18th issue.

A CTO outlines his case for how leaders should prioritize complex thinking over framework knowledge when hiring engineers for the AI era.
Would you be interested in joining LogRocket's developer community?
Join LogRocket’s Content Advisory Board. You’ll help inform the type of content we create and get access to exclusive meetups, social accreditation, and swag.
Sign up now


2 Replies to "Using Chart.js in React"
You forgot to add some lines of code. Because of that I got some erros.
We need to register the category scale so in order to achieve that,
you to have include some imports and they are
import {CategoryScale} from ‘chart.js’;
import Chart from ‘chart.js/auto’;
and then in the our app component do like this
Chart.register(CategoryScale);
Thank you for bringing this to our attention. The code has been updated!